Reliability of the Percent Density in Digital Mammography with a Semi-Automated Thresholding Method
- Affiliations
-
- 1Department of Surgery, Asan Medical Center, University of Ulsan College of Medicine, Seoul, Korea. asanbreastcenter@gmail.com
- 2Department of Radiology, Health Promotion Center, Asan Medical Center, University of Ulsan College of Medicine, Seoul, Korea.
- 3Department of Biostatistics and Clinical Epidemiology, Asan Medical Center, University of Ulsan College of Medicine, Seoul, Korea.
- 4Department of Radiology and Research Institute of Radiology, Asan Medical Center, University of Ulsan College of Medicine, Seoul, Korea.
- 5Department of Oncology, Asan Medical Center, University of Ulsan College of Medicine, Seoul, Korea.
- 6Department of Epidemiology, School of Public Health and Institution of Health and Environment, Seoul National University, Seoul, Korea.
- 7Graduate School of Public Health, Seoul National University, Seoul, Korea.
Abstract
- PURPOSE
The reliability of the quantitative measurement of breast density with a semi-automated thresholding method (Cumulus(TM)) has mainly been investigated with film mammograms. This study aimed to evaluate the intrarater reproducibility of percent density (PD) by Cumulus(TM) with digital mammograms.
METHODS
This study included 1,496 craniocaudal digital mammograms from the unaffected breast of breast cancer patients. One rater reviewed each mammogram and estimated the PD using the Cumulus(TM) method. All images were reassessed by the same rater 1 month later without reference to the previously assigned values. The repeatability of the PD was evaluated by an intraclass correlation coefficient (ICC). All patients were grouped based on their body mass index (BMI), age, family history of breast cancer, breastfeeding history and breast area (calculated with Cumulus(TM)), and subgroup analysis for the ICC of each group was performed. All patients were categorized by their Breast Imaging Reporting and Data System (BI-RADS) density pattern, and the mean and standard deviation of the PD by each BI-RADS categories were compared.
RESULTS
The ICC for the PD was 0.94, indicating excellent repeatability. The discrepancy between the paired PD values ranged from 0 to 23.93, with an average of 3.90 (standard deviation=3.39). The subgroup ICCs for the PD ranged from 0.88 to 0.96, indicating excellent reliability in all subgroups regardless of patient variables. The ICCs of the PD for the high-risk (BI-RADS 3 and 4) and low-risk (BI-RADS 1 and 2) groups were 0.90 and 0.88, respectively.
CONCLUSION
This study suggests that PD calculated with digital mammograms has an acceptable reliability regardless of patient age, BMI, family history of breast cancer, breastfeeding history, breast size, and BI-RADS density pattern.
Keyword
MeSH Terms
Figure
-
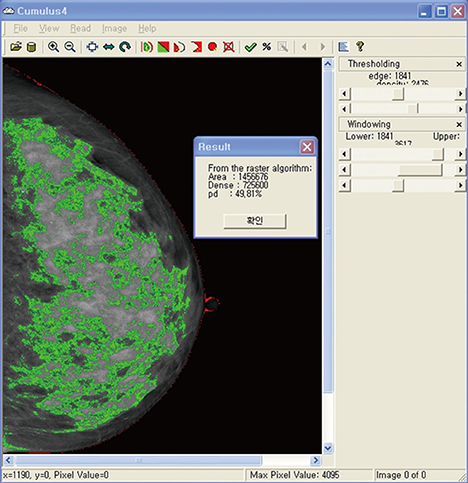
Figure 1 Computer assisted semi-automated thresholding method, Cumulus™. The green area indicates dense area, and the red line indicates total breast area.
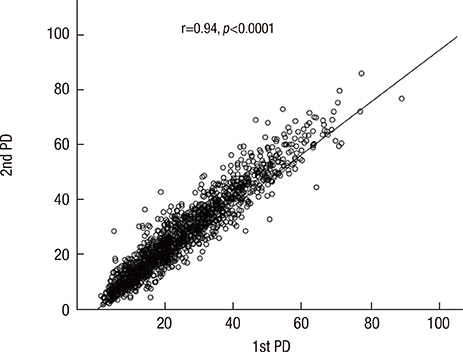
Figure 2 Intrarater reproducibility for two percent density value by one rater calculated with Cumulus™. Intraclass correlation coefficient between two PD values was 0.94, which indicates excellent agreement between two values.

Figure 3 This histogram represents the distribution of the difference between two percent density (PD) values by one rater. 70.9% fell in within difference of 5, and 94.4% within difference of 10 between two paired PD values.
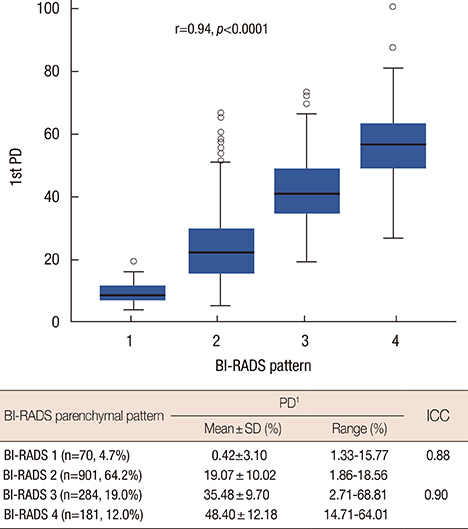
Figure 4 This distribution plot represents the distribution of first measured percent density (PD) value in each Breast Imaging Reporting and Data System (BI-RADS) density pattern group. The attached table indicates intraclass correlation coefficient (ICC) between two PD values by one rater in fatty breast group (BI-RADS 1 and 2), and in dense breast group (BI-RADS 3 and 4) separately.
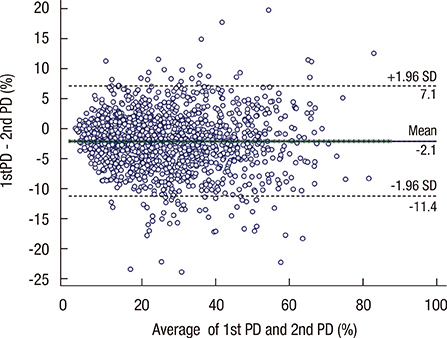
Figure 5 Bland-Altman plot of discrepancy between the two pared percent density (PD) values. X-axis indicates the average of two PD values and Y-axis indicates the discrepancy between two PD values, and in overall this plot represents the distribution of the discrepancy between two PD values, and it doesn't show any specific pattern in its distribution. SD=standard deviation.
Reference
-
1. Boyd NF, Guo H, Martin LJ, Sun L, Stone J, Fishell E, et al. Mammographic density and the risk and detection of breast cancer. N Engl J Med. 2007; 356:227–236.
Article2. McCormack VA, dos Santos Silva I. Breast density and parenchymal patterns as markers of breast cancer risk: a meta-analysis. Cancer Epidemiol Biomarkers Prev. 2006; 15:1159–1169.
Article3. Harvey JA, Bovbjerg VE. Quantitative assessment of mammographic breast density: relationship with breast cancer risk. Radiology. 2004; 230:29–41.
Article4. Cummings SR, Tice JA, Bauer S, Browner WS, Cuzick J, Ziv E, et al. Prevention of breast cancer in postmenopausal women: approaches to estimating and reducing risk. J Natl Cancer Inst. 2009; 101:384–398.
Article5. Boyd NF, Rommens JM, Vogt K, Lee V, Hopper JL, Yaffe MJ, et al. Mammographic breast density as an intermediate phenotype for breast cancer. Lancet Oncol. 2005; 6:798–808.
Article6. Morishita M, Ohtsuru A, Hayashi T, Isomoto I, Itoyanagi N, Maeda S, et al. Clinical significance of categorisation of mammographic density for breast cancer prognosis. Int J Oncol. 2005; 26:1307–1312.
Article7. Kim J, Han W, Moon HG, Ahn SK, Shin HC, You JM, et al. Breast density change as a predictive surrogate for response to adjuvant endocrine therapy in hormone receptor positive breast cancer. Breast Cancer Res. 2012; 14:R102.
Article8. Park CC, Rembert J, Chew K, Moore D, Kerlikowske K. High mammographic breast density is independent predictor of local but not distant recurrence after lumpectomy and radiotherapy for invasive breast cancer. Int J Radiat Oncol Biol Phys. 2009; 73:75–79.
Article9. Highnam R, Jeffreys M, McCormack V, Warren R, Davey Smith G, Brady M. Comparing measurements of breast density. Phys Med Biol. 2007; 52:5881–5895.
Article10. Diorio C, Pollak M, Byrne C, Mâsse B, Hébert-Croteau N, Yaffe M, et al. Insulin-like growth factor-I, IGF-binding protein-3, and mammographic breast density. Cancer Epidemiol Biomarkers Prev. 2005; 14:1065–1073.
Article11. Wolfe JN, Saftlas AF, Salane M. Mammographic parenchymal patterns and quantitative evaluation of mammographic densities: a case-control study. AJR Am J Roentgenol. 1987; 148:1087–1092.
Article12. Byng JW, Boyd NF, Fishell E, Jong RA, Yaffe MJ. The quantitative analysis of mammographic densities. Phys Med Biol. 1994; 39:1629–1638.
Article13. American College of Radiology. ACR Breast Imaging Reporting and Data System. Reston: American College of Radiology;1993.14. American College of Radiology. ACR Breast Imaging Reporting and Data System Atlas. Reston: American College of Radiology;2003.15. Grove JS, Goodman MJ, Gilbert FI Jr, Russell H. Wolfe's mammographic classification and breast cancer risk: the effect of misclassification on apparent risk ratios. Br J Radiol. 1985; 58:15–19.
Article16. Byrne C, Schairer C, Wolfe J, Parekh N, Salane M, Brinton LA, et al. Mammographic features and breast cancer risk: effects with time, age, and menopause status. J Natl Cancer Inst. 1995; 87:1622–1629.
Article17. Saftlas AF, Hoover RN, Brinton LA, Szklo M, Olson DR, Salane M, et al. Mammographic densities and risk of breast cancer. Cancer. 1991; 67:2833–2838.
Article18. Boyd NF, Byng JW, Jong RA, Fishell EK, Little LE, Miller AB, et al. Quantitative classification of mammographic densities and breast cancer risk: results from the Canadian National Breast Screening Study. J Natl Cancer Inst. 1995; 87:670–675.
Article19. Kato I, Beinart C, Bleich A, Su S, Kim M, Toniolo PG. A nested case-control study of mammographic patterns, breast volume, and breast cancer (New York City, NY, United States). Cancer Causes Control. 1995; 6:431–438.
Article20. Gao J, Warren R, Warren-Forward H, Forbes JF. Reproducibility of visual assessment on mammographic density. Breast Cancer Res Treat. 2008; 108:121–127.
Article21. Boyd NF, Lockwood GA, Martin LJ, Knight JA, Jong RA, Fishell E, et al. Mammographic densities and risk of breast cancer among subjects with a family history of this disease. J Natl Cancer Inst. 1999; 91:1404–1408.
Article22. Martin LJ, Melnichouk O, Guo H, Chiarelli AM, Hislop TG, Yaffe MJ, et al. Family history, mammographic density, and risk of breast cancer. Cancer Epidemiol Biomarkers Prev. 2010; 19:456–463.
Article23. Tagliafico A, Tagliafico G, Tosto S, Chiesa F, Martinoli C, Derchi LE, et al. Mammographic density estimation: comparison among BI-RADS categories, a semi-automated software and a fully automated one. Breast. 2009; 18:35–40.
Article24. Gram IT, Bremnes Y, Ursin G, Maskarinec G, Bjurstam N, Lund E. Percentage density, Wolfe's and Tabár's mammographic patterns: agreement and association with risk factors for breast cancer. Breast Cancer Res. 2005; 7:R854–R861.
Article25. Kataoka M, Atkinson C, Warren R, Sala E, Day NE, Highnam R, et al. Mammographic density using two computer-based methods in an isoflavone trial. Maturitas. 2008; 59:350–357.
Article26. Heine JJ, Carston MJ, Scott CG, Brandt KR, Wu FF, Pankratz VS, et al. An automated approach for estimation of breast density. Cancer Epidemiol Biomarkers Prev. 2008; 17:3090–3097.
Article27. Harvey JA. Quantitative assessment of percent breast density: analog versus digital acquisition. Technol Cancer Res Treat. 2004; 3:611–616.
Article28. Jeon JH, Kang JH, Kim Y, Lee HY, Choi KS, Jun JK, et al. Reproductive and hormonal factors associated with fatty or dense breast patterns among Korean women. Cancer Res Treat. 2011; 43:42–48.
Article29. Boyd NF. Tamoxifen, mammographic density, and breast cancer prevention. J Natl Cancer Inst. 2011; 103:704–705.
Article30. Cuzick J, Warwick J, Pinney E, Duffy SW, Cawthorn S, Howell A, et al. Tamoxifen-induced reduction in mammographic density and breast cancer risk reduction: a nested case-control study. J Natl Cancer Inst. 2011; 103:744–752.
Article
- Full Text Links
-
- Actions
-
Cited
- CITED
-
- Close
- Share
-
- Similar articles
-
- Digital Mammography
- Adaptive Thresholding for Pap-Smear
- Inter-observer and intra-observer reliability between manual segmentation and semi-automated segmentation for carotid vessel wall volume measurements on three-dimensional ultrasonography
- Comparative accuracy of artificial intelligence-based AudaxCeph software, Dolphin software, and the manual technique for orthodontic landmark identification and tracing of lateral cephalograms
- Mammography-Guided Interventional Procedure
