J Korean Ophthalmol Soc.
2008 Nov;49(11):1819-1828.
Correlation of OCT and Hemifield Pattern VEP in Hemianopia
- Affiliations
-
- 1Department of Ophthalmology, Soonchunhyang University School of Medicine, Seoul, Korea. parksonghee55@hanmail.net
Abstract
- PURPOSE
To analyze the correlation between RNFL thickness changes measured by OCT and hemifield pattern VEP in hemianopic visual field loss.
METHODS
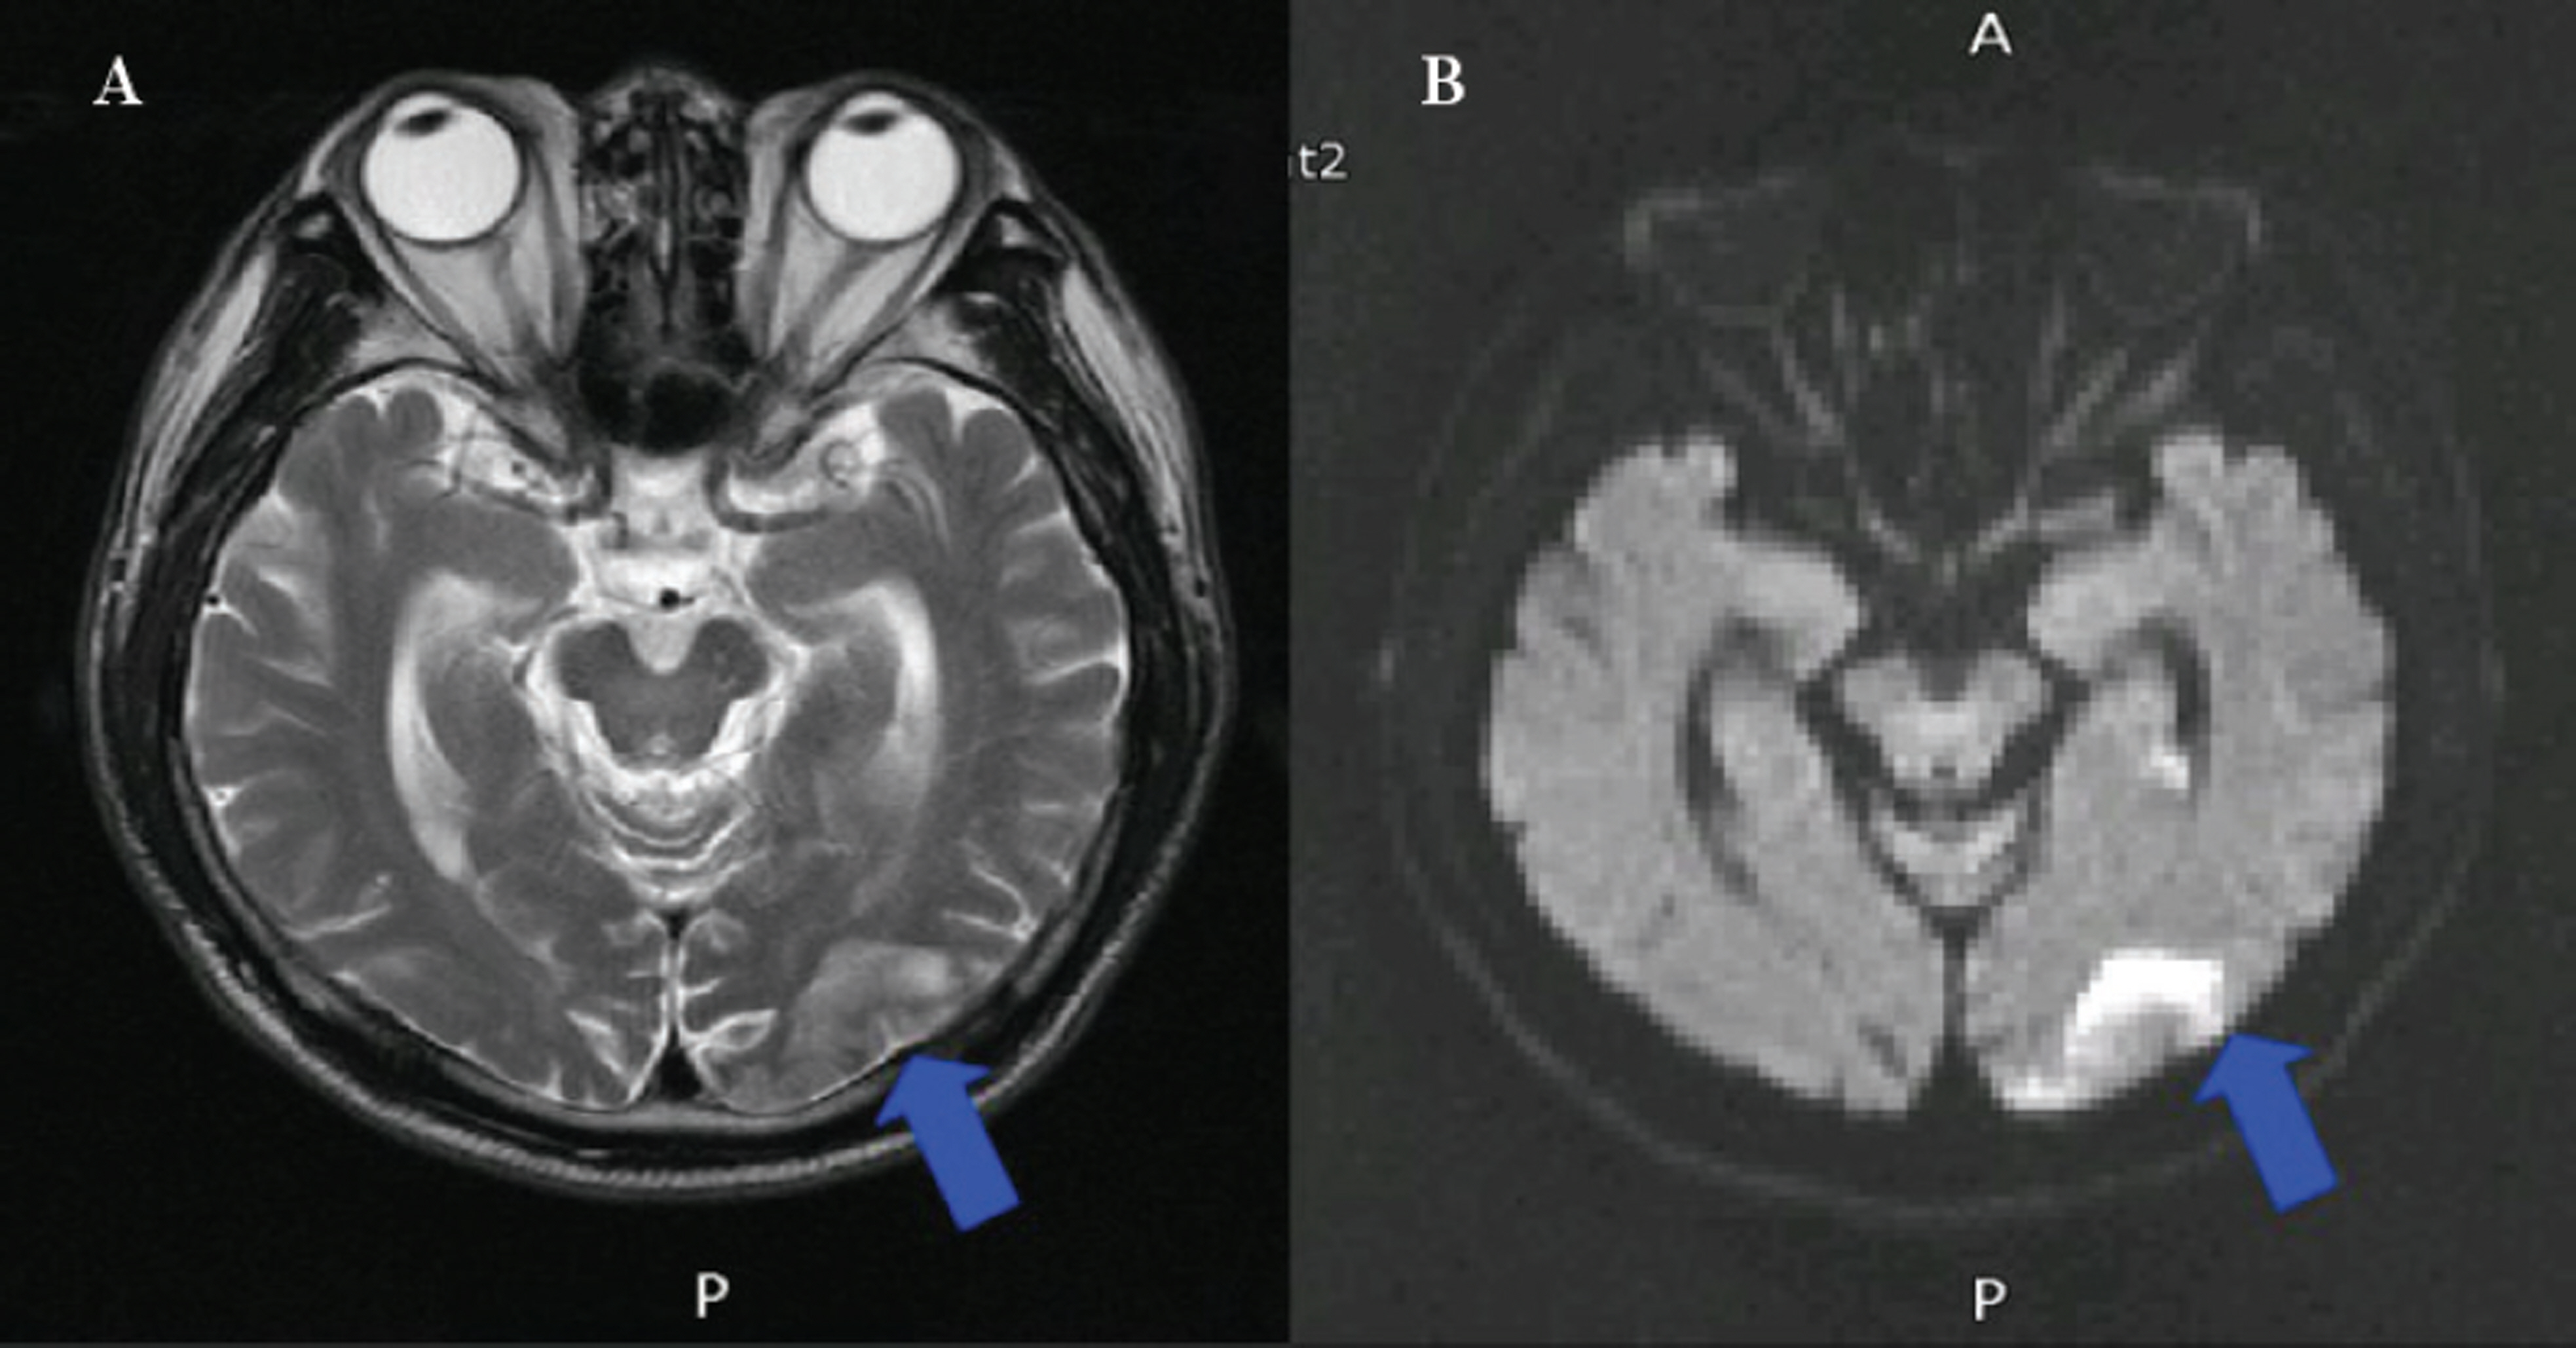
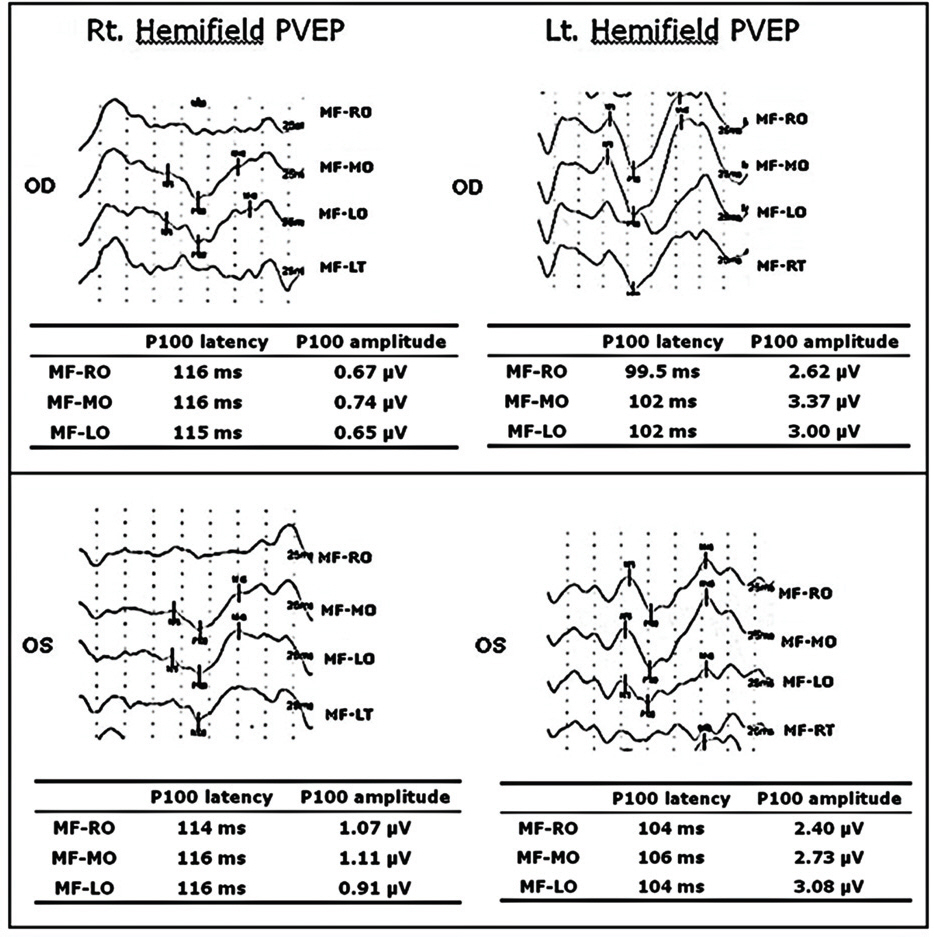
Twelve eyes of six patients with hemianopia were studied. Two patients had bitemporal hemianopia caused by chiasmal tumor, one patient had inferior hemianopia caused by traumatic optic neuropathy, and three patients had homonymous hemianopia caused by occipital lobe lesions. The retinal nerve fiber layer thickness around the optic disc was measured by optical coherence tomography (OCT) and visual pattern evoked potentials were measured using hemifield stimulations.
RESULTS
Normal eyes of traumatic optic neuropathy patients were excluded from the analysis. The retinal nerve fiber layer thickness as measured by OCT corresponded to the visual field defect in 9 of 11 eyes (81.8%) and the hemifield pattern VEP response corresponded to visual field defect in 7 of 11 eyes (63.6%).
CONCLUSIONS
RNFL thickness measurement by OCT and hemifield PVEP are useful in evaluation of patients with hemianopia. However, they should be performed with caution, and compared with various clinical examinations because of their incomplete correlation with visual field defects.
MeSH Terms
Figure
Reference
-
References
1. Huang D, Swanson EA, Lin CP, et al. Optical coherence tomography. Science. 1991; 54:1178–81.
Article2. Schuman JS, Hee MR, Arya AV, et al. Optical coherence tomography : a new tool for glaucoma diagnosis. Curr Opin Ophthalmol. 1995; 6:89–95.3. Schuman JS, Pedut-Kloizman T, Hertzmark E, et al. Reprodu- cibility of nerve fiber layer thickness measurements using optical coherence tomography. Ophthalmology. 1996; 103:1889–98.4. Blumenthal EZ, Williams JM, Weinreb RN, et al. Reproducibility of nerve fiber layer thickness measurements by use of optical coherence tomography. Ophthalmology. 2000; 2278–82.5. Carpineto P, Ciancaglini M, Zuppardi E, et al. Reliability of nerve fiber layer thickenss measurements using optical coherence tomography in normal and glaucomatous eyes. Ophthalmology. 2003; 110:190–5.6. Kanamori A, Nakamura M, Escano MF, et al. Evaluation of the glaucomatous damage on retinal nerve fiber layer thickness measured by optical coherence tomography. Am J Ophthalmol. 2003; 135:513–20.
Article7. Bowd C, Weinreb RN, Williams JM, Zangwill LM. The retinal nerve fiber layer thickness in ocular hypertensive, normal, and glaucomatous eyes with optical coherence tomography. Arch Ophthalmol. 2000; 118:22–6.
Article8. Soliman MA, Van Den Berg TJ, Ismaeil AA, et al. Retinal nerve fiber layer analysis: relationship between optical coherence tomography and red-free photography. Am J Ophthalmol. 2002; 133:187–95.
Article9. Zangwill LM, Williams J, Berry CC, et al. A comparison of optical coherence tomography and retinal nerve fiber layer photography for detection of nerve fiber layer damage in glaucoma. Ophthalmology. 2000; 107:1309–15.
Article10. Kanamori A, Nakamura M, Matsui N, et al. Optical coherence tomography detects characteristic retinal nerve fibre layer thickness corresponding to band atrophy of the optic discs. Ophthalmology. 2004; 111:2278–83.11. Mehta JS, Plant GT. Optical coherence tomography (OCT) findings in congenital/longstanding homonymous hemianopia. Am J Ophthalmol. 2005; 140:727–9.
Article12. Monteiro ML, Leal BC, Rosa AA, Bronstein MD. Optical coherence tomography analysis of axonal loss in band atrophy of the optic nerve. Br J Ophthalmol. 2004; 88:896–9.
Article13. Moteiro ML, Moura FC, Medeiros FA. Diagnostic ability of optical coherence tomography with a normative database to detect band atrophy of the optic nerve. Am J Ophthalmol. 2007; 143:896–9.14. American Clinial Neurophysiology Society. Guideline 9B: Guidelines on Visual Evoked Potentials. J Clin Neurophysiol. 2006; 23:138–56.15. Miller NR, Newman NJ. Walsh and Hoyt’s Clinical Neuro- ophthalmology, 5th ed. Vol. 1. Baltimore: Williams & Wilkins;1998; 307–22.16. Hoyt WF, Luis O. The primate chiasm. Details of visual fiber organization studied by silver impregnation techniques. Arch Ophthalmol. 1963; 70:69–85.
Article17. Miller NR, Newman NJ. Walsh and Hoyt’s Clinical Neuro- ophthalmology, 5th ed. Vol. 1. Baltimore: Williams & Wilkins;1998; 50–3.18. Brecelj J. A VEP study of the visual pathway function in compressive lesions of the optic chiasm. Full-field versus half-field stimulation. Electroencephalogra Clin Neurophysiol. 1992; 84:209–18.19. Flanagan JG, Harding GF. Multi-channel visual evoked potentials in early compressive lesions of the chiasm. Doc Ophthalmol. 1988; 69:271–81.
Article20. Bumgartner J, Epstein CM. Voluntary alteration of visual evoked potentials. Ann Neurol. 1982; 12:475–8.
Article21. Morgan RK, Nugent B, Harrison JM, O’Connor PS. Voluntary alternation of pattern visual evoked responses. Ophthalmology. 1985; 92:1356–63.22. Thompson HS. Functional visual loss. Am J Ophthalmol. 1985; 100:209–13.
Article
- Full Text Links
- Actions
-
Cited
- CITED
-
- Close
- Share
- Similar articles
-
- Association of Retinal Nerve Fiber Layer Thickness Measured by Optical Coherence Tomography and Automatic Perimetry
- RNFL and Ganglion Cell Complex Thickness in Normal Hemifield According to the Severity of Glaucoma
- Reversible Homonymous Hemianopia Associated with Focal Hyperperfusion in Hyperglycemic State
- Variability and application of VEP components in Transient VEP and Steady VEP
- A Case of Optic Neuritis Involving Optic Chiasm

