J Korean Soc Radiol.
2013 Dec;69(6):449-455.
Dynamic CT Findings of Pulmonary Hamartoma: A Comparison with Histopathologic Findings
- Affiliations
-
- 1Department of Radiology, Pusan National University Hospital, Pusan National University School of Medicine and Medical Research Institute, Busan, Korea. jeongyj@pusan.ac.kr
- 2Department of Pathology, Pusan National University Hospital, Pusan National University School of Medicine and Medical Research Institute, Busan, Korea.
- 3Department of Radiology, Pusan National University Yangsan Hospital, Pusan National University School of Medicine and Medical Research Institute, Yangsan, Korea.
- 4Department of Thoracic and Cardiovascular Surgery, Pusan National University Hospital, Pusan National University School of Medicine and Medical Research Institute, Busan, Korea.
Abstract
- PURPOSE
To describe the dynamic CT findings of pulmonary hamartoma and to compare these findings with histopathologic findings.
MATERIALS AND METHODS
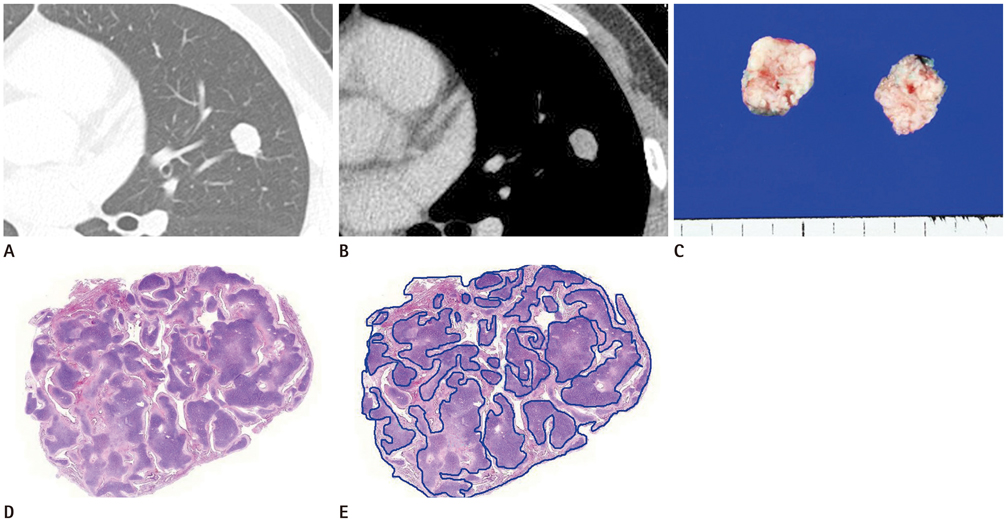
The Institutional Review Board approved this retrospective study and the requirement for patient informed consent was waived. The hemodynamic CT features of 11 patients (M : F = 6 : 5; mean age, 53.6 years) with pathologically proven pulmonary hamartoma were evaluated. All 11 patients underwent enhanced dynamic CT using a helical technique. A series of images were obtained throughout each nodule with 2.5-mm collimation at 0, 30, 60, 90 and 120 seconds and at 4, 5 and 15 minutes after an intravenous injection of contrast medium. Extents and patterns of enhancement were correlated with histologic tumor components.
RESULTS
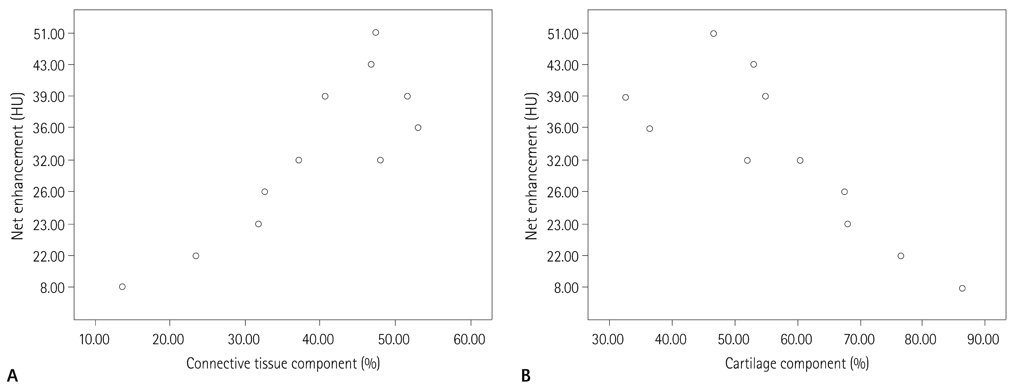
All 11 tumors showed persistent enhancement with variable degrees of net enhancement [mean tumor peak enhancement, 48.6 +/- 19.0 Hounsfield unit (HU); mean tumor net enhancement, 31.9 +/- 11.8 HU] and thick capsular and septal enhancement. Histologically, all 11 tumors were composed of mature cartilage and loose mesenchymal tissue. A significant positive correlation was found between the net enhancement values and loose connective tissue component percentages (r = 0.749, p = 0.008); further, a negative correlation was found between the net enhancement values and cartilaginous component percentages (r = -0.813, p = 0.002).
CONCLUSION
On dynamic CT, hamartoma exhibited persistent enhancement without washout as well as thick capsular and septal enhancements. Net enhancement values were found to be positively correlated with the proportion of the loose connective tissue component. Thick capsular and septal enhancements were attributed histopathologically to loose connective tissue, separating tumors into cartilaginous lobules.
MeSH Terms
Figure
Reference
-
1. Gjevre JA, Myers JL, Prakash UB. Pulmonary hamartomas. Mayo Clin Proc. 1996; 71:14–20.2. Saqi A, Shaham D, Scognamiglio T, Murray MP, Henschke CI, Yankelevitz D, et al. Incidence and cytological features of pulmonary hamartomas indeterminate on CT scan. Cytopathology. 2008; 19:185–191.3. Seda G, Amundson D, Lin MY. Predominant cartilaginous hamartoma: an unusual variant of chondromatous hamartoma. South Med J. 2010; 103:169–171.4. Swensen SJ, Brown LR, Colby TV, Weaver AL. Pulmonary nodules: CT evaluation of enhancement with iodinated contrast material. Radiology. 1995; 194:393–398.5. Siegelman SS, Khouri NF, Scott WW Jr, Leo FP, Hamper UM, Fishman EK, et al. Pulmonary hamartoma: CT findings. Radiology. 1986; 160:313–317.6. Whyte RI, Donington JS. Hamartomas of the lung. Semin Thorac Cardiovasc Surg. 2003; 15:301–304.7. Jeong YJ, Lee KS, Jeong SY, Chung MJ, Shim SS, Kim H, et al. Solitary pulmonary nodule: characterization with combined wash-in and washout features at dynamic multi-detector row CT. Radiology. 2005; 237:675–683.8. Potente G, Macori F, Caimi M, Mingazzini P, Volpino P. Noncalcified pulmonary hamartomas: computed tomography enhancement patterns with histologic correlation. J Thorac Imaging. 1999; 14:101–104.9. Muramatsu Y, Takayasu K, Moriyama N, Shima Y, Goto H, Ushio K, et al. Peripheral low-density area of hepatic tumors: CT-pathologic correlation. Radiology. 1986; 160:49–52.10. Takayasu K, Ikeya S, Mukai K, Muramatsu Y, Makuuchi M, Hasegawa H. CT of hilar cholangiocarcinoma: late contrast enhancement in six patients. AJR Am J Roentgenol. 1990; 154:1203–1206.11. Furukawa H, Takayasu K, Mukai K, Kanai Y, Inoue K, Kosuge T, et al. Late contrast-enhanced CT for small pancreatic carcinoma: delayed enhanced area on CT with histopathological correlation. Hepatogastroenterology. 1996; 43:1230–1237.12. Park KY, Kim SJ, Noh TW, Cho SH, Lee DY, Paik HC, et al. Diagnostic efficacy and characteristic feature of MRI in pulmonary hamartoma: comparison with CT, specimen MRI, and pathology. J Comput Assist Tomogr. 2008; 32:919–925.13. Poirier TJ, Van Ordstrand HS. Pulmonary chondromatous hamartomas. Report of seventeen cases and review of the literature. Chest. 1971; 59:50–55.14. Hochhegger B, Marchiori E, dos Reis DQ, Souza AS Jr, Souza LS, Brum T, et al. Chemical-shift MRI of pulmonary hamartomas: initial experience using a modified technique to assess nodule fat. AJR Am J Roentgenol. 2012; 199:W331–W334.
- Full Text Links
- Actions
-
Cited
- CITED
-
- Close
- Share
- Similar articles
-
- CT Findings of Pulmonary Hamartoma: Analysis of 16 Histopathologically-proven Cases
- Dynamic Computed Tomography Findings of Atypical Pulmonary Hamartoma and It's Pathologic Correlations: A Case Report
- Fine Needle Aspiration Cytology of Pulmonary Hamartoma
- Diagnostic Usefulness of MRI for Pulmonary Hamartoma: CT, MRI and Histopathologic Correlations
- Pulmonary Heterotopic Ossification Simulating a Pulmonary Hamartoma: Imaging and Pathologic Findings and Differential Diagnosis


