Shear Wave Elastography for Detection of Prostate Cancer: A Preliminary Study
- Affiliations
-
- 1Department of Radiology, Seoul National University Hospital, Seoul 110-744, Korea. iwishluv@empas.com
- 2Institute of Radiation Medicine and Kidney Research Institute, Seoul National University Medical Research Center, Seoul 110-744, Korea.
- KMID: 2078644
- DOI: http://doi.org/10.3348/kjr.2014.15.3.346
Abstract
OBJECTIVE
To assess the diagnostic value of shear wave elastography (SWE) for prostate cancer detection.
MATERIALS AND METHODS
In this retrospective study, 87 patients with the suspicion of prostate cancer (prostate-specific antigen > 4 ng/mL and abnormal digital rectal examination) underwent a protocol-based systematic 12-core biopsy followed by targeted biopsy at hypoechoic areas on grey-scale ultrasound. Prior to biopsy, SWE was performed by placing two circular 5 mm-sized regions of interest (ROIs) along the estimated biopsy tract in each sector and one ROI for hypoechoic lesions. SWE parameters, S (mean stiffness) and R (mean stiffness ratio), were calculated and compared regarding different histopathologic tissues and their accuracy for diagnosing prostate cancer was analyzed. SWE parameters were correlated with Gleason score and were compared between indolent (< 8) and aggressive (> or = 8) tissues in prostate cancer patients.
RESULTS
Prostate cancer was detected in 7.5% of 1058 cores in 29.9% of 87 patients. Seven (43.8%) of 16 hypoechoic lesions were confirmed as prostate cancer. SWE parameters were significantly different among the histopathologic entities (p < 0.001). Prostate cancer was stiffer than benign tissues (p < or = 0.003). Sensitivity, specificity and receiver operating characteristic curve area for diagnosing cancer were 43%, 80.8%, and 0.599, respectively, for a cutoff of S > 43.9 kPa and 60.8%, 66.4%, and 0.653, respectively, for R > 3. Both, S and R showed a significant correlation with Gleason score (r > or = 0.296, p < or = 0.008) and were significantly different between indolent and aggressive prostate cancer (p < or = 0.006).
CONCLUSION
Shear wave elastographic parameters are significantly different between prostate cancer and benign prostate tissue and correlate with Gleason score.
MeSH Terms
-
Adult
Aged
Aged, 80 and over
Biopsy
Elasticity Imaging Techniques/*methods
Humans
Male
Middle Aged
Neoplasm Grading
Prostate/pathology/*ultrasonography
Prostate-Specific Antigen/blood
Prostatic Neoplasms/pathology/*ultrasonography
ROC Curve
Retrospective Studies
Sensitivity and Specificity
Ultrasonography, Interventional/methods
Prostate-Specific Antigen
Figure
-
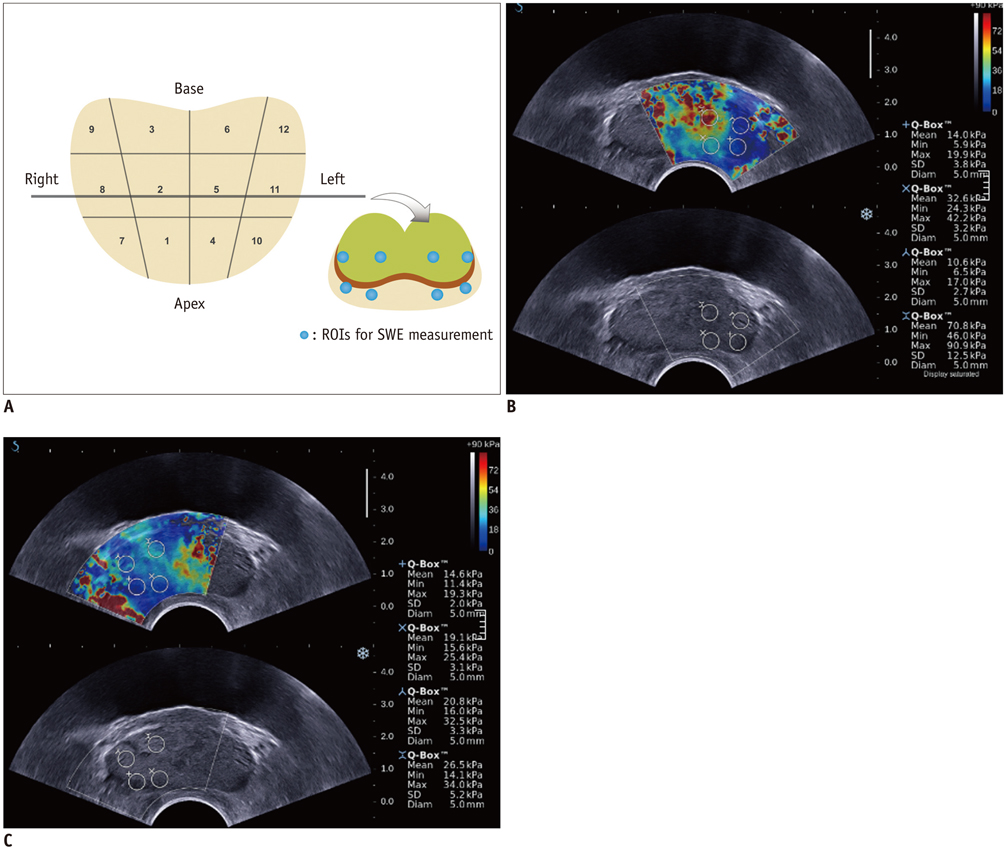
Fig. 1 Distribution of 12 sectors for systematic 12-core biopsy and acquisition of shear wave elastographic (SWE) parameters. A. Twelve systematic cores consisting of paramedian (1-6) and lateral (7-12) cores from base, mid-level and apex at each side of prostate gland. Image on lower right is representative axial slice at mid-level of prostate gland which is demonstrated as with line traversing schematic drawing of prostate on left. B, C. SWE images acquired in 57-year-old man demonstrate total of four 5-mm-sized regions of interest (ROI), two each at paramedian and lateral sectors, placed along estimated path of core biopsy at left (B) and right (C) prostate glands. Left upper paramedian ROI demonstrates higher stiffness (red color) than surrounding prostate tissue (blue color) in left lateral and right areas. Quantitative SWE parameters of this sector were 52.9 kPa and 6.4 for S and R, respectively. Upon 12-core biopsy, this area was confirmed as prostate cancer with Gleason score of 7.

Fig. 2 80-year-old man with prostate cancer in focal lesion with hypoechogenicity and elevated stiffness on shear wave elastography. A. After acquisition of shear wave elastographic images, region of interest was placed at and around focal lesion with hypoechogenicity compared with surrounding prostate gland. After three region of interest measurements, mean S and R were 191.2 kPa and 11.2, respectively. B. Dotted line shows needle guide for real-time biopsy targeted at focal lesion which was confirmed as prostate cancer with Gleason score of 7 at pathology.
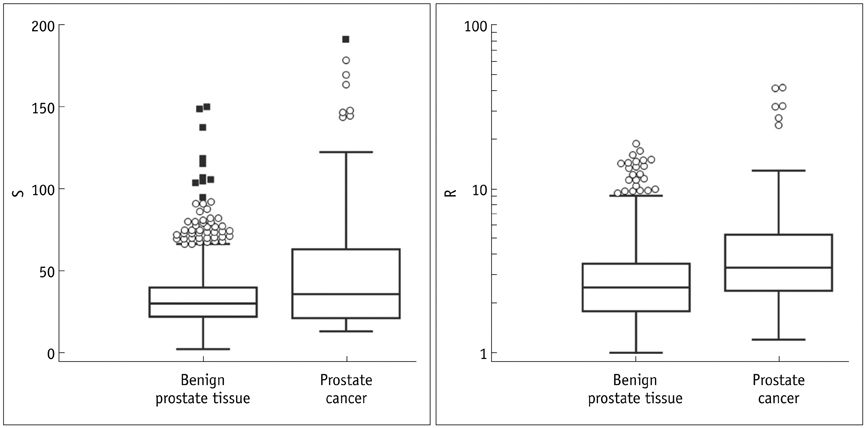
Fig. 3 Shear wave elastographic parameters according to histopathology. Shear wave elastographic parameters were significantly different between prostate cancer and benign prostatic tissue. Mean S and R values were 54.6 kPa and 6.0 for prostate cancer, and 33.4 kPa and 3.1 for benign prostate tissues (p < 0.001 and p = 0.003 for S and R) respectively. Mean stiffness (S) = mean value of Young' modulus measured from two regions of interest placed along estimated path for core biopsy for each of 12 sectors. Mean stiffness ratio (R) = ratio of S of sector to that of lowest S of patient.

Fig. 4 Receiver operating characteristic curve analyses in differentiation of benign and malignant prostate tissue using shear wave elastography parameters. Prostate cancer could be predicted with sensitivity and specificity of 43.0% (95% confidence interval [CI], 31.9-54.7%) and 80.8% (95% CI, 78.2-83.2%) using cutoff value of S > 43.9 kPa (area under the curve [AUC] = 0.599; 95% CI, 0.569-0.629) and those of 60.8% (95% CI, 49.1-71.6) and 66.4% (95% CI, 63.3-69.4) with cutoff value of R > 3 (AUC = 0.653, 95% CI, 0.624-0.682). Mean stiffness (S) = mean value of Young' modulus measured from two regions of interest placed along estimated path for core biopsy for each of 12 sectors. Mean stiffness ratio (R) = ratio of S of sector to that of lowest S of patient.
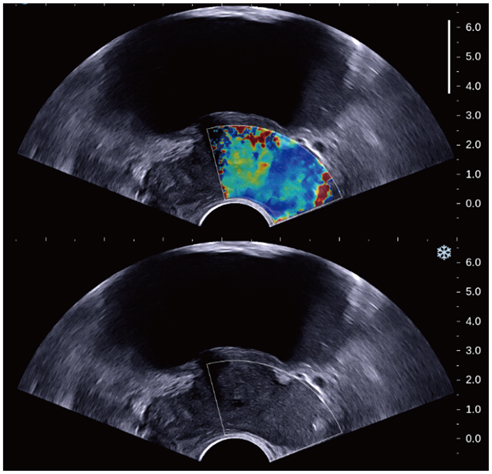
Fig. 5 80-year-old man with prostate cancer in focal lesion in peripheral zone with elevated stiffness on shear wave elastography but negative findings on grey-scale ultrasound. Focal lesion in peripheral zone at left lateral base demonstrated with persistent elevated stiffness but without abnormal finding on grey-scale ultrasound. S and R were calculated to be 29.2 kPa and 2.6. It was confirmed as prostate cancer on histopathology.
Reference
-
1. Jemal A, Siegel R, Ward E, Hao Y, Xu J, Thun MJ. Cancer statistics, 2009. CA Cancer J Clin. 2009; 59:225–249.2. Catalona WJ, Smith DS, Ornstein DK. Prostate cancer detection in men with serum PSA concentrations of 2.6 to 4.0 ng/mL and benign prostate examination. Enhancement of specificity with free PSA measurements. JAMA. 1997; 277:1452–1455.3. Cookson MM. Prostate cancer: screening and early detection. Cancer Control. 2001; 8:133–140.4. Frauscher F, Gradl J, Pallwein L. Prostate ultrasound--for urologists only? Cancer Imaging. 2005; 5:Spec No A. S76–S82.5. Stroumbakis N, Cookson MS, Reuter VE, Fair WR. Clinical significance of repeat sextant biopsies in prostate cancer patients. Urology. 1997; 49:3A Suppl. 113–118.6. Halpern EJ, Strup SE. Using gray-scale and color and power Doppler sonography to detect prostatic cancer. AJR Am J Roentgenol. 2000; 174:623–627.7. de la Taille A, Antiphon P, Salomon L, Cherfan M, Porcher R, Hoznek A, et al. Prospective evaluation of a 21-sample needle biopsy procedure designed to improve the prostate cancer detection rate. Urology. 2003; 61:1181–1186.8. Eskew LA, Bare RL, McCullough DL. Systematic 5 region prostate biopsy is superior to sextant method for diagnosing carcinoma of the prostate. J Urol. 1997; 157:199–202. discussion 202-203.9. Rodríguez LV, Terris MK. Risks and complications of transrectal ultrasound. Curr Opin Urol. 2000; 10:111–116.10. Tanter M, Bercoff J, Athanasiou A, Deffieux T, Gennisson JL, Montaldo G, et al. Quantitative assessment of breast lesion viscoelasticity: initial clinical results using supersonic shear imaging. Ultrasound Med Biol. 2008; 34:1373–1386.11. Barr RG, Memo R, Schaub CR. Shear wave ultrasound elastography of the prostate: initial results. Ultrasound Q. 2012; 28:13–20.12. Ahmad S, Cao R, Varghese T, Bidaut L, Nabi G. Transrectal quantitative shear wave elastography in the detection and characterisation of prostate cancer. Surg Endosc. 2013; 27:3280–3287.13. Heidenreich A, Bellmunt J, Bolla M, Joniau S, Mason M, Matveev V, et al. EAU guidelines on prostate cancer. Part 1: screening, diagnosis, and treatment of clinically localised disease. Eur Urol. 2011; 59:61–67.14. Ophir J, Garra B, Kallel F, Konofagou E, Krouskop T, Righetti R, et al. Elastographic imaging. Ultrasound Med Biol. 2000; 26:Suppl 1. S23–S29.15. Barr RG. Sonographic breast elastography: a primer. J Ultrasound Med. 2012; 31:773–783.16. Lee HY, Lee HJ, Byun SS, Lee SE, Hong SK, Kim SH. Classification of focal prostatic lesions on transrectal ultrasound (TRUS) and the accuracy of TRUS to diagnose prostate cancer. Korean J Radiol. 2009; 10:244–251.17. Park YJ, Kim JA, Son EJ, Youk JH, Park CS. Quantitative shear wave elastography as a prognostic implication of papillary thyroid carcinoma (PTC): elasticity index can predict extrathyroidal extension (ETE). Ann Surg Oncol. 2013; 20:2765–2771.18. Delahunt B, Miller RJ, Srigley JR, Evans AJ, Samaratunga H. Gleason grading: past, present and future. Histopathology. 2012; 60:75–86.19. Brock M, von Bodman C, Palisaar RJ, Löppenberg B, Sommerer F, Deix T, et al. The impact of real-time elastography guiding a systematic prostate biopsy to improve cancer detection rate: a prospective study of 353 patients. J Urol. 2012; 187:2039–2043.
- Full Text Links
-
- Actions
-
Cited
- CITED
-
- Close
- Share
-
- Similar articles
-
- Diagnostic Performance of Quantitative Shear Wave Ultrasound Elastography for Thyroid Cancer
- Future of breast elastography
- Erratum: Shear Wave Elastography for Detection of Prostate Cancer: A Preliminary Study
- Ultrasound Elastography for Liver Disease with Focus on Hepatic Fibrosis
- The utility of two-dimensional shear wave elastography for predicting prostate cancer: a preliminary study
