Measurements of T1- and T2-relaxation Time Changes According to the Morphological Characteristics of Gold Nanoparticles (GNPs)
- Affiliations
-
- 1Biomedical Engineering, Inje University, Korea. mcw@inje.ac.kr
- 2UHRC, Inje University, Korea.
- KMID: 2041227
- DOI: http://doi.org/10.13104/jksmrm.2011.15.1.48
Abstract
- PURPOSE
The aim of this study is to measure the typical MR variables such as T1- and T2-relaxation times according to morphological characteristics of gold nanoparticles as a preliminary study to perform theragnosis using local heating by gold nanoparticles.
MATERIALS AND METHODS
Two types of gold nanoparticles were used. Spheres were synthesized by various methods and stirring speed. Rods were synthesized by adding various concentrations of sphere nanoparticles. Gold nanoparticles were mixed with 2% agarose gel at 1:1 ratio and then signals were acquired using a 1.5T MRI. For the measurements of T1- and T2-relaxation times, TR and TE were varied, respectively. The results were acquired through T1 and T2 curves based on the intensities of MR image using self-developed software. And Statistical analysis was performed.
RESULTS
T1 times were measured 1.86 sec and 2.08 sec for sphere and rod, respectively. On the other hands, T2 times were measured 57 ms and 35.45 ms for sphere and rod.
CONCLUSION
The changes of the MR variables according to the morphological characteristics of the gold nanoparticles were confirmed. Optimal MR imaging conditions can be obtained by choosing proper TR and TE according to the type of nanoparticles.
Keyword
Figure
-
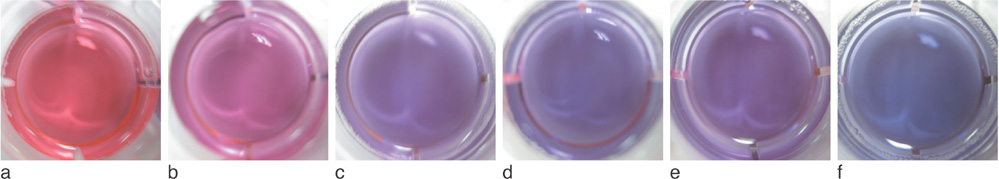
Fig. 1 Rod type GNPs produced by adding by different amout of sphere GNPs. (a) 1 ml, (b) 0.5 ml, (c) 0.25 ml, (d) 0.125 ml, (e) 0.08 ml, (f) 0.04 ml
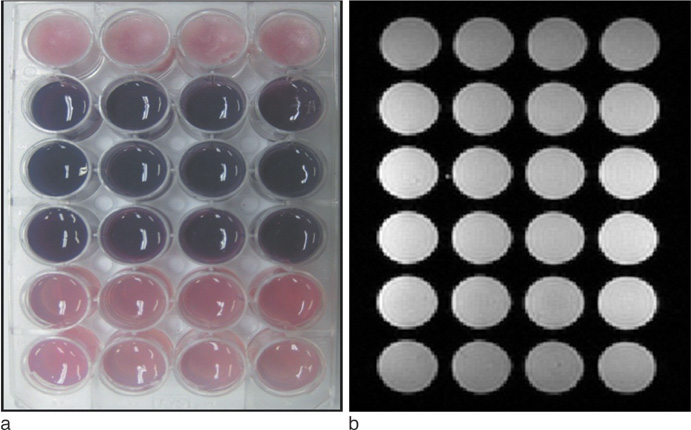
Fig. 2 Phantom and MR image of gold nanoparticles (a) 2% agarose gel phantom with GNPs (b) MR T2* image of GNPs
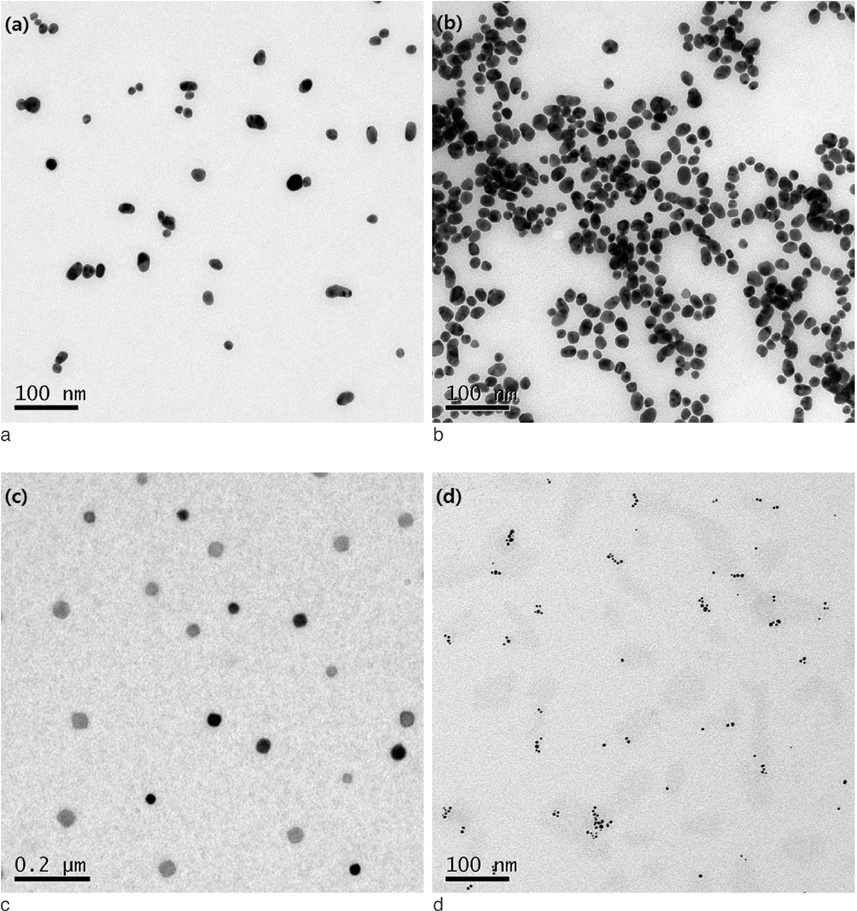
Fig. 3 TEM images of sphere type GNPs (a) Sphere 2 particles in the category of synthesis 2 at 150 rpm. (b) Sphere type 3 particles in synthesis 2 at 300 rpm. (c) Sphere type 5 particles in synthesis 3 at 150 rpm. scale bar = 200 nm. (d) Sphere type 6 particles in synthesis 3 at 450 rpm.

Fig. 4 TEM images of Rod type GNPs. The amounts of sphere type GNPs added are (a) 1 ml, (b) 0.25 ml, (C) 0.125 ml and (d) 0.08 ml, respectively. Scale bars are shown at the southwest corner on each images with 100 nm size.
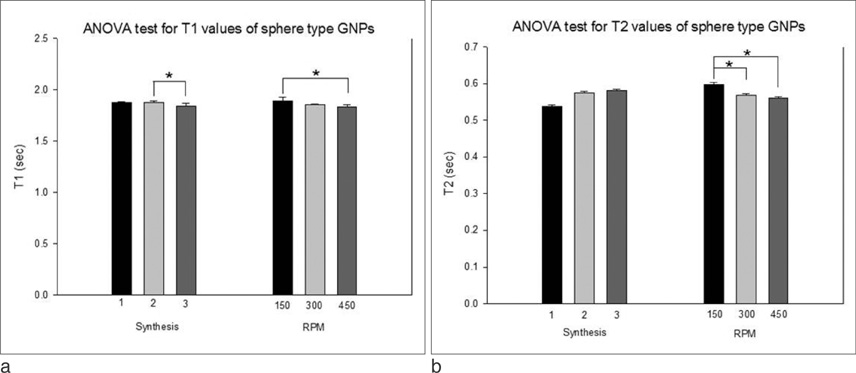
Fig. 5 Results of one-way ANOVA test for the variations of the T1- and T2-relaxation times according to the fabrication conditions of sphere GNPs (a) T1 values, *p<0.05 (b) T2 values, *p<0.05

Fig. 6 Results of one-way ANOVA test for the variations of the T1- and T2-relaxation times according to the fabrication conditions of rod GNPs. (a) T1 values, p<0.05 (b) T2 values, *p<0.05
Reference
-
1. Jun YW, Jang JT, Cheon JW. Nanocrystals and their biomedical applications. Bull Korean Chem Soc. 2006. 27(7):961–971.2. Lee JW, Lee IW, Lee JB. Medical Application of Nanomaterials and Prospect. J Clin Otolaryngol Head Neck Surg. 2009. 20:119–126.3. Jun YW, Choi JS, Cheon JW. Shape control of semiconductor and metal oxide nanocrystals through nonhydrolytic colloidal routes. Angewandte Chemie. 2006. 45(21):3414–3439.4. Jana NR, Gearheart L, Murphy CJ. Seeding growth for size control of 5-40 nm diameter gold nanoparticle. Langmuir. 2001. 17(22):6782–6786.5. Park J, Lee EW, Hwang NM, et al. Onenanometer-scale size-controlled synthesis of monodisperse magnetic iron oxide nanoparticles. Angew Chem Int Ed Engl. 2005. 44(19):2873–2877.6. Baughman RH, Zakhidov AA, de Heer WA. Carbon nanotubes the route toward applications. Science. 2002. 297(5582):787–792.7. Huang HC, Rege K, Heys JJ. Spatiotemporal temperature distribution and cancer cell death in response to extracellular hyperthermia induced by gold nanorods. ACS Nano. 2010. 4(5):2892–2900.8. Terry BH, Ling T, Yan Z, Matthew NH, Cheng JX, Alexander W. Hyperthermic effects of gold nanorods on tumor cells. Nanomedicine (Lond). 2007. 2(1):125–132.9. Yun HX, Jianmin B, Wang JP. High-magnetic-moment multifunctional nanoparticles for nanomedicine applications. J Magn Magn Mater. 2007. 311:131–134.10. Gole A, Murchy J. Seed-Mediated Synthesis of gold nanorods: role of the size and nature of the Seed. Chem Mater. 2004. 16:3633–3364.11. May RA, Stevenson KJ, Vanden Bout DA. Synthesis of gold and iron oxide nanoparticles and illustration of their optical and magnetic properties. 2007. IGERT Summer Teacher Academy.12. Jana NR, Geartheart L, Murphy J. Wet chemical synthesis of high aspect ratio cylindrical gold nanorods. J Phys Chem B. 2001. 105:4065–4067.13. M.I.A. Lourakis. A brief description of the Levenberg-Marquardt algorithm implem-entted by levmar, Technical Report. 2005. Hellas: Institute of Computer science, Foundation for Research and Technology.14. Ahearn TS, Staff RT, Redpath TW, Semple SI. The use of the Levenberg-Marquardt curve-fitting algorithm in pharmacokinetic modeling of DCE-MRI data. Phys Med Biol. 2005. 50:N85–N92.15. Schwarz AJ, Reese T, Gozzi A, Bifone A. Functional MRI using intravascular contrast agents: detrending of the relative cerebrovascular(rCBV) time course. Magn Reson Imaging. 2003. 21:1191–1200.16. Stroh A, Zimmer C, Gutzeit C, Jakstadt M, Marschinke F, Jung T, Pilgrimm H, Grune T. Iron oxide particles for molecular magnetic resonance imaging cause transient oxidative stress in rat macrophages. Free Radic Biol Med. 2004. 36(8):976–984.17. Van Beers BE, Gallez B, Pringot J. Contrast-enhanced MR imaging of the liver. Radiology. 1997. 203:297–306.
- Full Text Links
-
- Actions
-
Cited
- CITED
-
- Close
- Share
-
- Similar articles
-
- Monte Carlo Simulation for the Radiation Dose Enhancement Effect of Gold Nanoparticles in Brachytherapy
- Gold nanoparticles enhance anti-tumor effect of radiotherapy to hypoxic tumor
- Investigating the Sonodynamic-Radiosensitivity Effect of Gold Nanoparticles on HeLa Cervical Cancer Cells
- Feasibility of Novel Three-Dimensional Magnetic Resonance Fingerprinting of the Prostate Gland: Phantom and Clinical Studies
- The Production and Evaluation of the Tissue-equivalent Phantom for the Magnetic Resonance Imaging
