Differentiating Focal Eosinophilic Infiltration from Metastasis in the Liver with Gadoxetic Acid-Enhanced Magnetic Resonance Imaging
- Affiliations
-
- 1Department of Radiology and Center for Imaging Science, Samsung Medical Center, Sungkyunkwan University School of Medicine, Seoul 135-710, Korea. kshyun@skku.edu
- KMID: 1783210
- DOI: http://doi.org/10.3348/kjr.2011.12.4.439
Abstract
OBJECTIVE
To determine the most useful findings of gadoxetic acid-enhanced 3.0 Tesla (T) MRI for differentiating focal eosinophilic infiltration (FEI) from hepatic metastasis with verification of their usefulness.
MATERIALS AND METHODS
Pathologically or clinically proven 39 FEIs from 25 patients and 79 hepatic metastases from 51 patients were included in the study. Gadoxetic acid-enhanced 3.0T MRI was performed in all cancer patients. Size differences measured between T2-weighted and hepatobiliary-phase images for lesions > 1 cm and morphologic findings (margin, shape, signal intensity on T1- and T2-weighted images, enhancement pattern on dynamic images, and target appearance on hepatobiliary-phase images) were compared between two groups via Student's t test as well as univariate and multivariate analyses. Diagnostic predictive values of two observers for differentiating two groups were assessed before (session 1) and after (session 2) recognition of results.
RESULTS
Mean size difference (2.1 mm) in FEIs between the two images was significantly greater than for metastases (0.7 mm) (p < 0.05). An ill-defined margin and isointensity on T1-weighted images were independently significant morphologic findings (p < 0.05) for differentiating the two groups. All observers achieved a higher diagnostic accuracy in session 2 (97% and 98%) than session 1 (92% and 89%) with statistical significance in observer 2 (p < 0.05). All observers had significantly higher sensitivities (95%) and negative predictive values (NPVs) (98%) in session 2 than in session 1 (sensitivity, 74% in two observers; NPV, 89% and 88%) (p < 0.05).
CONCLUSION
With the size change, an ill-defined margin and isointensity on T1-weighted images are the most useful findings for differentiating FEI from hepatic metastasis on gadoxetic acid-enhanced 3.0T MRI.
MeSH Terms
Figure
-
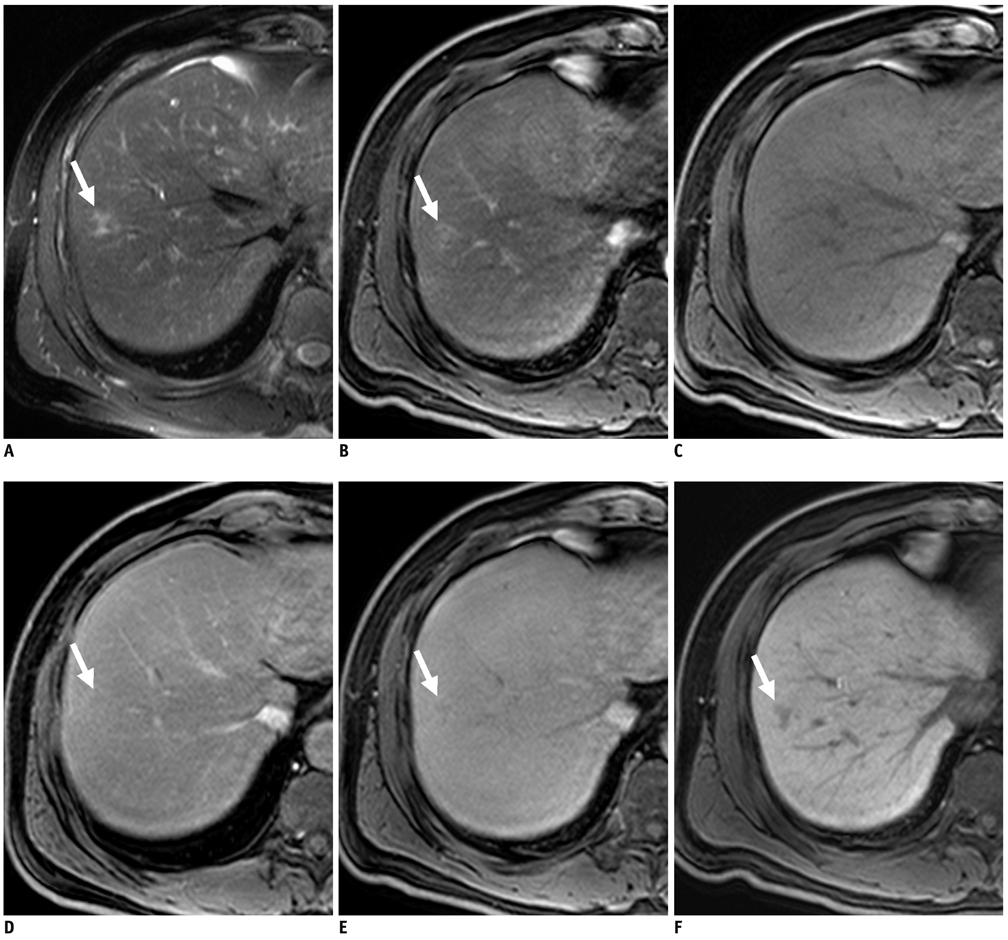
Fig. 1 60-year-old man with gastric adenocarcinoma and focal eosinophilic infiltration (differential count of eosinophils was 18%) in liver. A. T2-weighted image shows non-spherical hyperintense lesion (arrow) in segment VIII. B. Unenhanced T1-weighted image shows isointensity of lesion (arrow). C-E. Gadoxetic acid-enhanced dynamic images show heterogeneous enhancement with slight hyperintensity (arrow) during arterial phase (C) and faint hypointensity (arrow) during portal (D) and 3-minute late phases (E). F. Hepatobiliary phase image obtained 20 minutes after injection of contrast agent shows ill-defined hypointense lesion (arrow) with slight increase in size (13.6 mm on T2-weighted and 14.2 mm on hepatobiliary phase images) compared to A. Lesion spontaneously disappeared on follow-up CT (not shown) taken 6 months later. Lesion was correctly interpreted as focal eosinophilic infiltration on both sessions by all observers.
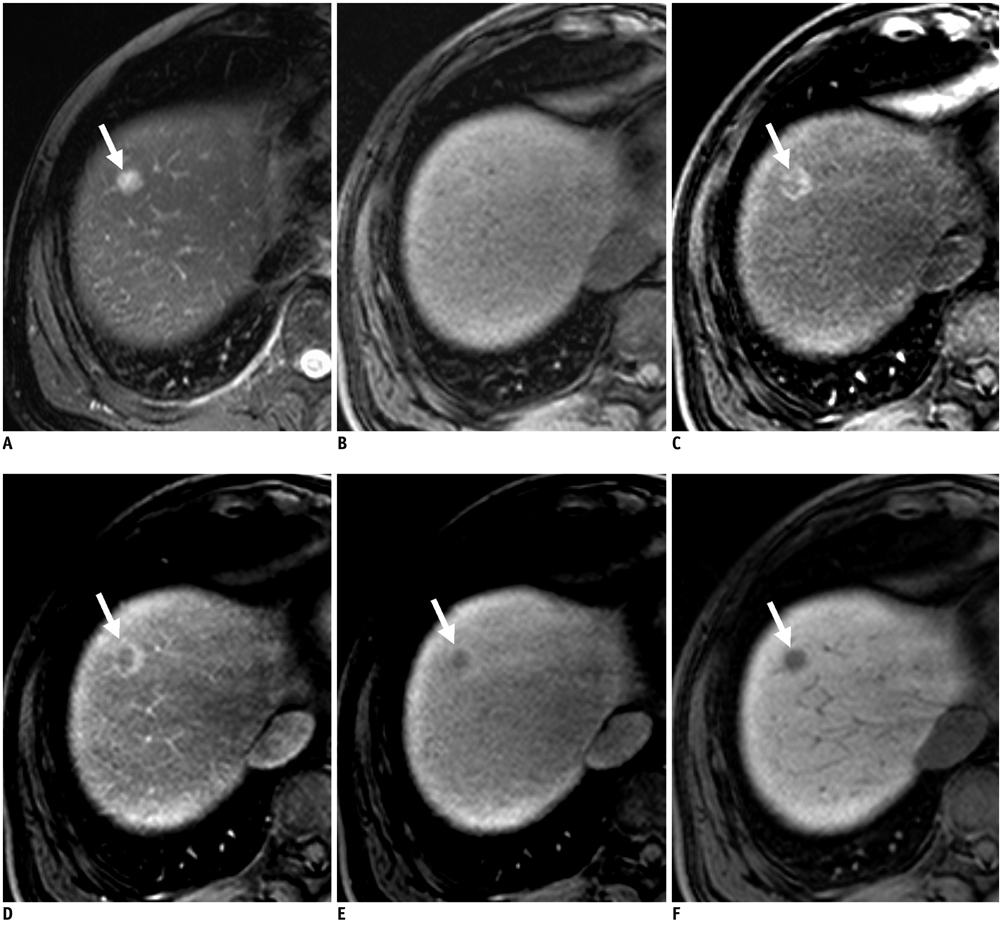
Fig. 2 63-year-old man with colon adenocarcinoma and focal eosinophilic abscess, confirmed by biopsy (differential count of eosinophils in peripheral blood, 18%) in liver. A. T2-weighted image shows spherical hyperintense lesion (arrow). B. Unenhanced T1-weighted image shows isointensity of lesion. C-E. Gadoxetic acid-enhanced dynamic images show rim enhancement (arrows) during arterial (C) portal phase (D) and 3-minute late phase (E). F. Hepatobiliary phase image obtained 20 minutes after injection of contrast agent shows well-defined hypointense lesion (arrow). Size difference between T2 (11.9 mm) and hepatobiliary phase (10.5 mm) was 1.4 mm. Slight decrease in size (11.9 mm on T2-weighted and 10.5 mm on hepatobiliary phase images) compared to A. Lesion was correctly interpreted as focal eosinophilic infiltration in session 2 after misinterpretation as metastasis in session 1 by all observers.
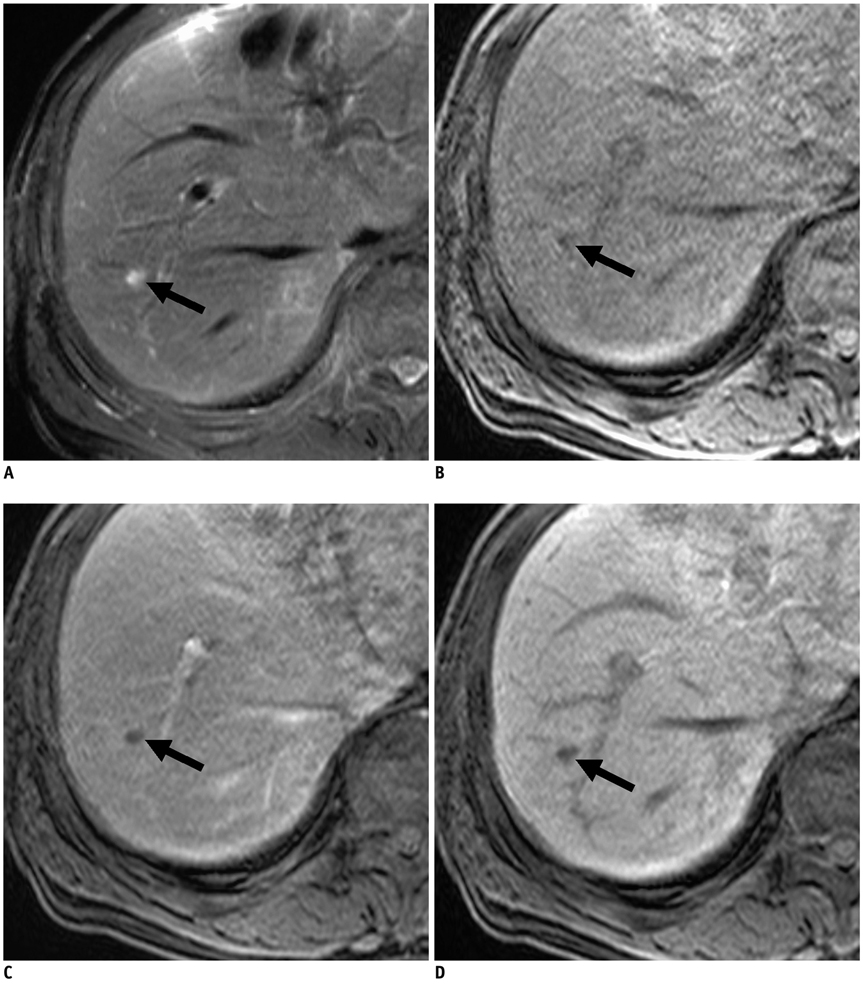
Fig. 3 70-year-old man with rectal cancer and metastatic adenocarcinoma confirmed by intra-operative sonography-guided biopsy in liver (false-positive lesion). A. T2-weighted MR image shows spherical hyperintense lesion (arrow). B. Unenhanced T1-weighted image shows hypointense lesion (arrow). C. Gadoxetic acid-enhanced dynamic image shows no enhancement with hypointensity (arrow) during portal phase or arterial and 3-minute late phases (not shown). D. Hepatobiliary phase image obtained 20 minutes after injection of contrast agent shows well-defined hypointense lesion (arrow) with no change in size compared to A. One of two observers misinterpreted it as focal eosinophilic infiltration in session 2, although it was correctly interpreted as metastasis in session 1.

Fig. 4 58-year-old man with colon cancer and focal eosinophilic abscess confirmed by percutaneous sonography-guided biopsy (differential count of eosinophils in peripheral blood, 2%) in liver (false-negative lesion). A. T2-weighted image shows non-spherical hypointense lesion (arrow). B. Unenhanced T1-weighted image shows hypointense lesion (arrow). C. Gadoxetic acid-enhanced dynamic images show rim enhancement (arrow) during arterial phase only (C) with hypointensity during portal and 3-minute late phases, without rim enhancement (not shown). D. Hepatobiliary phase image obtained 20 minutes after injection of contrast agent shows well-defined hypointense lesion (arrow). Size difference between T2 (21.5 mm) and hepatobiliary phase (21.3 mm) was 0.2 mm, which is minimal change in size (21.5 mm on T2-weighted and 21.3 mm on hepatobiliary phase images) compared to A. Lesion was misinterpreted as metastasis on both sessions by all observers.
Cited by 1 articles
-
Hepatic Lesions that Mimic Metastasis on Radiological Imaging during Chemotherapy for Gastrointestinal Malignancy: Recent Updates
Sung-Hye You, Beom Jin Park, Yeul Hong Kim
Korean J Radiol. 2017;18(3):413-426. doi: 10.3348/kjr.2017.18.3.413.
Reference
-
1. Iwasaki K, Torisu M, Fujimura T. Malignant tumor and eosinophils. I. Prognostic significance in gastric cancer. Cancer. 1986. 58:1321–1327.2. Kim GB, Kwon JH, Kang DS. Hypereosinophilic syndrome: imaging findings in patients with hepatic involvement. AJR Am J Roentgenol. 1993. 161:577–580.3. Yoon IL. The eosinophil and gastrointestinal carcinoma. Am J Surg. 1959. 97:195–200.4. Hong SW, Kim HG, Park CI, Lee SI. Eosinophilic liver abscess in patients with gastric carcinoma. Korean J Pathol. 1993. 27:27–33.5. Won JH, Kim MJ, Kim BM, Ji H, Chung JJ, Yoo HS, et al. Focal eosinophilic infiltration of the liver: a mimick of hepatic metastasis. Abdom Imaging. 1999. 24:369–372.6. Hur J, Park MS, Yu JS, Lim JS, Hong SW, Kim KW. Focal eosinophilic necrosis versus metastasis in the liver: the usefulness of two-phase dynamic CT. AJR Am J Roentgenol. 2005. 184:1085–1090.7. Jang HJ, Lee WJ, Lee SJ, Kim SH, Lim HK, Lim JH. Focal eosinophilic necrosis of the liver in patients with underlying gastric or colorectal cancer: CT differentiation from metastasis. Korean J Radiol. 2002. 3:240–244.8. Sun JS, Kim JK, Won JH, Lee KM, Cheong JY, Kim YB. MR findings in eosinophilic infiltration of the liver. J Comput Assist Tomogr. 2005. 29:191–194.9. Yoo SY, Han JK, Kim YH, Kim TK, Choi BI, Han MC. Focal eosinophilic infiltration in the liver: radiologic findings and clinical course. Abdom Imaging. 2003. 28:326–332.10. Yu JS, Yoon SW, Park MS, Lee JH, Kim KW. Eosinophilic hepatic necrosis: magnetic resonance imaging and computed tomography comparison. J Comput Assist Tomogr. 2005. 29:765–771.11. Park MS, Kim MJ, Lim JS, Kim SH, Kim HS, Chung YE, et al. Metastasis versus focal eosinophilic infiltration of the liver in patients with extrahepatic abdominal cancer: an evaluation with gadobenate dimeglumine-enhanced magnetic resonance imaging. J Comput Assist Tomogr. 2009. 33:119–124.12. Kim YK, Kim CS, Moon WS, Cho BH, Lee SY, Lee JM. MRI findings of focal eosinophilic liver diseases. AJR Am J Roentgenol. 2005. 184:1541–1548.13. Hamm B, Staks T, Muhler A, Bollow M, Taupitz M, Frenzel T, et al. Phase I clinical evaluation of Gd-EOB-DTPA as a hepatobiliary MR contrast agent: safety, pharmacokinetics, and MR imaging. Radiology. 1995. 195:785–792.14. Bartolozzi C, Crocetti L, Lencioni R, Cioni D, Della Pina C, Campani D. Biliary and reticuloendothelial impairment in hepatocarcinogenesis: the diagnostic role of tissue-specific MR contrast media. Eur Radiol. 2007. 17:2519–2530.15. Spinazzi A, Lorusso V, Pirovano G, Taroni P, Kirchin M, Davies A. Multihance clinical pharmacology: biodistribution and MR enhancement of the liver. Acad Radiol. 1998. 5:Suppl 1. S86–S89. discussion S93-84.16. Jung G, Breuer J, Poll LW, Koch JA, Balzer T, Chang S, et al. Imaging characteristics of hepatocellular carcinoma using the hepatobiliary contrast agent Gd-EOB-DTPA. Acta Radiol. 2006. 47:15–23.17. Halavaara J, Breuer J, Ayuso C, Balzer T, Bellin MF, Blomqvist L, et al. Liver tumor characterization: comparison between liver-specific gadoxetic acid disodium-enhanced MRI and biphasic CT--a multicenter trial. J Comput Assist Tomogr. 2006. 30:345–354.18. Bennett BM. On comparisons of sensitivity, specificity and predictive value of a number of diagnostic procedures. Biometrics. 1972. 28:793–800.19. Fleiss JL. The measurement of interrater agreement. Statistical methods for rates and proportions. 1981. New York: John Wiley and Sons;212–236.20. Kanematsu M, Kondo H, Goshima S, Kato H, Tsuge U, Hirose Y, et al. Imaging liver metastases: review and update. Eur J Radiol. 2006. 58:217–228.21. Mahfouz AE, Hamm B, Wolf KJ. Peripheral washout: a sign of malignancy on dynamic gadolinium-enhanced MR images of focal liver lesions. Radiology. 1994. 190:49–52.22. Muramatsu Y, Takayasu K, Moriyama N, Shima Y, Goto H, Ushio K, et al. Peripheral low-density area of hepatic tumors: CT-pathologic correlation. Radiology. 1986. 160:49–52.23. Semelka RC, Hussain SM, Marcos HB, Woosley JT. Perilesional enhancement of hepatic metastases: correlation between MR imaging and histopathologic findings-initial observations. Radiology. 2000. 215:89–94.24. Kim YK, Lee JM, Kim CS. Gadobenate dimeglumine-enhanced liver MR imaging: value of dynamic and delayed imaging for the characterization and detection of focal liver lesions. Eur Radiol. 2004. 14:5–13.25. Gabata T, Matsui O, Kadoya M, Yoshikawa J, Ueda K, Kawamori Y, et al. Delayed MR imaging of the liver: correlation of delayed enhancement of hepatic tumors and pathologic appearance. Abdom Imaging. 1998. 23:309–313.26. Zech CJ, Herrmann KA, Reiser MF, Schoenberg SO. MR imaging in patients with suspected liver metastases: value of liver-specific contrast agent Gd-EOB-DTPA. Magn Reson Med Sci. 2007. 6:43–52.27. Danet IM, Semelka RC, Leonardou P, Braga L, Vaidean G, Woosley JT, et al. Spectrum of MRI appearances of untreated metastases of the liver. AJR Am J Roentgenol. 2003. 181:809–817.28. Hwang HS, Kim SH, Jeon TY, Choi D, Lee WJ, Lim HK. Hypointense hepatic lesions depicted on gadobenate dimeglumine-enhanced three-hour delayed hepatobiliary-phase MR imaging: differentiation between benignancy and malignancy. Korean J Radiol. 2009. 10:294–302.29. Terayama N, Matsui O, Ueda K, Kobayashi S, Sanada J, Gabata T, et al. Peritumoral rim enhancement of liver metastasis: hemodynamics observed on single-level dynamic CT during hepatic arteriography and histopathologic correlation. J Comput Assist Tomogr. 2002. 26:975–980.
- Full Text Links
-
- Actions
-
Cited
- CITED
-
- Close
- Share
-
- Similar articles
-
- Gadoxetic acid-enhanced magnetic resonance imaging: Hepatocellular carcinoma and mimickers
- Diagnosis of Hepatocellular Carcinoma with Gadoxetic Acid-Enhanced MRI: 2016 Consensus Recommendations of the Korean Society of Abdominal Radiology
- Hepatic Angiomyolipoma Presenting as a Hyperintense Lesion During the Hepatobiliary Phase of Gadoxetic Acid Enhanced-MRI: a Case Report
- The MR imaging diagnosis of liver diseases using gadoxetic acid: Emphasis on hepatobiliary phase
- Focal Hepatic Eosinophilic Infiltration in Contrast-Enhanced Ultrasonography with Sonazoid: A Case Report
