Effect of Harderian adenectomy on the statistical analyses of mouse brain imaging using positron emission tomography
- Affiliations
-
- 1Department of Veterinary Medicine, College of Veterinary Medicine, Konkuk University, Seoul 143-701, Korea. ssnahm@konkuk.ac.kr
- 2Molecular Imaging Research Center, Korea Institute of Radiological and Medical Sciences, Seoul 139-706, Korea.
- KMID: 1737622
- DOI: http://doi.org/10.4142/jvs.2014.15.1.157
Abstract
- Positron emission tomography (PET) using 2-deoxy-2-[18F] fluoro-D-glucose (FDG) as a radioactive tracer is a useful technique for in vivo brain imaging. However, the anatomical and physiological features of the Harderian gland limit the use of FDG-PET imaging in the mouse brain. The gland shows strong FDG uptake, which in turn results in distorted PET images of the frontal brain region. The purpose of this study was to determine if a simple surgical procedure to remove the Harderian gland prior to PET imaging of mouse brains could reduce or eliminate FDG uptake. Measurement of FDG uptake in unilaterally adenectomized mice showed that the radioactive signal emitted from the intact Harderian gland distorts frontal brain region images. Spatial parametric measurement analysis demonstrated that the presence of the Harderian gland could prevent accurate assessment of brain PET imaging. Bilateral Harderian adenectomy efficiently eliminated unwanted radioactive signal spillover into the frontal brain region beginning on postoperative Day 10. Harderian adenectomy did not cause any post-operative complications during the experimental period. These findings demonstrate the benefits of performing a Harderian adenectomy prior to PET imaging of mouse brains.
Keyword
MeSH Terms
-
Animals
Brain/*metabolism/radionuclide imaging
Fluorodeoxyglucose F18/*diagnostic use
Frontal Lobe/metabolism/radionuclide imaging
Harderian Gland/metabolism/radionuclide imaging/*surgery
Mice
Mice, Inbred BALB C
Neuroimaging/standards/*veterinary
Positron-Emission Tomography/*veterinary
Radiopharmaceuticals/*diagnostic use
Fluorodeoxyglucose F18
Radiopharmaceuticals
Figure
-
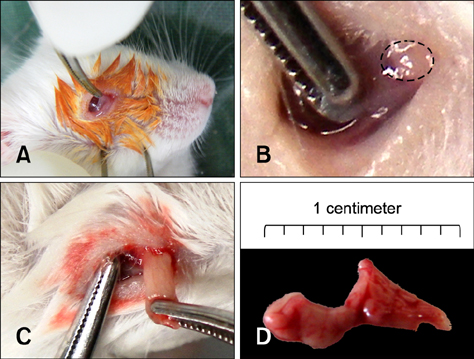
Fig. 1 Harderian adenectomy (HA) in mice. (A) The nictitating membrane was pulled from the medial canthus while the animal was in a lateral recumbent position. (B) The Harderian gland was located at the base of the nictitating membrane (black circle). (C) The Harderian gland was drawn out using forceps. (D) The resected Harderian gland.
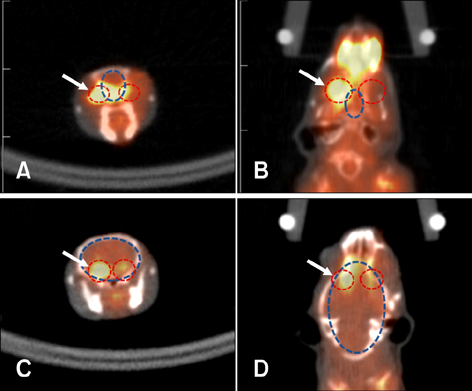
Fig. 2 FDG-PET/CT imaging after unilateral HA. Note the strong FDG uptake signal from the Harderian gland and the radioactive spillover into the brain compared to the intact side (arrow). The Harderian glands occupied a large part of the retro-orbital space located at the front of the brain. (A and C) Coronal plane. (B and D) Axial plane. Blue circles, brain; Red circles, Harderian glands.
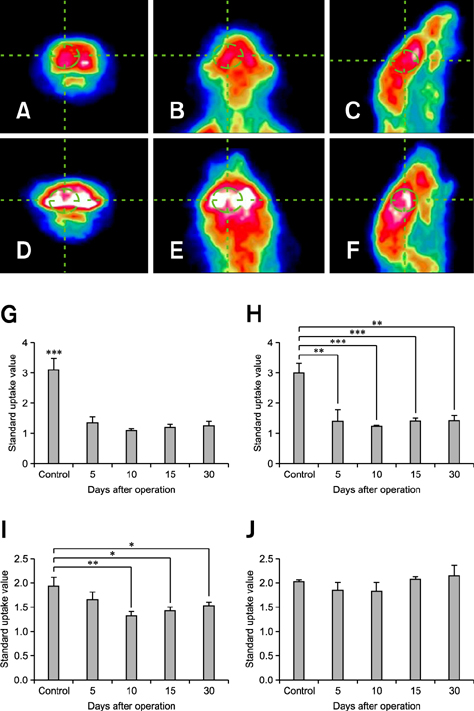
Fig. 3 FDG accumulation in the Harderian gland and subsequent radioactive spillover into the brain was eliminated by simple surgical resection of the gland. The margin at the frontal brain region was clearly defined compared to mice that did not undergo surgery. (A, B, and C) Harderian gland adenectomized mouse. (D, E, and F) An intact mouse. (A and D) Coronal view. (B and E) Dorsal view. (C and F) Sagittal view. Standard uptake values (SUVs) were significantly decreased in the regions of the Harderian glands after HA (G, left Harderian gland; H, right Harderian gland). SUVs for the frontal brain region decreased significantly starting on Day 10 as extracranial FDG accumulation disappeared (I). SUVs for the cerebellum were not affected by HA (J). Results are expressed as the mean ± standard error of the mean (SEM); *p < 0.05, **p < 0.01, and ***p < 0.001 according to a one-way ANOVA and Dunnett's multiple comparison test.
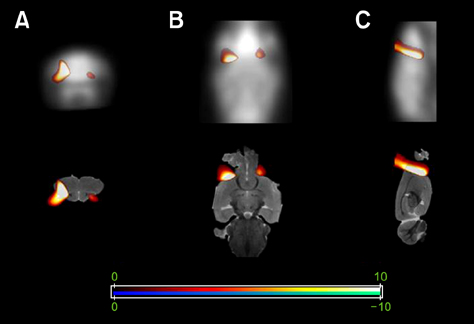
Fig. 4 Spatial parametric mapping (SPM) analysis was performed in order to localize regions that showed a significant difference in FDG uptake before and after HA. Regions with higher FDG uptake appear red-to-yellow in color. Images in the upper row represent areas in which significant differences in FDG uptake were observed using a PET scan template analysis. Images in the lower row are PET/CT images merged with brain MRI images to show the location of the affected regions relative to the brain. (A) Coronal view. (B) Dosal view. (C) Sagittal view. p < 0.005.
Reference
-
1. Brammer DW, Riley JM, Kreuser SC, Zasadny KR, Callahan MJ, Davis MD. Harderian gland adenectomy: a method to eliminate confounding radio-opacity in the assessment of rat brain metabolism by 18F-fluoro-2-deoxy-Dglucose positron emission tomography. J Am Assoc Lab Anim Sci. 2007; 46:42–45.2. Deroose CM, De A, Loening AM, Chow PL, Ray P, Chatziioannou AF, Gambhir SS. Multimodality imaging of tumor xenografts and metastases in mice with combined small-animal PET, small-animal CT, and bioluminescence imaging. J Nucl Med. 2007; 48:295–303.3. Fueger BJ, Czernin J, Hildebrandt I, Tran C, Halpern BS, Stout D, Phelps ME, Weber WA. Impact of animal handling on the results of 18F-FDG PET studies in mice. J Nucl Med. 2006; 47:999–1006.4. Fukuyama H, Hayashi T, Katsumi Y, Tsukada H, Shibasaki H. Issues in measuring glucose metabolism of rat brain using PET: the effect of Harderian glands on the frontal lobe. Neurosci Lett. 1998; 255:99–102.
Article5. Kuge Y, Minematsu K, Hasegawa Y, Yamaguchi T, Mori H, Matsuura H, Hashimoto N, Miyake Y. Positron emission tomography for quantitative determination of glucose metabolism in normal and ischemic brains in rats: an insoluble problem by the Harderian glands. J Cereb Blood Flow Metab. 1997; 17:116–120.
Article6. Lancelot S, Zimmer L. Small-animal positron emission tomography as a tool for neuropharmacology. Trends Pharmacol Sci. 2010; 31:411–417.
Article7. Manook A, Yousefi BH, Willuweit A, Platzer S, Reder S, Voss A, Huisman M, Settles M, Neff F, Velden J, Schoor M, von der Kammer H, Wester HJ, Schwaiger M, Henriksen G, Drzezga A. Small-animal PET imaging of amyloid-beta plaques with [11C]PiB and its multi-modal validation in an APP/PS1 mouse model of Alzheimer's disease. PLoS One. 2012; 7:e31310.8. Martic-Kehl MI, Ametamey SM, Alf MF, Schubiger PA, Honer M. Impact of inherent variability and experimental parameters on the reliability of small animal PET data. EJNMMI Res. 2012; 2:26.
Article9. Nikolaus S, Larisch R, Beu M, Hamacher K, Forutan F, Vosberg H, Müller HW. In vivo measurement of D2 receptor density and affinity for 18F-(3-N-methyl)benperidol in the rat striatum with a PET system for small laboratory animals. J Nucl Med. 2003; 44:618–624.10. Payne AP. The harderian gland: a tercentennial review. J Anat. 1994; 185(Pt 1):1–49.11. Pinto LH, Enroth-Cugell C. Tests of the mouse visual system. Mamm Genome. 2000; 11:531–536.
Article12. Soret M, Bacharach SL, Buvat I. Partial-volume effect in PET tumor imaging. J Nucl Med. 2007; 48:932–945.
Article13. Virdee K, Cumming P, Caprioli D, Jupp B, Rominger A, Aigbirhio FI, Fryer TD, Riss PJ, Dalley JW. Applications of positron emission tomography in animal models of neurological and neuropsychiatric disorders. Neurosci Biobehav Rev. 2012; 36:1188–1216.
Article14. Zovein A, Flowers-Ziegler J, Thamotharan S, Shin D, Sankar R, Nguyen K, Gambhir S, Devaskar SU. Postnatal hypoxic-ischemic brain injury alters mechanisms mediating neuronal glucose transport. Am J Physiol Regul Integr Comp Physiol. 2004; 286:R273–R282.
Article
- Full Text Links
-
- Actions
-
Cited
- CITED
-
- Close
- Share
-
- Similar articles
-
- Methodological Review on Functional Neuroimaging Using Positron Emission Tomography
- A Case of Neuro-Behcet's Disease: Comparison of Neurological Symptoms with PET, SPECT, and MRI Findings
- A Review of Machine Learning Approaches for Brain Positron Emission Tomography Data Analysis
- Nuclear Neurology
- Perspectives in TSPO PET Imaging for Neurologic Diseases
