Korean J Lab Med.
2011 Jul;31(3):148-153. 10.3343/kjlm.2011.31.3.148.
Comparative Quantitative Analysis of Cluster of Differentiation 45 Antigen Expression on Lymphocyte Subsets
- Affiliations
-
- 1Department of Laboratory Medicine, Graduate School, The Catholic University of Korea, College of Medicine, Seoul, Korea.
- 2Department of Laboratory Medicine, The Catholic University of Korea, College of Medicine, Seoul, Korea. hankja@catholic.ac.kr
- 3Department of Internal Medicine, The Catholic University of Korea, College of Medicine, Seoul, Korea.
- 4Department of Clinical Laboratory, Ansan College, Ansan, Korea.
- KMID: 1735845
- DOI: http://doi.org/10.3343/kjlm.2011.31.3.148
Abstract
- BACKGROUND
Since the recent introduction of radioimmunotherapy (RIT) using antibodies against cluster of differentiation (CD) 45 for the treatment of lymphoma, the clinical significance of the CD45 antigen has been increasing steadily. Here, we analyzed CD45 expression on lymphocyte subsets using flow cytometry in order to predict the susceptibility of normal lymphocytes to RIT.
METHODS
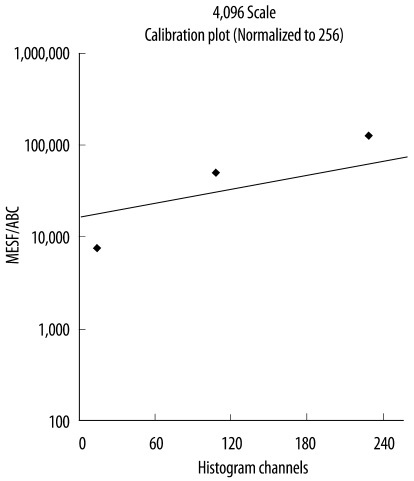
Peripheral blood specimens were collected from 14 healthy individuals aged 25-54 yr. The mean fluorescence intensity (MFI) of the cell surface antigens was measured using a FACSCanto II system (Becton Dickinson Bioscience, USA). MFI values were converted into antibody binding capacity values using a Quantum Simply Cellular microbead kit (Bangs Laboratories, Inc., USA).
RESULTS
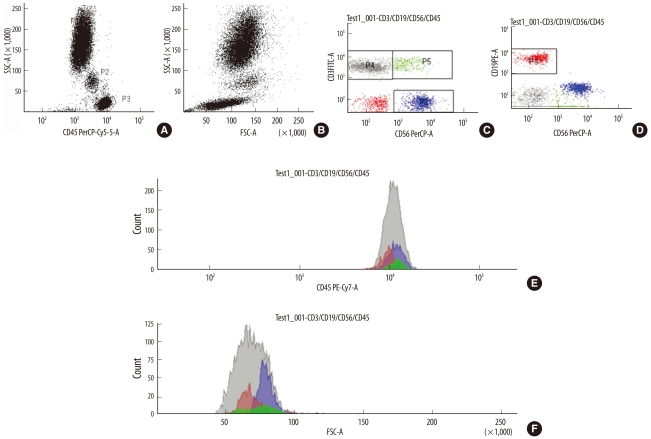
Among the lymphocyte subsets, the expression of CD45 was the highest (725,368+/-42,763) on natural killer T (NKT) cells, 674,030+/-48,187 on cytotoxic/suppressor T cells, 588,750+/-48,090 on natural killer (NK) cells, 580,211+/-29,168 on helper T (Th) cells, and 499,436+/-21,737 on B cells. The Th cells and NK cells expressed a similar level of CD45 (P=0.502). Forward scatter was the highest in NKT cells (P<0.05), whereas side scatter differed significantly between each of the lymphocyte subsets (P<0.05). CD3 expression was highest in the Th and NKT cells.
CONCLUSIONS
NKT cells express the highest levels of CD45 antigen. Therefore, this lymphocyte subset would be most profoundly affected by RIT or pretargeted RIT. The monitoring of this lymphocyte subset during and after RIT should prove helpful.
Keyword
MeSH Terms
-
Adult
Antibodies/immunology
Antigens, CD45/*analysis/immunology
B-Lymphocytes/immunology/metabolism
CD8-Positive T-Lymphocytes/immunology/metabolism
Female
Flow Cytometry/*methods
Fluorescein-5-isothiocyanate/chemistry
Fluorescent Dyes/chemistry
Humans
Killer Cells, Natural/immunology/metabolism
Lymphocytes/immunology/*metabolism
Lymphoma/radiotherapy
Male
Middle Aged
Natural Killer T-Cells/immunology/metabolism
Protein Binding
Radioimmunotherapy
Reagent Kits, Diagnostic
T-Lymphocytes, Helper-Inducer/immunology/metabolism
Figure
Reference
-
1. Kee SJ. The Korean society for laboratory medicine. Laboratory evaluation of the cellular immune system. Laboratory medicine. 2009. 4th ed. Seoul: E public;p. 601–610.2. Abbas AK, Lichtman AH, editors. Cellular and molecular immunology. 2010. 6th updated ed. Philadelphia: Saunders;p. 137–152.3. Falahati R, Leitenberg D. Selective regulation of TCR signaling pathways by the CD45 protein tyrosine phosphatase during thymocyte development. J Immunol. 2008; 181:6082–6091. PMID: 18941197.
Article4. Elder ME. Detrick B, Hamilton RG, editors. Investigation of signal transduction defects. Manual of molecular and clinical laboratory immunology. 2006. 7th ed. Washington, D.C: ASM Press;p. 901–905.5. Panchal RG, Ulrich RL, Bradfute SB, Lane D, Ruthel G, Kenny TA, et al. Reduced expression of CD45 protein-tyrosine phosphatase provides protection against anthrax pathogenesis. J Biol Chem. 2009; 284:12874–12885. PMID: 19269962.
Article6. Green DJ, Pagel JM, Pantelias A, Hedin N, Lin Y, Wilbur DS, et al. Pretargeted radioimmunotherapy for B-cell lymphomas. Clin Cancer Res. 2007; 13:5598s–5603s. PMID: 17875795.
Article7. Lin Y, Pagel JM, Axworthy D, Pantelias A, Hedin N, Press OW. A genetically engineered anti-CD45 single-chain antibody-streptavidin fusion protein for pretargeted radioimmunotherapy of hematologic malignancies. Cancer Res. 2006; 66:3884–3892. PMID: 16585217.
Article8. Pagel JM, Hedin N, Subbiah K, Meyer D, Mallet R, Axworthy D, et al. Comparison of anti-CD20 and anti-CD45 antibodies for conventional and pretargeted radioimmunotherapy of B-cell lymphomas. Blood. 2003; 101:2340–2348. PMID: 12446461.
Article9. Green DJ, Pagel JM, Nemecek ER, Lin Y, Kenoyer A, Pantelias A, et al. Pretargeting CD45 enhances the selective delivery of radiation to hematolymphoid tissues in nonhuman primates. Blood. 2009; 114:1226–1235. PMID: 19515724.
Article10. Broome HE. Lichtman M, editor. Morphology of lymphocytes and plasma cells. Williams hematology. 2006. 7th ed. New York: McGraw-Hill;p. 1023–1030.11. Trinchieri G, Lanier LL. Lichtman M, editor. Functions of natural killer cells. Williams hematology. 2006. 7th ed. New York: McGraw-Hill;p. 1077–1082.12. Thompson CB, Scher I, Schaefer ME, Lindsten T, Finkelman FD, Mond JJ. Size-dependent B lymphocyte subpopulations: relationship of cell volume to surface phenotype, cell cycle, proliferative response, and requirements for antibody production to TNP-Ficoll and TNP-BA. J Immunol. 1984; 133:2333–2342. PMID: 6207226.13. Iritani BM, Eisenman RN. c-Myc enhances protein synthesis and cell size during B lymphocyte development. Proc Natl Acad Sci USA. 1999; 96:13180–13185. PMID: 10557294.
Article14. Perillo NL, Naeim F, Walford RL, Effros RB. In vitro cellular aging in T-lymphocyte cultures: analysis of DNA content and cell size. Exp Cell Res. 1993; 207:131–135. PMID: 8319764.
Article15. Press OW, Farr AG, Borroz KI, Anderson SK, Martin PJ. Endocytosis and degradation of monoclonal antibodies targeting human B-cell malignancies. Cancer Res. 1989; 49:4906–4912. PMID: 2667754.16. Carulli G, Cannizzo E, Zucca A, Buda G, Orciuolo E, Marini A, et al. CD45 expression in low-grade B-cell non-Hodgkin's lymphomas. Leuk Res. 2008; 32:263–267. PMID: 17692374.
Article17. Ratei R, Karawajew L, Lacombe F, Jagoda K, Del Poeta G, Kraan J, et al. Normal lymphocytes from leukemic samples as an internal quality control for fluorescence intensity in immunophenotyping of acute leukemias. Cytometry B Clin Cytom. 2006; 70:1–9. PMID: 16278833.
Article18. Bikoue A, George F, Poncelet P, Mutin M, Janossy G, Sampol J. Quantitative analysis of leukocyte membrane antigen expression: normal adult values. Cytometry. 1996; 26:137–147. PMID: 8817090.
Article19. Beverley P. The importance of T3 in the activation of T lymphocytes. Nature. 1983; 304:398–399. PMID: 6603576.20. Lenkei R, Andersson B. Determination of the antibody binding capacity of lymphocyte membrane antigens by flow cytometry in 58 blood donors. J Immunol Methods. 1995; 183:267–277. PMID: 7602149.
Article
- Full Text Links
- Actions
-
Cited
- CITED
-
- Close
- Share
- Similar articles
-
- Changes in lymphocyte subsets following open-heart surgery; a study for changes in lymphocyte subsets
- Lymphocyte subsets in schizophrenic patients
- A study on the change of the lymphocyte subsets after splenectomy by flow cytometer
- T-lymphocyte subsets in nephrotic syndrome
- T lymphocyte subsets, B lymphocyte and NK cell activity in cervical intraspithelial neoplasia and cervical cancer patients


