Influence of Signal Intensity Non-Uniformity on Brain Volumetry Using an Atlas-Based Method
- Affiliations
-
- 1Department of Radiological Technology, University of Tokyo Hospital, Tokyo 113-8655, Japan. car6_pa2_rw@yahoo.co.jp
- 2Graduate School of Medical Science, Kanazawa University, Ishikawa 920-0293, Japan.
- 3Department of Radiology, Nihon University School of Medicine, Tokyo 113-8602, Japan.
- 4Japan Applied Science Laboratory, GE Healthcare, Tokyo 191-8503, Japan.
- 5Department of Radiology, University of Tokyo Hospital, Tokyo 113-8655, Japan.
- 6Department of Computational Diagnostic Radiology and Preventive Medicine, University of Tokyo Hospital, Tokyo 113-8655, Japan.
- 7Department of Neuropathology, University of Tokyo 113-8655, Japan.
- 8Department of Radiology, National Center Hospital of Neurology and Psychiatry, Tokyo 187-8551, Japan.
- 9Department of Nuclear Medicine, Saitama Medical University International Medical Center, Saitama 350-1298, Japan.
- 10Department of Radiology, Juntendo University, Tokyo 113-8421, Japan.
- KMID: 1383850
- DOI: http://doi.org/10.3348/kjr.2012.13.4.391
Abstract
OBJECTIVE
Many studies have reported pre-processing effects for brain volumetry; however, no study has investigated whether non-parametric non-uniform intensity normalization (N3) correction processing results in reduced system dependency when using an atlas-based method. To address this shortcoming, the present study assessed whether N3 correction processing provides reduced system dependency in atlas-based volumetry.
MATERIALS AND METHODS
Contiguous sagittal T1-weighted images of the brain were obtained from 21 healthy participants, by using five magnetic resonance protocols. After image preprocessing using the Statistical Parametric Mapping 5 software, we measured the structural volume of the segmented images with the WFU-PickAtlas software. We applied six different bias-correction levels (Regularization 10, Regularization 0.0001, Regularization 0, Regularization 10 with N3, Regularization 0.0001 with N3, and Regularization 0 with N3) to each set of images. The structural volume change ratio (%) was defined as the change ratio (%) = (100 x [measured volume - mean volume of five magnetic resonance protocols] / mean volume of five magnetic resonance protocols) for each bias-correction level.
RESULTS
A low change ratio was synonymous with lower system dependency. The results showed that the images with the N3 correction had a lower change ratio compared with those without the N3 correction.
CONCLUSION
The present study is the first atlas-based volumetry study to show that the precision of atlas-based volumetry improves when using N3-corrected images. Therefore, correction for signal intensity non-uniformity is strongly advised for multi-scanner or multi-site imaging trials.
Keyword
MeSH Terms
Figure
-
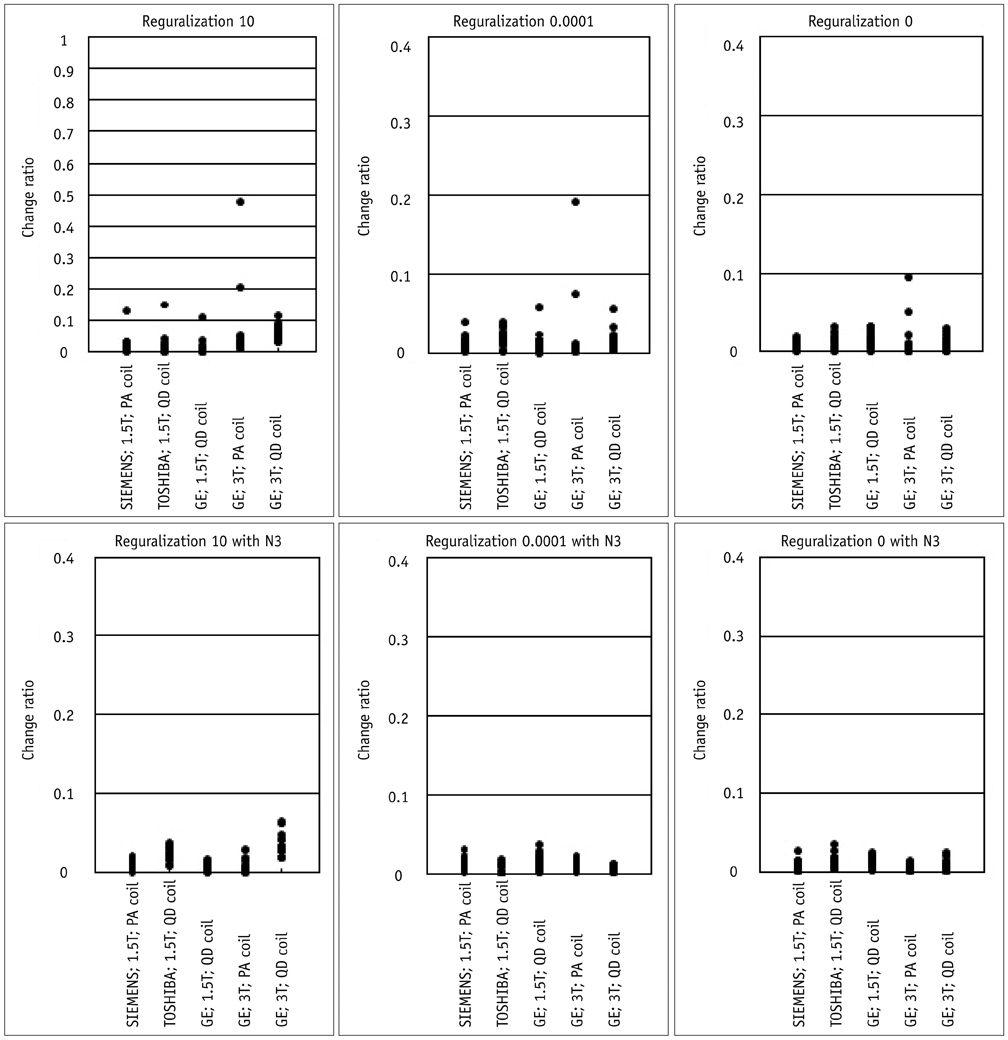
Fig. 1 Change ratio of structural volume of white matter, for each system. Bias-correction levels are shown at top of figure. Change ratios showed decrease in increasing bias-correction power (i.e., Regularization 10 < 0.0001 < 0 < 0 with N3); this trend was strongest for GE 3T PA coil protocol. 3T = 3 tesla, PA = phased-array, QD = quadrature
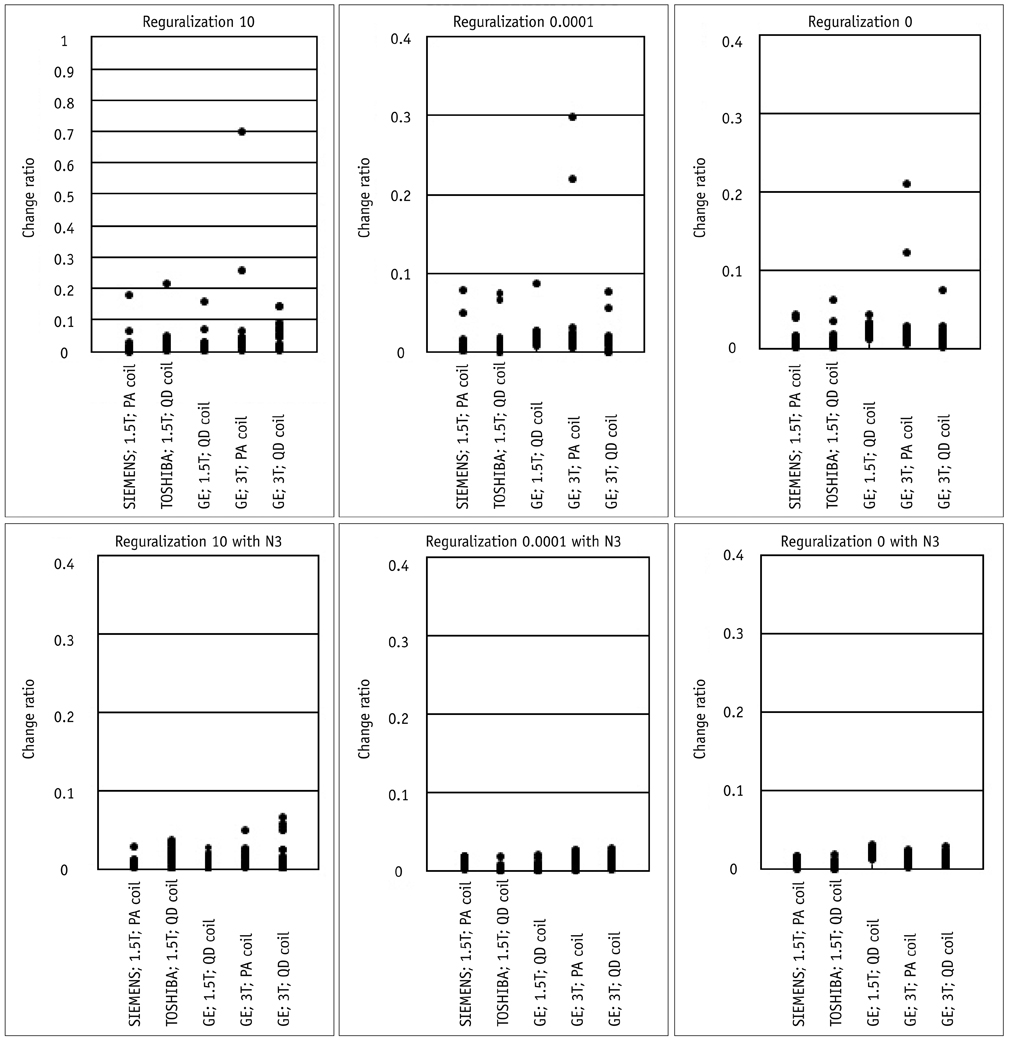
Fig. 2 Change ratio of structural volume of temporal lobe for each system. Bias-correction levels are shown at top of figure. Change ratios showed decrease with increasing bias-correction power (i.e., Regularization 10 < 0.0001 < 0 < 0 with N3); this trend was strongest for GE 3T PA coil protocol. 3T = 3 tesla, PA = phased-array, QD = quadrature
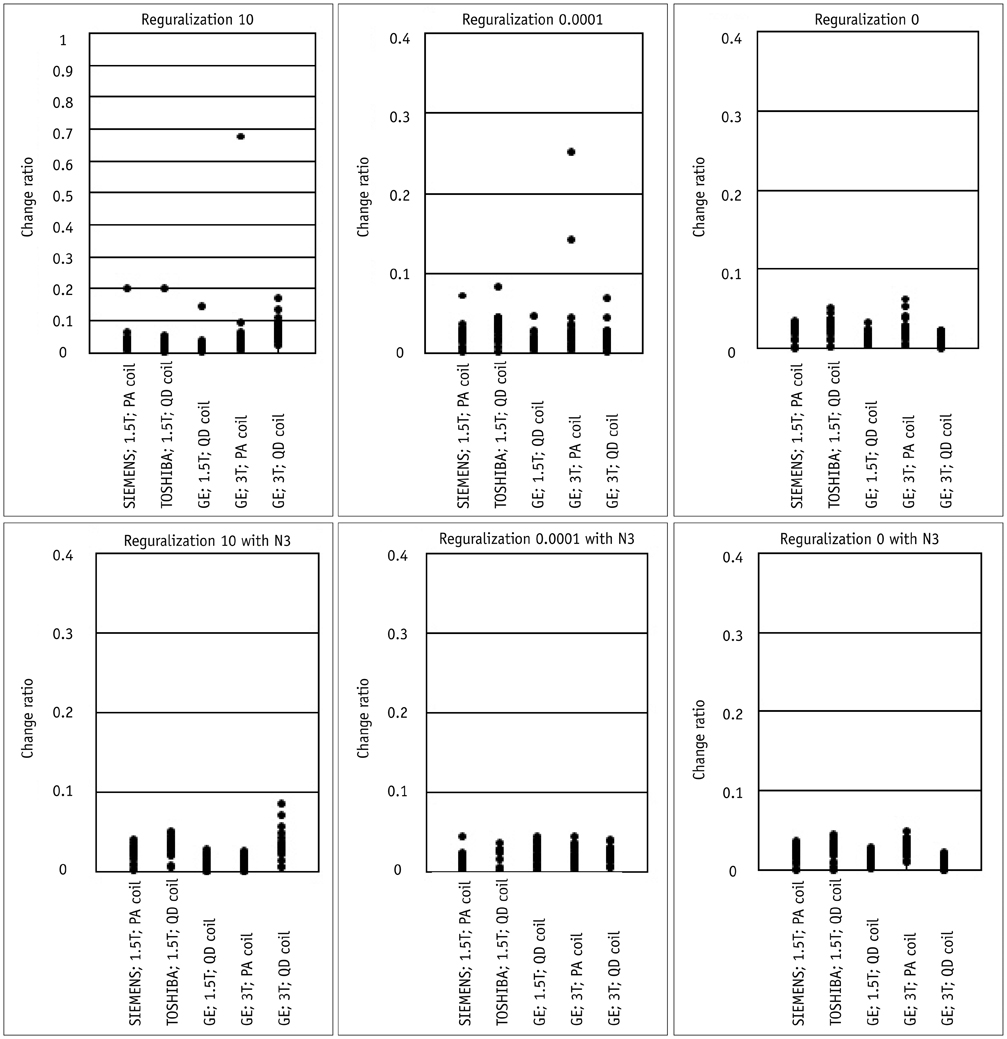
Fig. 3 Change ratio of structural volume of parietal lobe for each system. Bias-correction levels are shown at top of figure. Change ratios showed decrease with increasing bias-correction power (i.e., Regularization 10 < 0.0001 < 0 < 0 with N3); this trend was strongest for GE 3T PA coil protocol. 3T = 3 tesla, PA = phased-array, QD = quadrature
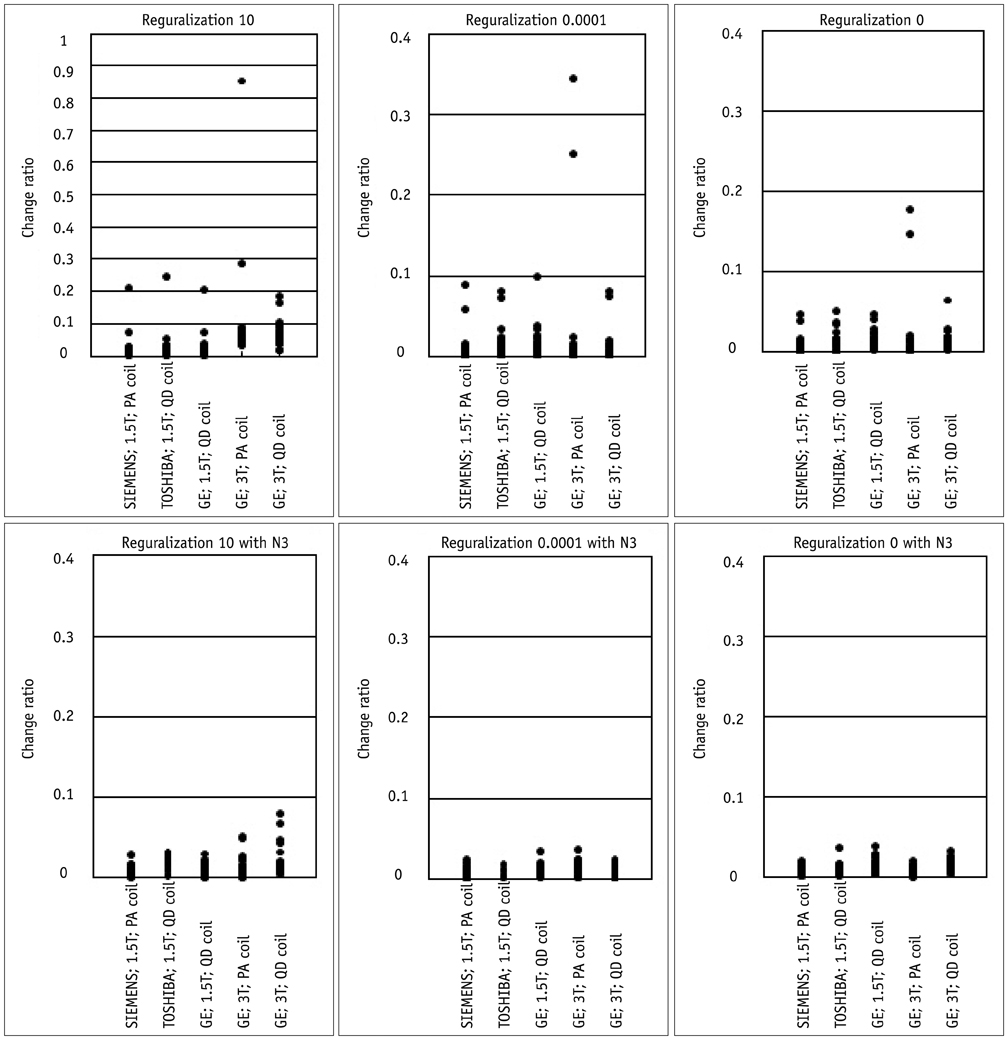
Fig. 4 Change ratio of structural volume of occipital lobe, for each system. Bias-correction levels are shown at top of figure. Change ratios showed decrease with increasing bias-correction power (i.e., Regularization 10 < 0.0001 < 0 < 0 with N3); this trend was strongest for GE 3T PA coil protocol. 3T = 3 tesla, PA = phased-array, QD = quadrature
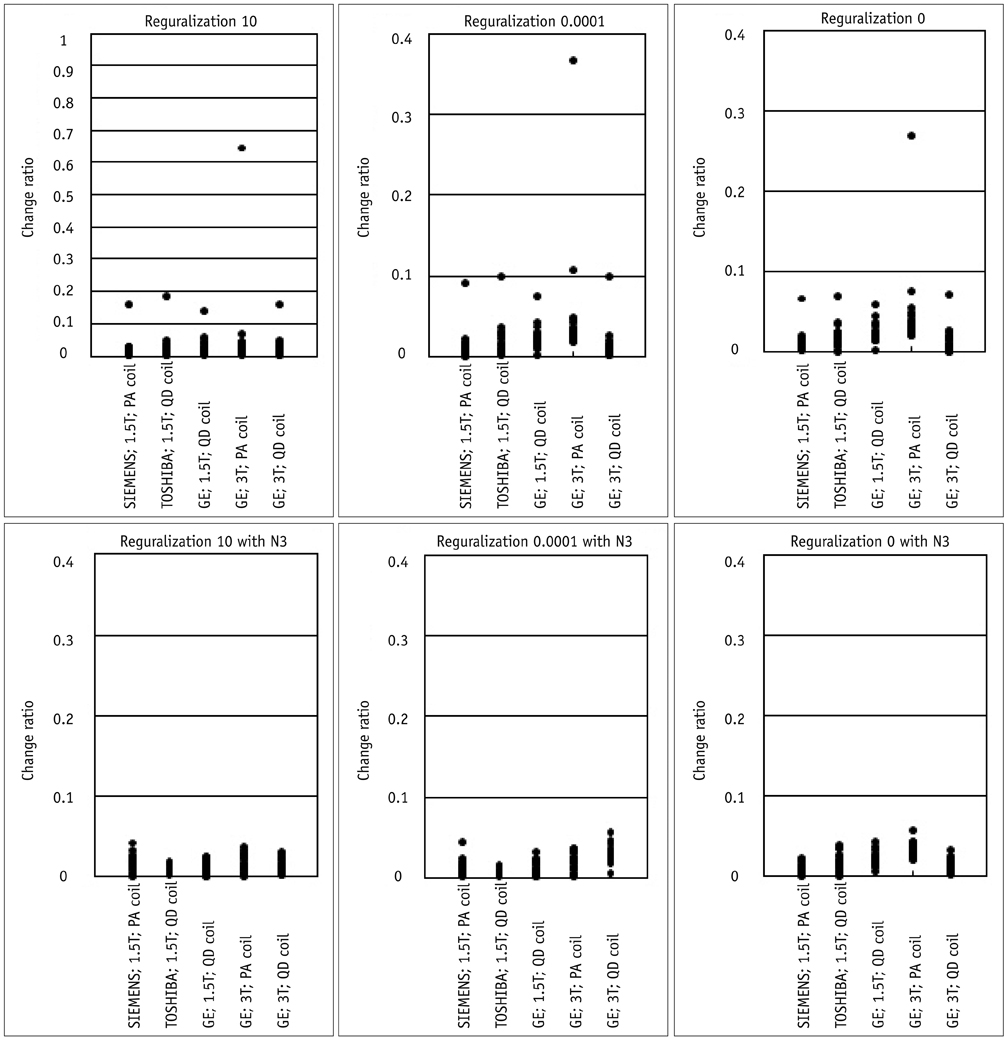
Fig. 5 Change ratio of structural volume on hippocampus, for each system. Bias-correction levels are shown at top of figure. Change ratios showed decrease with increasing bias-correction power (i.e., Regularization 10 < 0.0001 < 0 < 0 with N3); this trend was strongest for GE 3T PA coil protocol. 3T = 3 tesla, PA = phased-array, QD = quadrature
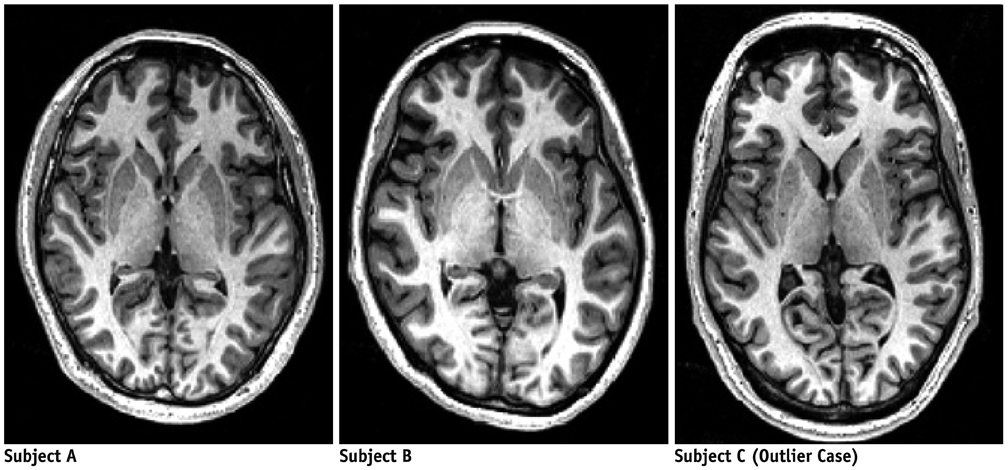
Fig. 6 T1 weighted-images of GE 3 tesla phased-array coil protocol with native space for three subjects. Subject C has more 0.1 change ratios, while subject A and B have less 0.1 change ratios.
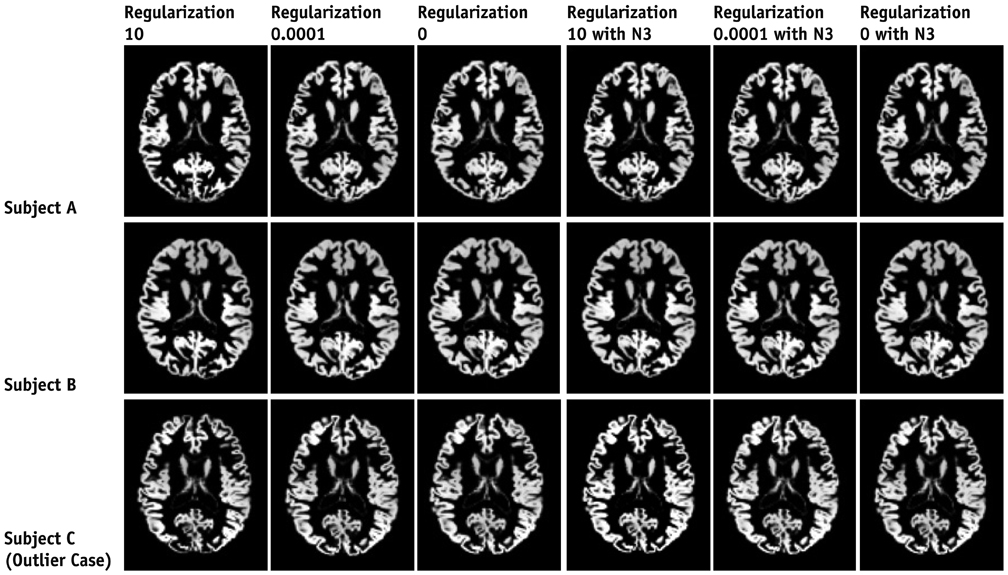
Fig. 7 Normalized gray matter images of GE 3 tesla phased-array coil protocol for three subjects. Subject C has more than 0.1 change ratios, and subject A and B have less than 0.1 change ratios. Bias-correction levels are shown at top of Figure.
Reference
-
1. Fox NC, Cousens S, Scahill R, Harvey RJ, Rossor MN. Using serial registered brain magnetic resonance imaging to measure disease progression in Alzheimer disease: power calculations and estimates of sample size to detect treatment effects. Arch Neurol. 2000. 57:339–344.2. Jack CR Jr, Shiung MM, Weigand SD, O'Brien PC, Gunter JL, Boeve BF, et al. Brain atrophy rates predict subsequent clinical conversion in normal elderly and amnestic MCI. Neurology. 2005. 65:1227–1231.3. Maldjian JA, Laurienti PJ, Kraft RA, Burdette JH. An automated method for neuroanatomic and cytoarchitectonic atlas-based interrogation of fMRI data sets. Neuroimage. 2003. 19:1233–1239.4. Gonoi W, Abe O, Yamasue H, Yamada H, Masutani Y, Takao H, et al. Age-related changes in regional brain volume evaluated by atlas-based method. Neuroradiology. 2010. 52:865–873.5. Rojas R, Rodríguez AO. Numerical study of the SNR and SAR of MRI coil arrays. Conf Proc IEEE Eng Med Biol Soc. 2007. 2007:1196–1199.6. Simmons A, Tofts PS, Barker GJ, Arridge SR. Sources of intensity nonuniformity in spin echo images at 1.5 T. Magn Reson Med. 1994. 32:121–128.7. Sled JG, Zijdenbos AP, Evans AC. A nonparametric method for automatic correction of intensity nonuniformity in MRI data. IEEE Trans Med Imaging. 1998. 17:87–97.8. Arnold JB, Liow JS, Schaper KA, Stern JJ, Sled JG, Shattuck DW, et al. Qualitative and quantitative evaluation of six algorithms for correcting intensity nonuniformity effects. Neuroimage. 2001. 13:931–943.9. Leow AD, Klunder AD, Jack CR Jr, Toga AW, Dale AM, Bernstein MA, et al. Longitudinal stability of MRI for mapping brain change using tensor-based morphometry. Neuroimage. 2006. 31:627–640.10. Vovk U, Pernus F, Likar B. A review of methods for correction of intensity inhomogeneity in MRI. IEEE Trans Med Imaging. 2007. 26:405–421.11. Ashburner J, Friston KJ. Unified segmentation. Neuroimage. 2005. 26:839–851.12. Fazekas F, Chawluk JB, Alavi A, Hurtig HI, Zimmerman RA. MR signal abnormalities at 1.5 T in Alzheimer's dementia and normal aging. AJR Am J Roentgenol. 1987. 149:351–356.13. Jack CR Jr, Bernstein MA, Fox NC, Thompson P, Alexander G, Harvey D, et al. The Alzheimer's Disease Neuroimaging Initiative (ADNI): MRI methods. J Magn Reson Imaging. 2008. 27:685–691.14. Schnack HG, van Haren NE, Hulshoff Pol HE, Picchioni M, Weisbrod M, Sauer H, et al. Reliability of brain volumes from multicenter MRI acquisition: a calibration study. Hum Brain Mapp. 2004. 22:312–320.15. van Haren NE, Cahn W, Hulshoff Pol HE, Schnack HG, Caspers E, Lemstra A, et al. Brain volumes as predictor of outcome in recent-onset schizophrenia: a multi-center MRI study. Schizophr Res. 2003. 64:41–52.16. Turner JA, Smyth P, Macciardi F, Fallon JH, Kennedy JL, Potkin SG. Imaging phenotypes and genotypes in schizophrenia. Neuroinformatics. 2006. 4:21–49.17. Kruggel F, Turner J, Muftuler LT. Alzheimer's Disease Neuroimaging Initiative. Impact of scanner hardware and imaging protocol on image quality and compartment volume precision in the ADNI cohort. Neuroimage. 2010. 49:2123–2133.18. Fischl B, Salat DH, van der Kouwe AJ, Makris N, Ségonne F, Quinn BT, et al. Sequence-independent segmentation of magnetic resonance images. Neuroimage. 2004. 23:Suppl 1. S69–S84.19. Kruggel F. MRI-based volumetry of head compartments: normative values of healthy adults. Neuroimage. 2006. 30:1–11.20. Barnes J, Scahill RI, Boyes RG, Frost C, Lewis EB, Rossor CL, et al. Differentiating AD from aging using semiautomated measurement of hippocampal atrophy rates. Neuroimage. 2004. 23:574–581.21. Ashburner J, Friston KJ. Voxel-based morphometry--the methods. Neuroimage. 2000. 11:805–821.22. Joo EY, Tae WS, Kim ST, Hong SB. Gray matter concentration abnormality in brains of narcolepsy patients. Korean J Radiol. 2009. 10:552–558.23. Thompson PM, Giedd JN, Woods RP, MacDonald D, Evans AC, Toga AW. Growth patterns in the developing brain detected by using continuum mechanical tensor maps. Nature. 2000. 404:190–193.24. Shuter B, Yeh IB, Graham S, Au C, Wang SC. Reproducibility of brain tissue volumes in longitudinal studies: effects of changes in signal-to-noise ratio and scanner software. Neuroimage. 2008. 41:371–379.25. Ewers M, Teipel SJ, Dietrich O, Schönberg SO, Jessen F, Heun R, et al. Multicenter assessment of reliability of cranial MRI. Neurobiol Aging. 2006. 27:1051–1059.26. Jovicich J, Czanner S, Han X, Salat D, van der Kouwe A, Quinn B, et al. MRI-derived measurements of human subcortical, ventricular and intracranial brain volumes: reliability effects of scan sessions, acquisition sequences, data analyses, scanner upgrade, scanner vendors and field strengths. Neuroimage. 2009. 46:177–192.27. Han X, Jovicich J, Salat D, van der Kouwe A, Quinn B, Czanner S, et al. Reliability of MRI-derived measurements of human cerebral cortical thickness: the effects of field strength, scanner upgrade and manufacturer. Neuroimage. 2006. 32:180–194.28. Boyes RG, Gunter JL, Frost C, Janke AL, Yeatman T, Hill DL, et al. Intensity non-uniformity correction using N3 on 3-T scanners with multichannel phased array coils. Neuroimage. 2008. 39:1752–1762.29. Jovicich J, Czanner S, Greve D, Haley E, van der Kouwe A, Gollub R, et al. Reliability in multi-site structural MRI studies: effects of gradient non-linearity correction on phantom and human data. Neuroimage. 2006. 30:436–443.
- Full Text Links
-
- Actions
-
Cited
- CITED
-
- Close
- Share
-
- Similar articles
-
- A Projection-based Intensity Correction Method of Phased-Array Coil Images
- Hippocampus/Frontal Gyrus FLAIR Signal Intensity Ratio in Patients with Mesial Temporal Lobe Epilepsy
- Evaluation of Magnetic Resonance Image of the Brain Suggestive of Hepatic Encephalopathy
- Congenital Glioblastoma Multiforme: A Case Report
- The Mri-Based Comparison Of Normal- And Abnormal-Side Retrodiscal Tissue, And Relationship Between Clinical Examination & The Mri Findings Of Retrodiscal Tissue In Patients With Unilateral Tmj Internal Derangement
