Comparison of 1.5T and 3T 1H MR Spectroscopy for Human Brain Tumors
- Affiliations
-
- 1Department of Radiology, Seoul Municipal Boramae Hospital Affiliated to Seoul National University Hospital, Seoul, Korea. changkh@radcom.snu.ac.kr
- 2Department of Radiology, Seoul National University College of Medicine, Seoul, Korea.
- 3the Institute of Radiation Medicine, Seoul, Korea.
- 4Neuroscience Research Institute, Seoul National University Medical Research Center, Seoul, Korea.
- KMID: 1114347
- DOI: http://doi.org/10.3348/kjr.2006.7.3.156
Abstract
OBJECTIVE
We wanted to estimate the practical improvements of 3T proton MR spectroscopy (1H MRS) as compared with 1.5T 1H MRS for the evaluation of human brain tumors. MATERIALS AND METHODS: Single voxel 1H MRS was performed at both 1.5T and 3T in 13 patients suffering with brain tumors. Using the same data acquisition parameters at both field strengths, the 1H MRS spectra were obtained with a short echo time (TE) (35 msec) and an intermediate TE (144 msec) with the voxel size ranging from 2.0 cm3 to 8.7 cm3. The signal to noise ratios (SNRs) of the metabolites (myoinositol (MI), choline compounds (Cho), creatine /phosphocreatine (Cr), N-acetyl-aspartate (NAA), lipid and lactate (LL)) and the metabolite ratios of MI/Cr, Cho/Cr, Cho/NAA and LL/Cr were compared at both TEs between the two field strengths in each brain tumor. The degrees of spectral resolution between the Cho and Cr peaks were qualitatively compared between the two field strengths in each brain tumor. RESULTS: The SNRs of the metabolites at 3T demonstrated 49-73% increase at a short TE (p < 0.01) and only 2-12% increase at an intermediate TE (p > 0.05) compared with those of 1.5T. The SNR of inverted lactate at an intermediate TE decreased down to 49% with poorer inversion at 3T (p < 0.05). There was no significant difference in the metabolite ratios between the two field strengths. The degrees of the spectral resolution at 3T were slightly superior to those of 1.5T at a short TE. CONCLUSION: As compared with 1.5T, 3T 1H MRS demonstrated 49-73% SNR increase in the cerebral metabolites and slightly superior spectral resolution only at a short TE, but little at an intermediate TE, in the brain tumors. There was no significant difference in the metabolite ratios between the two field strengths.
Keyword
MeSH Terms
Figure
-

Fig. 1 Standard error graph of the 3T/1.5T signal to noise ratios of each metabolite in the patients with brain tumor (n = 13). The small square is the mean, and the upper and lower transverse lines show the 95% values of the data. The 3T/1.5T signal to noise ratios of all the metabolites are significantly increased at a short echo time: however, they were not at an intermediate echo time.
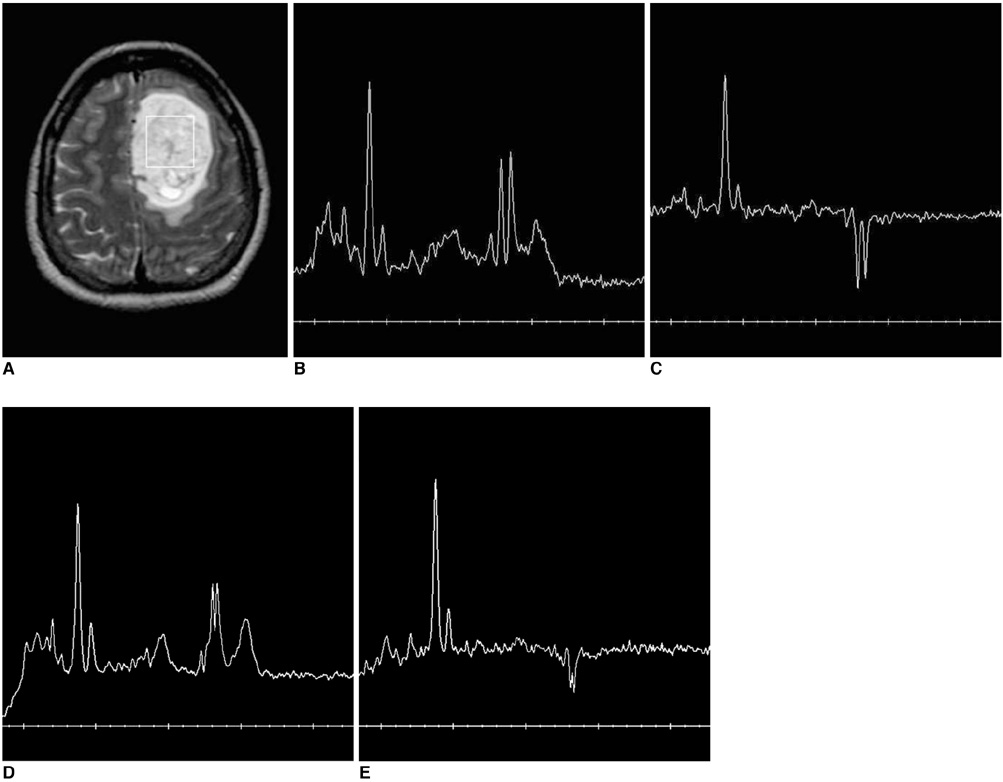
Fig. 2 A 40-year-old woman with anaplastic astrocytoma. A. The axial T2-weighted image reveals a mass of high signal intensity with a square voxel (7.1 cm3) at the left high frontal lobe. B. The 1H MR spectrum obtained at a short TE on 1.5T shows markedly increased Cho/Cr, decreased NAA/Cr and increased lipid and lactate. C. The 1H MR spectrum obtained at an intermediate TE on 1.5T shows an inverted lactate peak at 1.3 ppm in addition to increased Cho/Cr. D. The 1H MR spectrum obtained at a short TE on 3T shows a better SNR and better spectral resolution between Cho and Cr than on 1.5T (B), and it is otherwise similar to 1.5T (B). E. The 1H MR spectrum obtained at an intermediate TE on 3T shows an inverted lactate peak at 1.3 ppm that is significantly smaller than that of 1.5T (C).

Fig. 3 A 49-year-old man with anaplastic oligodendroglioma. A. The axial T2-weighted image reveals a heterogenous mass with probable hemorrhagic portion in the right frontal lobe. A rectangular voxel (2.3 cm3) contains the solid tumor portion, including a small possibly hemorrhagic area, and it is located close to the calvarium. B. The 1H MR spectrum obtained at a short TE on 1.5T shows slightly elevated Cho/Cr and decreased NAA/Cr with many noisy signals. C. The 1H MR spectrum obtained at an intermediate TE on 1.5T shows elevated Cho/Cr, decreased NAA/Cr and an inverted lactate peak (1.3 ppm). D. The 1H MR spectrum obtained at a short TE on 3T shows slightly elevated Cho/Cr and decreased NAA/Cr with a slightly better SNR and shimming compared with the 1.5T (B). E. The 1H MR spectrum obtained at an intermediate TE on 3T shows much more noise than that of the 1.5T (C) and there is no discernible inverted lactate peak at 1.3 ppm, and this is presumably due to the high susceptibility effect secondary to probable intratumoral hemorrhage and the close proximity to the calvarium.
Reference
-
1. Moller-Hartmann W, Herminghaus S, Krings T, Marquardt G, Lanfermann H, Pilatus U, et al. Clinical application of proton magnetic resonance spectroscopy in the diagnosis of intracranial mass lesions. Neuroradiology. 2002. 44:371–381.2. Shimizu H, Kumabe T, Tominaga T, Kayama T, Hara K, Ono Y, et al. Noninvasive evaluation of malignancy of brain tumors with proton MR spectroscopy. AJNR Am J Neuroradiol. 1996. 17:737–747.3. Rabinov JD, Lee PL, Barker FG, Louis DN, Harsh GR, Cosgrove GR, et al. In vivo 3-T MR spectroscopy in the distinction of recurrent glioma versus radiation effects: initial experience. Radiology. 2002. 225:871–879.4. Ott D, Hennig J, Ernst T. Human brain tumor: assessment with in vivo proton MR spectroscopy. Radiology. 1993. 186:745–752.5. Barker PB, Glickson JD, Bryan RN. In vivo magnetic resonance spectroscopy of human brain tumors. Top Magn Reson Imaging. 1993. 5:32–45.6. Gonen O, Gruber S, Li BS, Mlynarik V, Moser E. Multivoxel 3D proton spectroscopy in the brain at 1.5 versus 3.0T: signal-to-noise ratio and resolution comparison. AJNR Am J Neuroradiol. 2001. 22:1727–1731.7. Barker PB, Hearshen DO, Boska MD. Single-voxel proton MRS of the human brain at 1.5T and 3.0T. Magn Reson Med. 2001. 45:765–769.8. Gruber S, Mlynarik V, Moser E. High-resolution 3D proton spectroscopic imaging of the human brain at 3T: SNR issues and application for anatomy-matched voxel sizes. Magn Reson Med. 2003. 49:299–306.9. Kantarci K, Reynolds G, Petersen RC, Boeve BF, Knopman DS, Edland SD, et al. Proton MR spectroscopy in mild cognitive impairment and Alzheimer disease: comparison of 1.5 and 3T. AJNR Am J Neuroradiol. 2003. 24:843–849.10. Bartha R, Drost DJ, Menon RS, Williamson PC. Comparison of the quantification precision of human short echo time 1H spectroscopy at 1.5 and 4.0 tesla. Magn Reson Med. 2000. 44:185–192.11. Kaminogo M, Ishimaru H, Morikawa M, Ochi M, Ushijima R, Tani M, et al. Diagnostic potential of short echo time MR spectroscopy of gliomas with single-voxel and point-resolved spatially localised proton spectroscopy of brain. Neuroradiology. 2001. 43:353–363.12. Howe FA, Barton SJ, Cudlip SA, Stubbs M, Saunders DE, Murphy M, et al. Metabolic profiles of human brain tumors using quantitative in vivo 1H magnetic resonance spectroscopy. Magn Reson Med. 2003. 49:223–232.13. Isobe T, Matsumura A, Anno I, Yoshizawa T, Nagatomo Y, Itai Y, et al. Quantification of cerebral metabolites in glioma patients with proton MR spectroscopy using T2 relaxation time correction. Magn Reson Imaging. 2002. 20:343–349.
- Full Text Links
-
- Actions
-
Cited
- CITED
-
- Close
- Share
-
- Similar articles
-
- Localized, water-suppressed in vivo H MR spectroscopy of human brain tumors: Preliminary results
- In vivo H MR spectroscopy of human brain in six normal volunteers
- High field strength magnetic resonance imaging of abdominal diseases
- Quantification of Dextrose in Model Solution by H MR Spectroscopy at 1.5T
- In Vivo Single Voxel 1H MR Spectroscopy in Cerebral Glioma
