Korean J Radiol.
2010 Jun;11(3):327-332. 10.3348/kjr.2010.11.3.327.
Cellular Density Evaluation for Malignant Lymphoma Using Equivalent Cross-Relaxation Rate Imaging - Initial Experience
- Affiliations
-
- 1Department of Radiology, Nara Medical University, Nara 634-8521, Japan. nishiofukuhideyuki@yahoo.co.jp
- 2Department of Diagnostic and Interventional Radiology, Aichi Cancer Center Hospital, Nagoya 464-8641, Japan.
- 3Department of Hematology and Cell Therapy, Aichi Cancer Center Hospital, Nagoya 464-8641, Japan.
- KMID: 946273
- DOI: http://doi.org/10.3348/kjr.2010.11.3.327
Abstract
OBJECTIVE
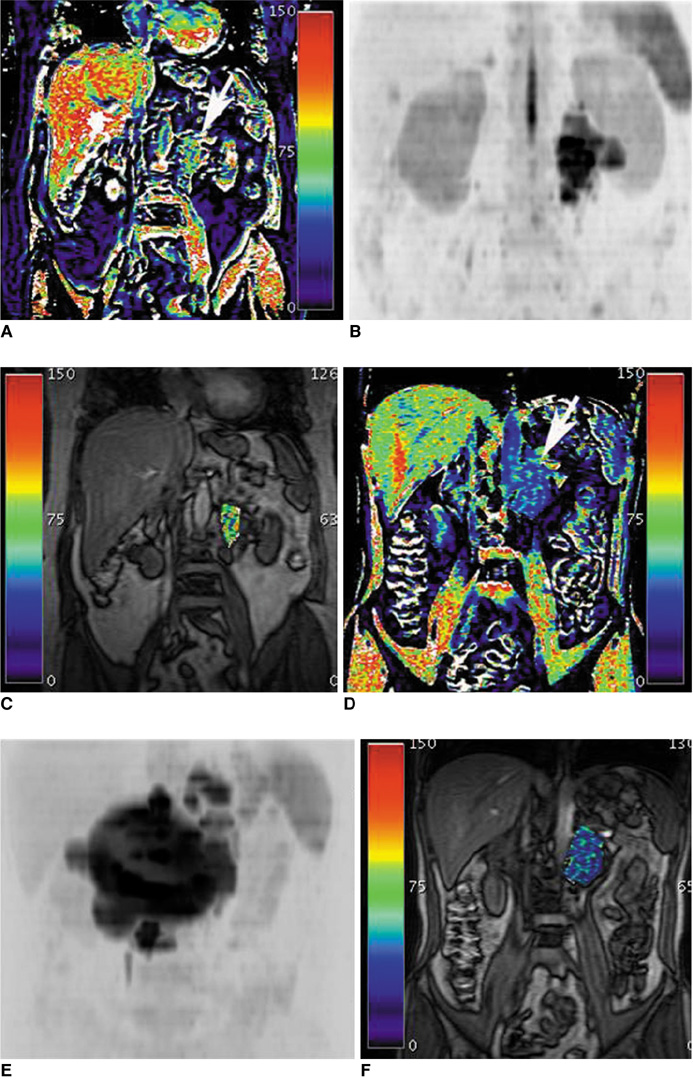
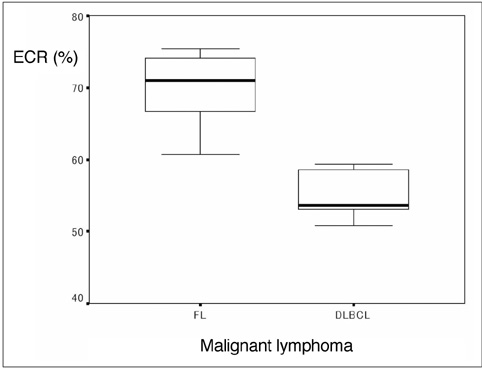
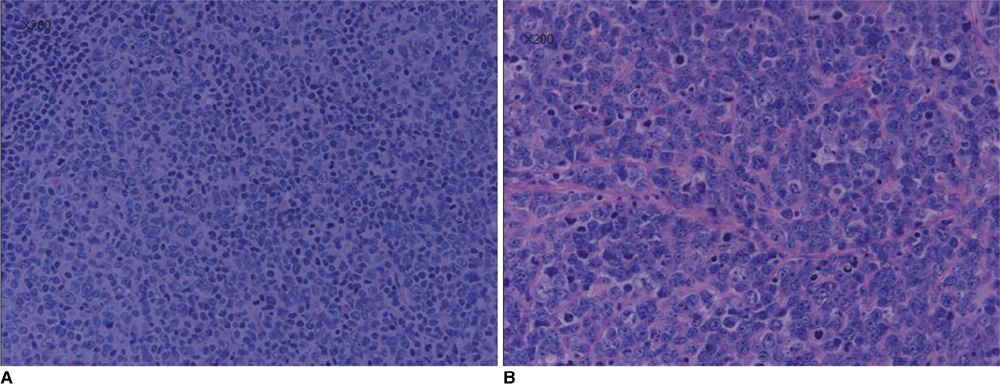
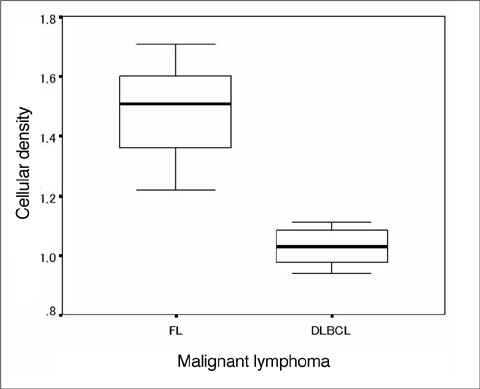
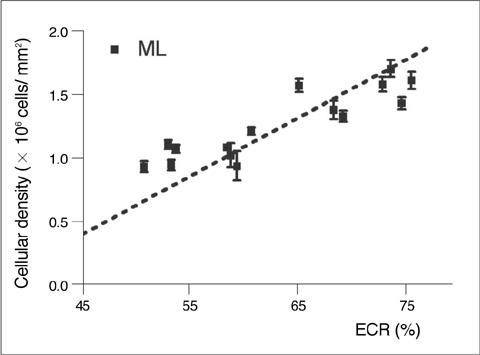
Equivalent cross-relaxation rate (ECR) imaging is an MRI technique used to evaluate quantitatively a change in the protein-water interaction. We aimed to evaluate retrospectively the usefulness of ECR imaging for the histologic classification of malignant lymphoma (ML). MATERIALS AND METHODS: Institutional Review Board approval was obtained and all patients provided informed consent. The study subjects included 15 patients with untreated ML who were histologically diagnosed with follicular lymphoma (FL; n = 8) or diffuse large B-cell lymphoma (DLBCL; n = 7). All patients underwent ECR imaging and the offset frequency was set at 7 ppm. RESULTS: The median ECR values were 71% (range; 60.7 to 75.5) in FL and 54% (50.8 to 59.4) in DLBCL (p = 0.001). The median cellular density was 1.5 +/- 0.17 x 10(6) / mm2 in FL and 1.0 +/- 0.70 x 10(6) / mm2 in DLBCL (p = 0.001). The correlation coefficient between the ECR values and cellular density in ML was 0.88 (p = 0.001). In FL and DLBCL, assuming ECR value cut-off points of 60%, both sensitivity and specificity were 100%. CONCLUSION: A strong correlation between ECR and cellular density in ML is demonstrated and the ECR may be a useful technique to differentiate between FL and DLBCL.
Keyword
MeSH Terms
Figure
Reference
-
1. Matsushima S, Sasaki F, Kinosada Y, Maeda H, Sogami M, Era S, et al. Saturation transfer ratio imaging in invasive ductal carcinomas of the breast. Magn Reson Imaging. 2000. 18:379–385.2. Callicott C, Thomas JM, Goode AW. The magnetization transfer characteristics of human breast tissues: an in vitro NMR study. Phys Med Biol. 1999. 44:1147–1154.3. Sogami M, Era S, Kinosada Y, Matsushima S, Kato K, Tomida M, et al. Basic studies on the equivalent cross-relaxation rate imaging (equivalent CRI)--phantom studies. NMR Biomed. 2001. 14:367–375.4. Matsushima S, Takasu A, Inai Y, Hirabayashi T, Era S, Sogami M, et al. Equivalent cross-relaxation rate imaging in the synthetic copolymer gels and invasive ductal carcinomas of the breast. Magn Reson Imaging. 2002. 20:285–293.5. Moran PR, Hamilton CA. Near-resonance spin-lock contrast. Magn Reson Imaging. 1995. 13:837–846.6. Ulmer JL, Mathews VP, Hamilton CA, Elster AD, Moran PR. Magnetization transfer or spin-lock? An investigation of offresonance saturation pulse imaging with varying frequency offsets. AJNR Am J Neuroradiol. 1996. 17:805–819.7. Mastsushima S, Nishiofuku H, Iwata H, Era S, Inaba Y, Kinosada Y. Equivalent cross-relaxation rate imaging of axillary lymph nodes in breast cancer. J Magn Reson Imaging. 2008. 27:1278–1283.8. Isasi CR, Lu P, Blaufox MD. A metaanalysis of 18F-2-deoxy-2-fluoro-D-glucose positron emission tomography in the staging and restaging of patients with lymphoma. Cancer. 2005. 104:1066–1074.9. Karam M, Novak L, Cyriac J, Ali A, Nazeer T, Nugent F. Role of fluorine-18 fluoro-deoxyglucose positron emission tomography scan in the evaluation and follow-up of patients with low-grade lymphomas. Cancer. 2006. 107:175–183.10. Juweid ME, Cheson BD. Role of positron emission tomography in lymphoma. J Clin Oncol. 2005. 23:4577–4580.11. Brennan DD, Gleeson T, Coate LE, Cronin C, Carney D, Eustace SJ. A comparison of whole-body MRI and CT for the staging of lymphoma. AJR Am J Roentgenol. 2005. 185:711–716.12. Sogami M, Era S, Koseki T, Nagai N. Structural characterization of the molten globule and native states of ovalbumin: a 1H NMR study. J Pept Res. 1997. 50:465–474.13. Yuen S, Yamada K, Kinosada Y, Matsushima S, Nakano Y, Goto M, et al. Equivalent cross-relaxation rate imaging of breast cancer. J Magn Reson Imaging. 2004. 20:56–65.14. Jakić-Razumović J, Aurer I. The World Health Organization classification of lymphomas. Croat Med J. 2002. 43:527–534.15. Schöder H, Noy A, Gönen M, Weng L, Green D, Erdi YE, et al. Intensity of 18fluorodeoxyglucose uptake in positron emission tomography distinguishes between indolent and aggressive non-Hodgkin's lymphoma. J Clin Oncol. 2005. 23:4643–4651.16. Koh DM, Collins DJ. Diffusion-weighted MRI in the body: applications and challenges in oncology. AJR Am J Roentgenol. 2007. 188:1622–1635.17. Matsushima S, Sasaki F, Sarumaru S, Ohta D, Era S, Sogami M, et al. Equivalent cross relaxation rate image for decreasing a false negative case of sentinel lymph node biopsy. Magn Reson Imaging. 2003. 21:1045–1047.18. Matsushima S, Sasaki F, Yamaura H, Iwata H, Ohsaki H, Era S, et al. Equivalent cross-relaxation rate imaging for sentinel lymph node biopsy in breast carcinoma. Magn Reson Med. 2005. 54:1300–1304.
- Full Text Links
- Actions
-
Cited
- CITED
-
- Close
- Share
- Similar articles
-
- The Production and Evaluation of the Tissue-equivalent Phantom for the Magnetic Resonance Imaging
- Typical and Atypical Imaging Features of Malignant Lymphoma in the Abdomen and Mimicking Diseases
- The Clinical Role of FDG PET in Malignant Lymphoma
- A Case of Malignant Lymphoma
- A case of non-Hodgkin's lymphoma with initial manifestation in the testis

