Cancer Res Treat.
2024 Oct;56(4):1146-1163. 10.4143/crt.2024.317.
Effector Function Characteristics of Exhausted CD8+ T-Cell in Microsatellite Stable and Unstable Gastric Cancer
- Affiliations
-
- 1Department of Surgery, SMG-SNU Boramae Medical Center, Seoul, Korea
- 2Department of Pathology, Seoul National University Hospital, Seoul National University College of Medicine, Seoul, Korea
- 3Department of Surgery, Seoul National University Hospital, Seoul National University College of Medicine, Seoul, Korea
- 4Department of Interdisciplinary Program in Cancer Biology, Seoul National University College of Medicine, Seoul, Korea
- 5Cancer Research Institute, Seoul National University College of Medicine, Seoul, Korea
- 6Macrogen Inc., Seoul, Korea
- KMID: 2560249
- DOI: http://doi.org/10.4143/crt.2024.317
Abstract
- Purpose
Gastric cancer exhibits molecular heterogeneity, with the microsatellite instability–high (MSI-H) subtype drawing attention for its distinct features. Despite a higher survival rate, MSI-H gastric cancer lack significant benefits from conventional chemotherapy. The immune checkpoint inhibitors, presents a potential avenue, but a deeper understanding of the tumor immune microenvironment of MSI-H gastric cancer is essential.
Materials and Methods
We explored the molecular characteristics of CD8+ T-cell subtypes in three MSI-H and three microsatellite stable (MSS) gastric cancer samples using single-cell RNA sequencing and spatial transcriptome analysis.
Results
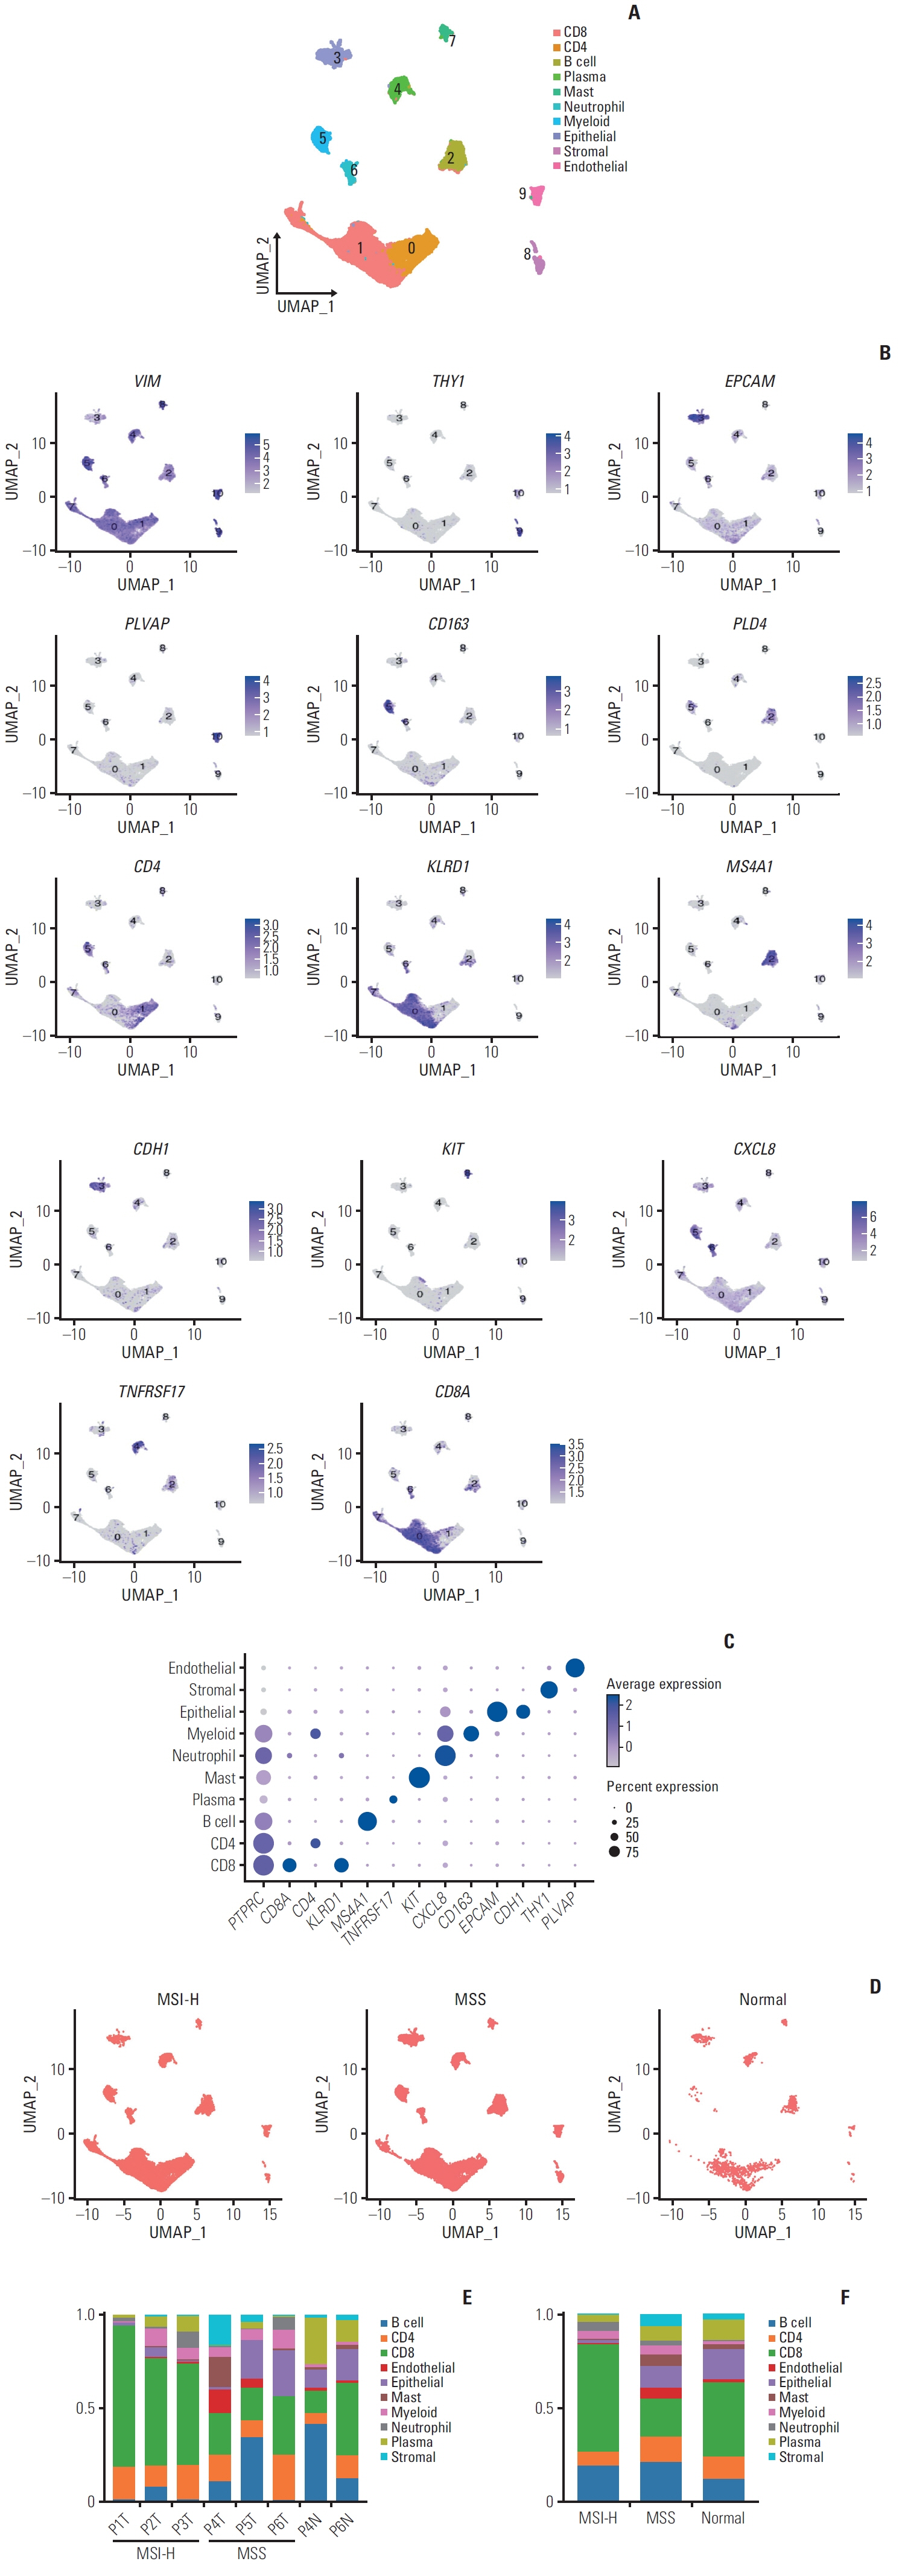
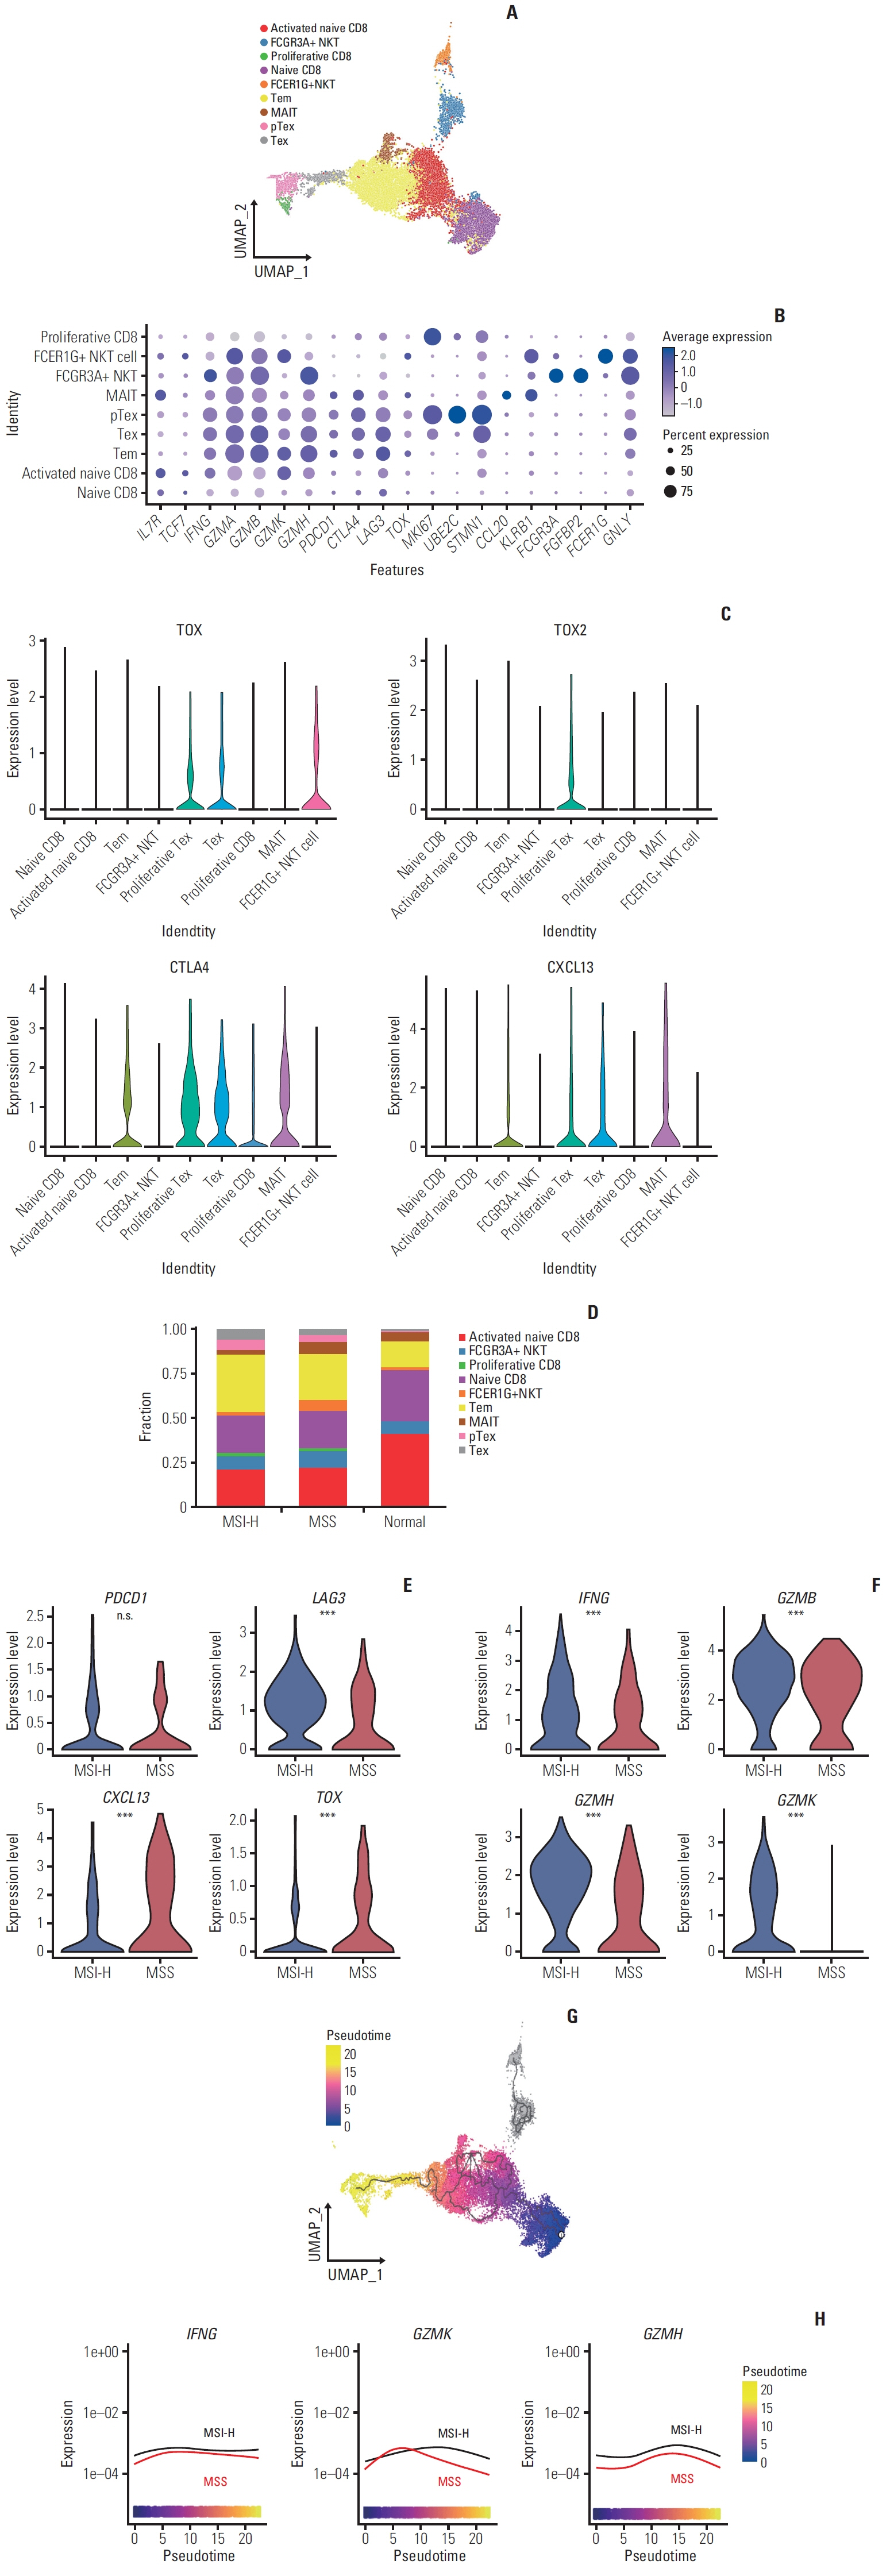
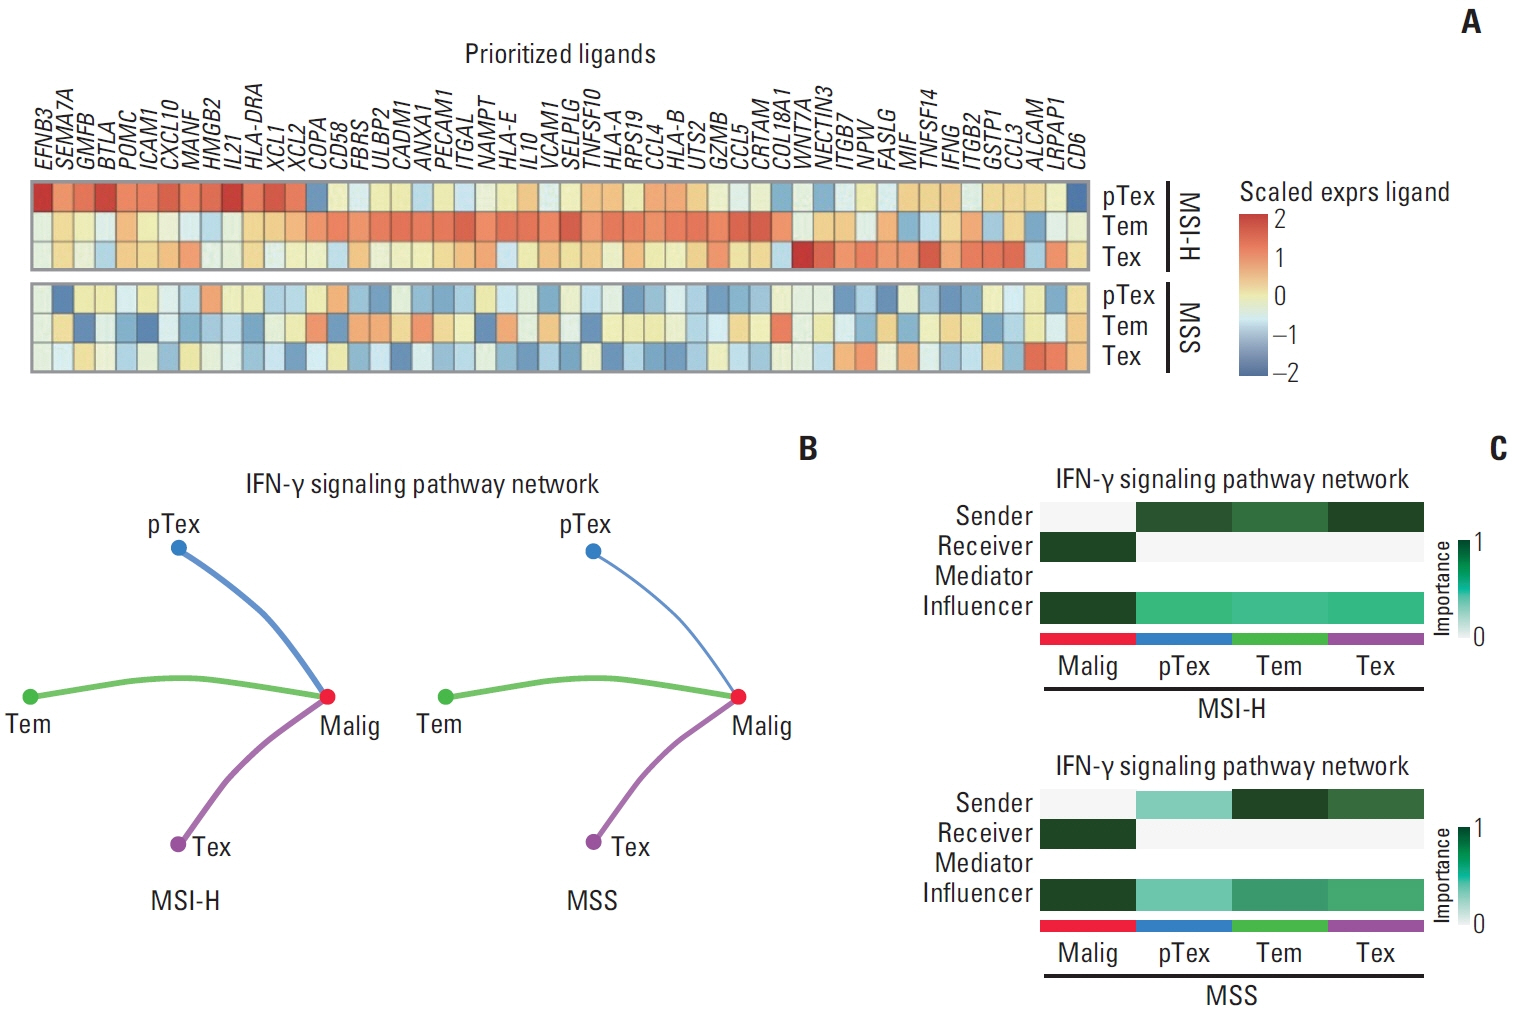
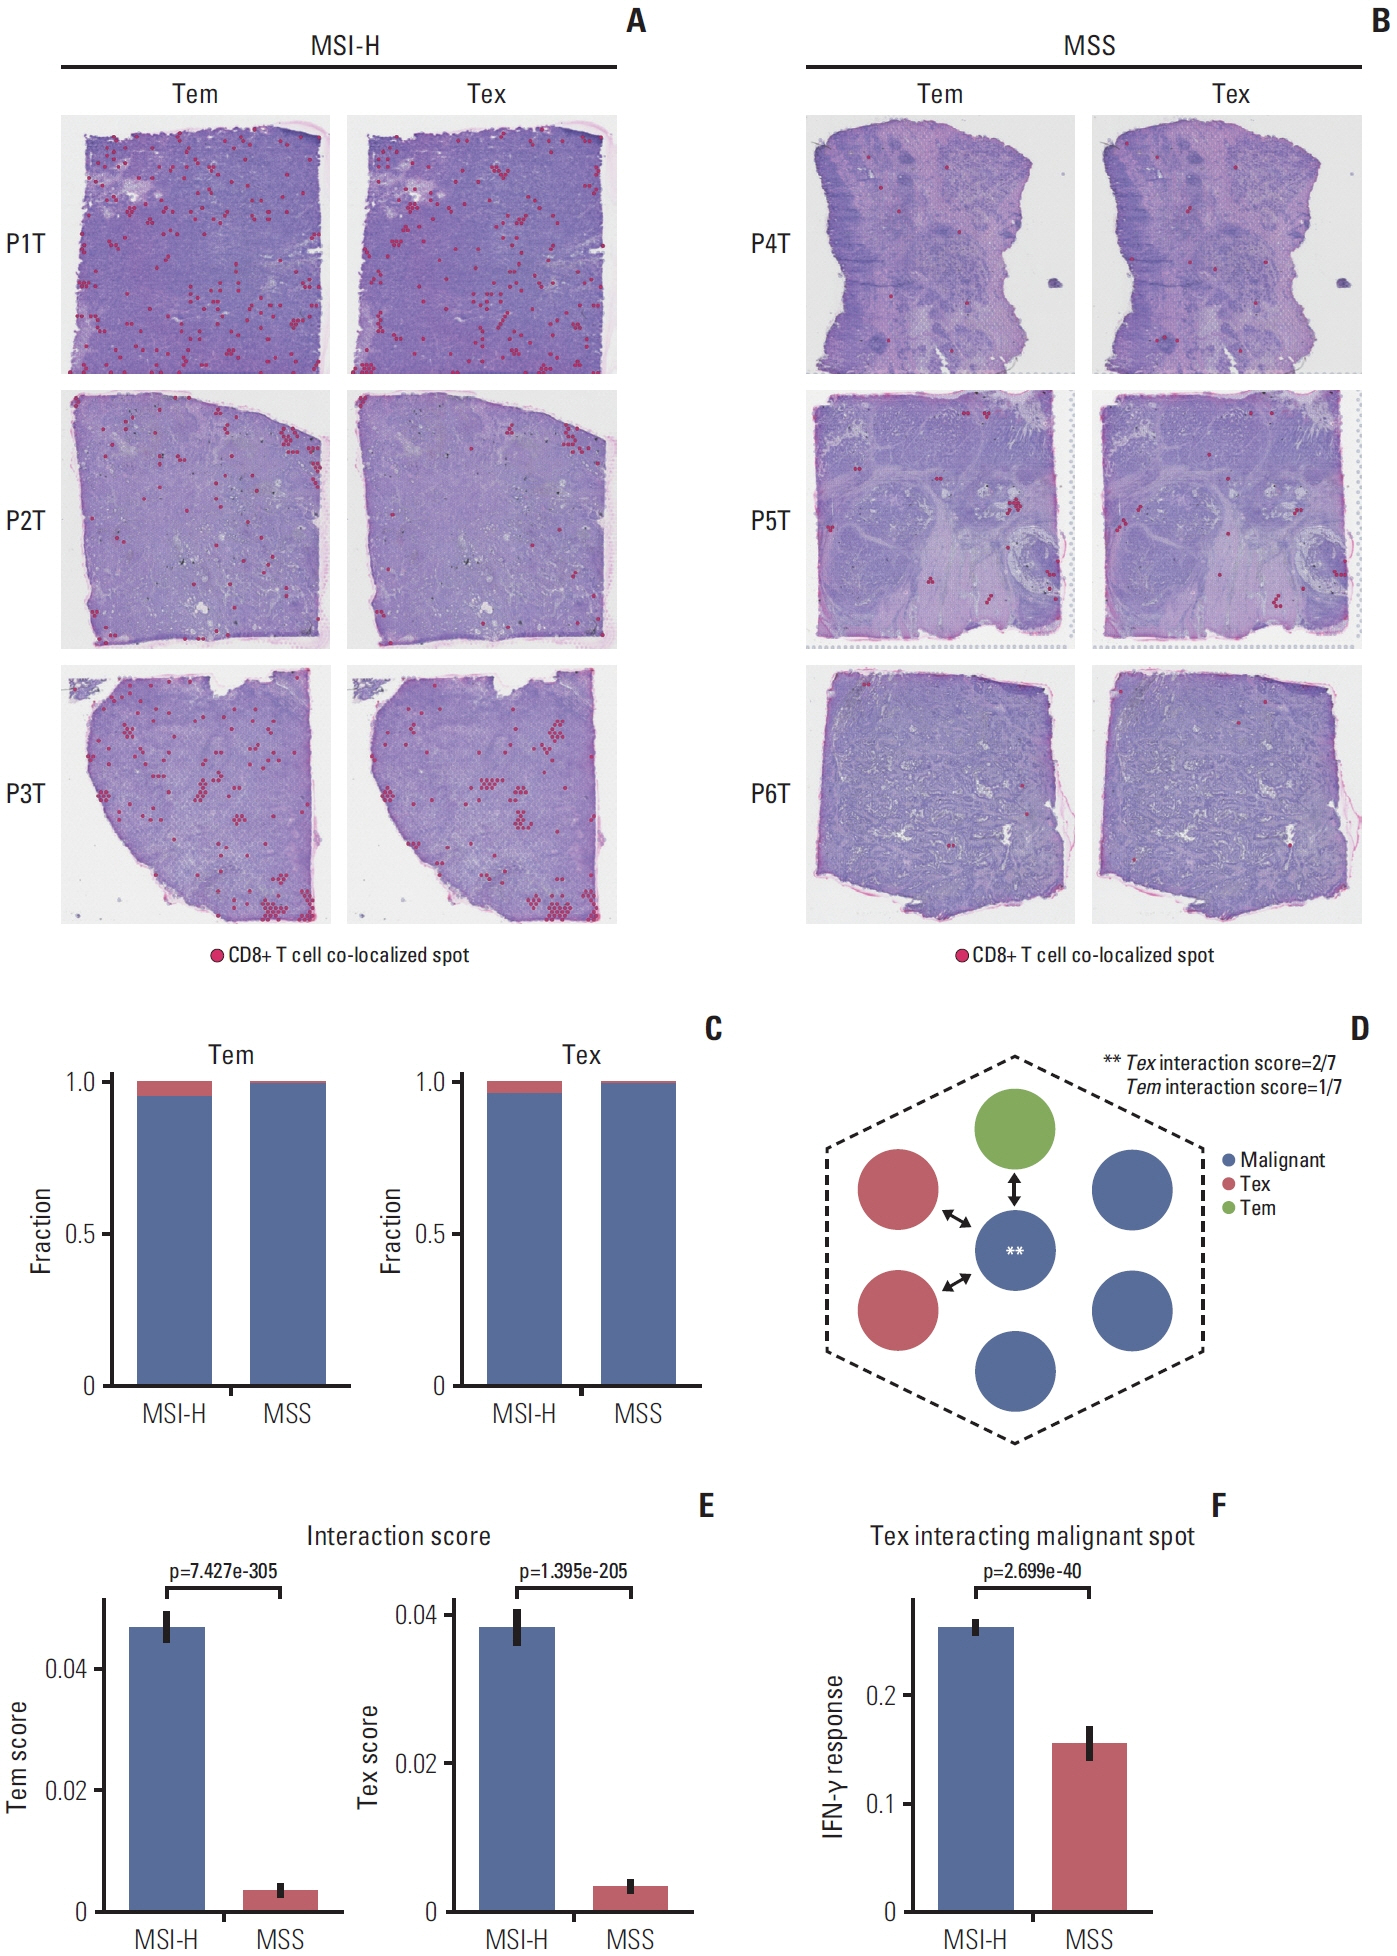
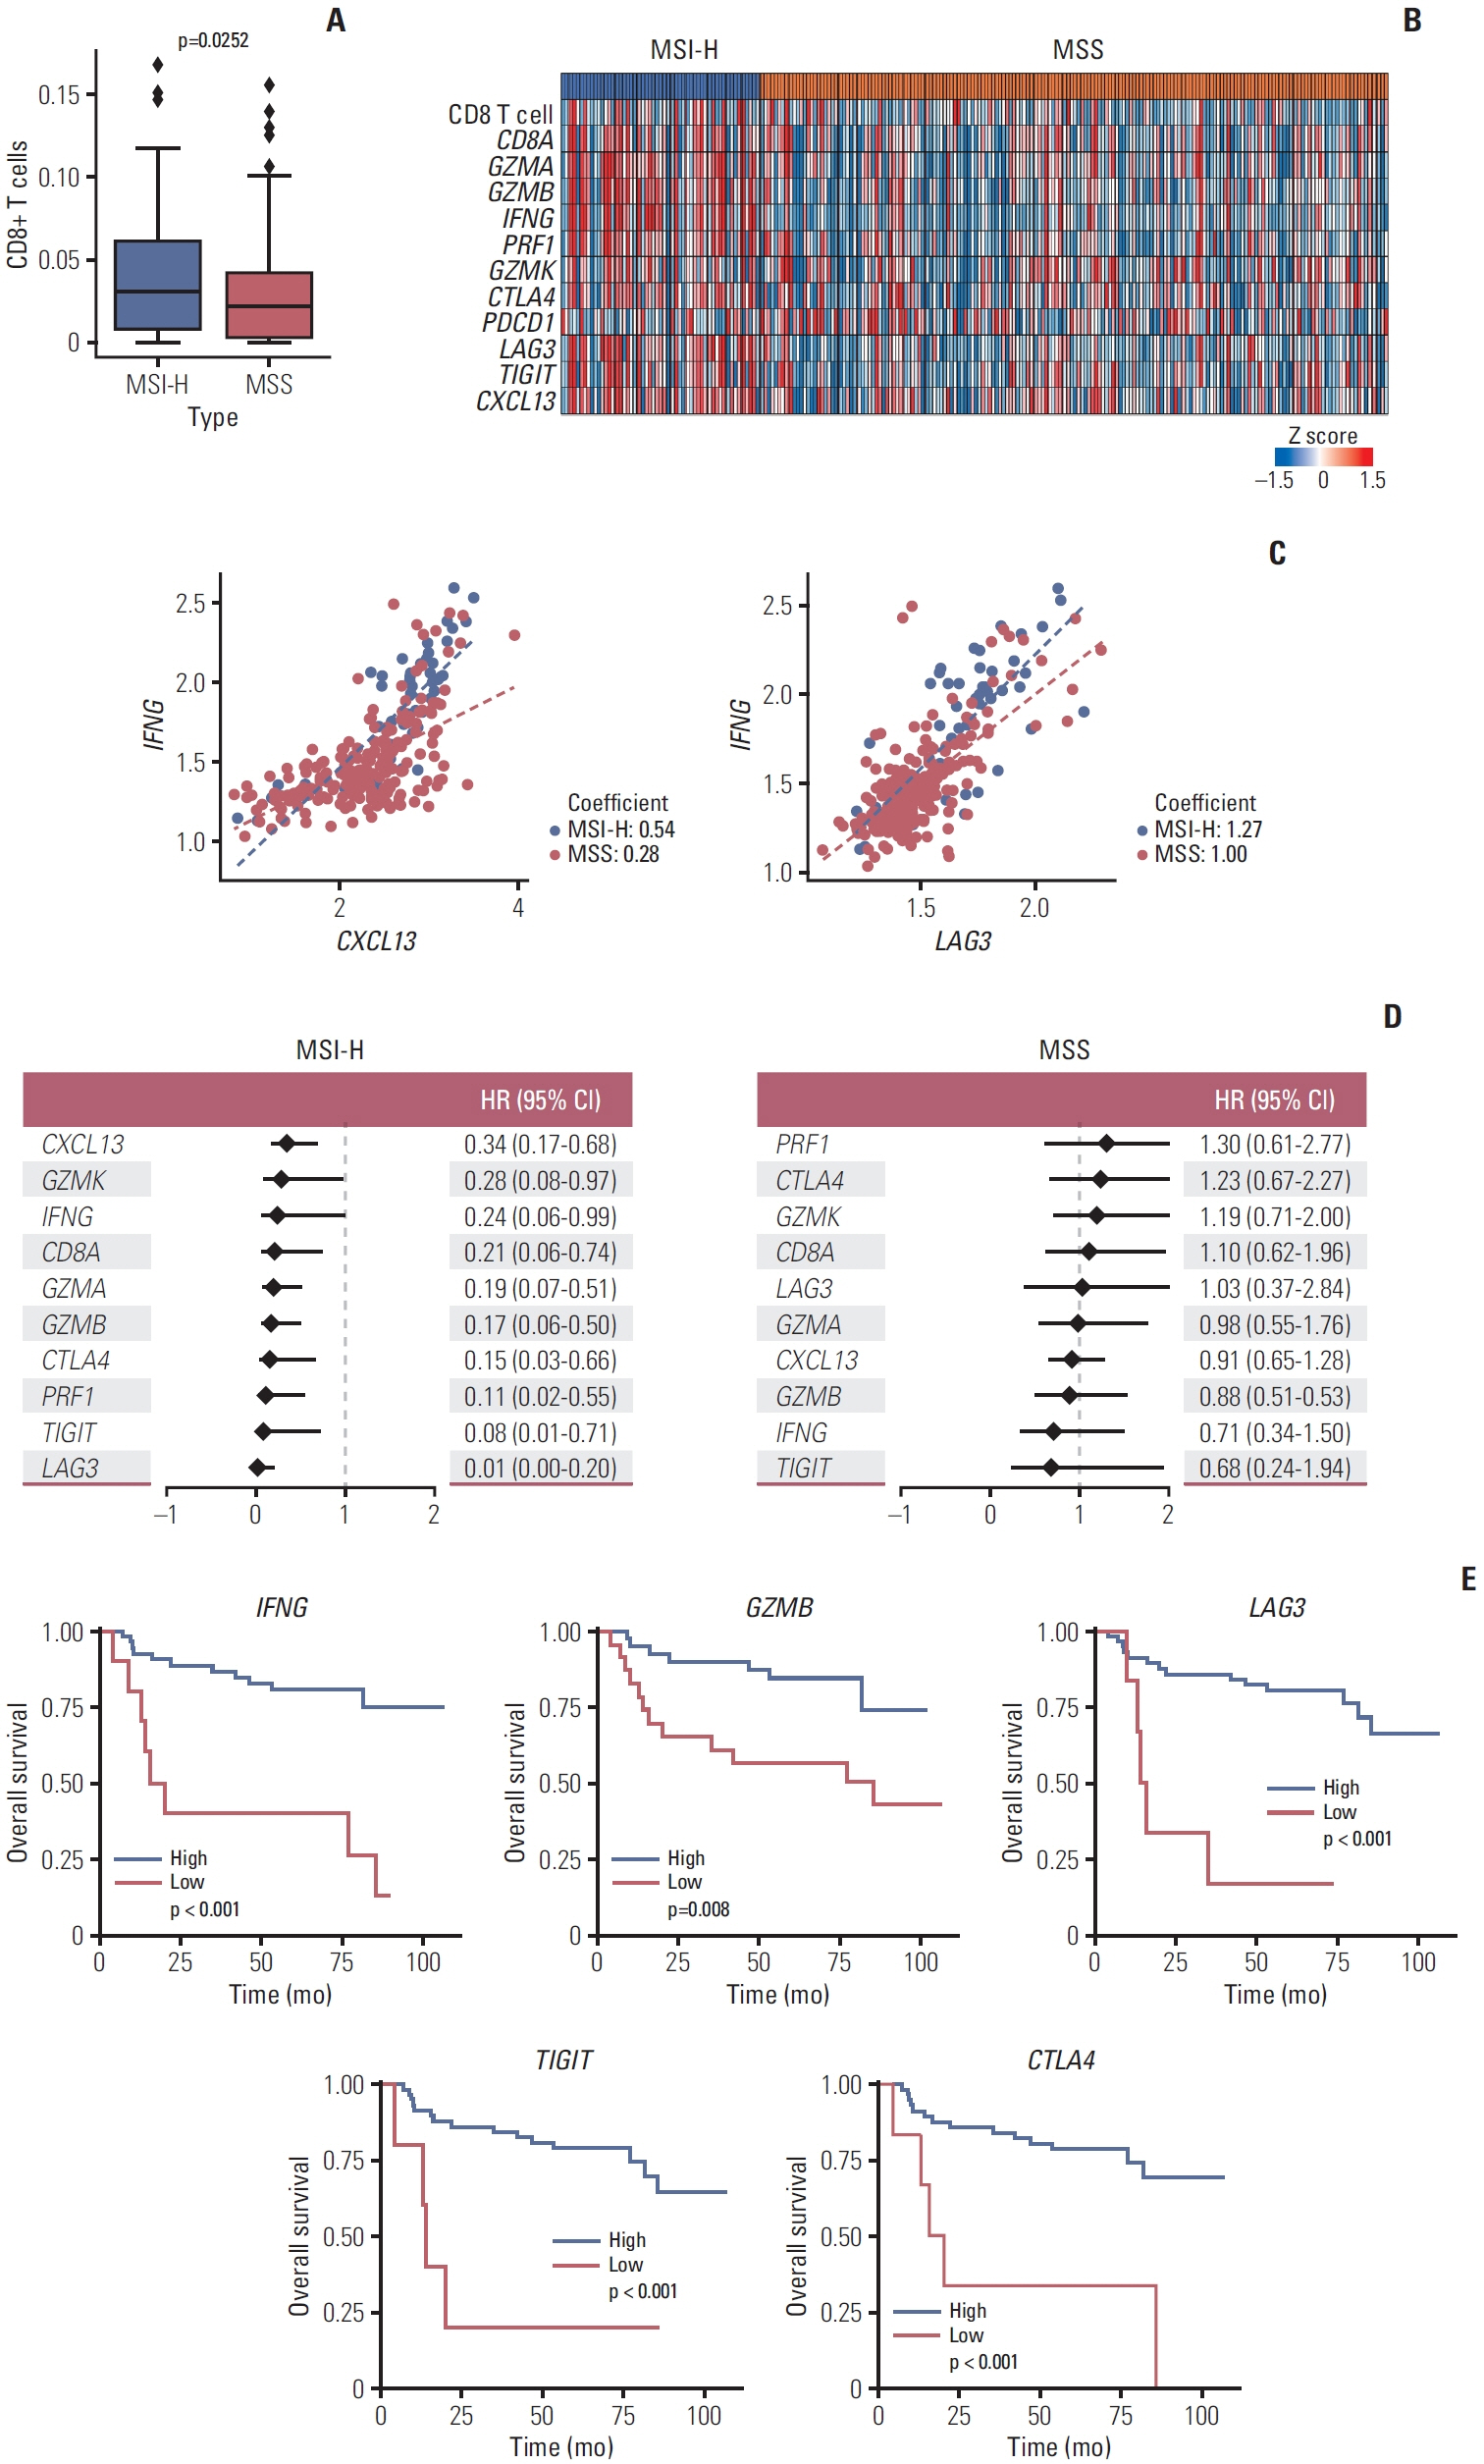
In MSI-H gastric cancer, significantly higher proportions of effector memory T cell (Tem), exhausted T cell (Tex), proliferative exhausted T cell (pTex), and proliferative T cell were observed, while MSS gastric cancer exhibited significantly higher proportions of mucosal-associated invariant T cell and natural killer T cell. In MSI-H gastric cancer, Tex and pTex exhibited a significant upregulation of the exhaustion marker LAG3, as well as elevated expression of effector function markers such as IFNG, GZMB, GZMH, and GZMK, compared to those in MSS gastric cancer. The interferon γ (IFN-γ) signaling pathway of Tex and pTex was retained compared to those of MSS gastric cancer. The spatial transcriptome analysis demonstrates the IFN-γ signaling pathway between neighboring Tex and malignant cell, showcasing a significantly elevated interaction in MSI-H gastric cancer.
Conclusion
Our study reveals novel finding indicating that IFN-γ signaling pathway is retained in Tex and pTex of MSI-H gastric cancer, offering a comprehensive perspective for future investigations into immunotherapy for gastric cancer.
Figure
Reference
-
References
1. Sung H, Ferlay J, Siegel RL, Laversanne M, Soerjomataram I, Jemal A, et al. Global cancer statistics 2020: GLOBOCAN estimates of incidence and mortality worldwide for 36 cancers in 185 countries. CA Cancer J Clin. 2021; 71:209–49.
Article2. Wadhwa R, Song S, Lee JS, Yao Y, Wei Q, Ajani JA. Gastric cancer-molecular and clinical dimensions. Nat Rev Clin Oncol. 2013; 10:643–55.
Article3. Cancer Genome Atlas Research Network. Comprehensive molecular characterization of gastric adenocarcinoma. Nature. 2014; 513:202–9.4. Pietrantonio F, Miceli R, Raimondi A, Kim YW, Kang WK, Langley RE, et al. Individual patient data meta-analysis of the value of microsatellite instability as a biomarker in gastric cancer. J Clin Oncol. 2019; 37:3392–400.
Article5. Choi YY, Kim H, Shin SJ, Kim HY, Lee J, Yang HK, et al. Microsatellite instability and programmed cell death-ligand 1 expression in stage II/III gastric cancer: post hoc analysis of the CLASSIC randomized controlled study. Ann Surg. 2019; 270:309–16.6. Liu Y, Sethi NS, Hinoue T, Schneider BG, Cherniack AD, Sanchez-Vega F, et al. Comparative molecular analysis of gastrointestinal adenocarcinomas. Cancer Cell. 2018; 33:721–35.7. Kono K, Nakajima S, Mimura K. Current status of immune checkpoint inhibitors for gastric cancer. Gastric Cancer. 2020; 23:565–78.
Article8. Janjigian YY, Shitara K, Moehler M, Garrido M, Salman P, Shen L, et al. First-line nivolumab plus chemotherapy versus chemotherapy alone for advanced gastric, gastro-oesophageal junction, and oesophageal adenocarcinoma (CheckMate 649): a randomised, open-label, phase 3 trial. Lancet. 2021; 398:27–40.
Article9. Shitara K, Van Cutsem E, Bang YJ, Fuchs C, Wyrwicz L, Lee KW, et al. Efficacy and safety of pembrolizumab or pembrolizumab plus chemotherapy vs chemotherapy alone for patients with first-line, advanced gastric cancer: The KEYNOTE-062 phase 3 randomized clinical trial. JAMA Oncol. 2020; 6:1571–80.
Article10. Kim ST, Cristescu R, Bass AJ, Kim KM, Odegaard JI, Kim K, et al. Comprehensive molecular characterization of clinical responses to PD-1 inhibition in metastatic gastric cancer. Nat Med. 2018; 24:1449–58.
Article11. Li Y, Hu X, Lin R, Zhou G, Zhao L, Zhao D, et al. Single-cell landscape reveals active cell subtypes and their interaction in the tumor microenvironment of gastric cancer. Theranostics. 2022; 12:3818–33.
Article12. Chen J, Liu K, Luo Y, Kang M, Wang J, Chen G, et al. Single-cell profiling of tumor immune microenvironment reveals immune irresponsiveness in gastric signet-ring cell carcinoma. Gastroenterology. 2023; 165:88–103.
Article13. Ahn S, Lee HS. Applicability of spatial technology in cancer research. Cancer Res Treat. 2024; 56:343–56.
Article14. Lee HS, Kim WH, Kwak Y, Koh J, Bae JM, Kim KM, et al. Molecular testing for gastrointestinal cancer. J Pathol Transl Med. 2017; 51:103–21.
Article15. Browaeys R, Saelens W, Saeys Y. NicheNet: modeling intercellular communication by linking ligands to target genes. Nat Methods. 2020; 17:159–62.
Article16. Jin S, Guerrero-Juarez CF, Zhang L, Chang I, Ramos R, Kuan CH, et al. Inference and analysis of cell-cell communication using CellChat. Nat Commun. 2021; 12:1088.
Article17. Newman AM, Steen CB, Liu CL, Gentles AJ, Chaudhuri AA, Scherer F, et al. Determining cell type abundance and expression from bulk tissues with digital cytometry. Nat Biotechnol. 2019; 37:773–82.
Article18. Cristescu R, Lee J, Nebozhyn M, Kim KM, Ting JC, Wong SS, et al. Molecular analysis of gastric cancer identifies subtypes associated with distinct clinical outcomes. Nat Med. 2015; 21:449–56.
Article19. Fuchs CS, Doi T, Jang RW, Muro K, Satoh T, Machado M, et al. Safety and efficacy of pembrolizumab monotherapy in patients with previously treated advanced gastric and gastroesophageal junction cancer: phase 2 clinical KEYNOTE-059 trial. JAMA Oncol. 2018; 4:e180013.20. Verdegaal EM, de Miranda NF, Visser M, Harryvan T, van Buuren MM, Andersen RS, et al. Neoantigen landscape dynamics during human melanoma-T cell interactions. Nature. 2016; 536:91–5.
Article21. Cheng D, Qiu K, Rao Y, Mao M, Li L, Wang Y, et al. Proliferative exhausted CD8(+) T cells exacerbate long-lasting antitumor effects in human papillomavirus-positive head and neck squamous cell carcinoma. Elife. 2023; 12:e82705.22. Mendoza JL, Escalante NK, Jude KM, Sotolongo Bellon J, Su L, Horton TM, et al. Structure of the IFNgamma receptor complex guides design of biased agonists. Nature. 2019; 567:56–60.
Article23. Tau GZ, Cowan SN, Weisburg J, Braunstein NS, Rothman PB. Regulation of IFN-gamma signaling is essential for the cytotoxic activity of CD8(+) T cells. J Immunol. 2001; 167:5574–82.24. Mojic M, Takeda K, Hayakawa Y. The dark side of IFN-gamma: its role in promoting cancer immunoevasion. Int J Mol Sci. 2017; 19:89.25. Patel SJ, Sanjana NE, Kishton RJ, Eidizadeh A, Vodnala SK, Cam M, et al. Identification of essential genes for cancer immunotherapy. Nature. 2017; 548:537–42.
Article26. Li J, Wu C, Hu H, Qin G, Wu X, Bai F, et al. Remodeling of the immune and stromal cell compartment by PD-1 blockade in mismatch repair-deficient colorectal cancer. Cancer Cell. 2023; 41:1152–69.
Article
- Full Text Links
- Actions
-
Cited
- CITED
-
- Close
- Share
- Similar articles
-
- Re-defining T-Cell Exhaustion: Subset, Function, and Regulation
- The Role of CD4 T Cell Help in CD8 T Cell Differentiation and Function During Chronic Infection and Cancer
- Single-Cell RNA Sequencing Shows T-Cell Exhaustion Landscape in the Peripheral Blood of Patients with Hepatitis B Virus-Associated Acute-on-Chronic Liver Failure
- CD43 Expression Regulated by IL-12 Signaling Is Associated with Survival of CD8 T Cells
- Mutation of the Chk1 Gene in Gastric Cancers with Microsatellite Instability

