Diabetes Metab J.
2024 Sep;48(5):901-914. 10.4093/dmj.2023.0368.
DGAT2 Plays a Crucial Role to Control ESRRAPROX1 Transcriptional Network to Maintain Hepatic Mitochondrial Sustainability
- Affiliations
-
- 1Graduate School of Medical Science, Brain Korea 21 Project, Yonsei University College of Medicine, Seoul, Korea
- 2Department of Biochemistry and Molecular Biology, Yonsei University College of Medicine, Seoul, Korea
- 3Chronic Intractable Disease for Systems Medicine Research Center, Yonsei University College of Medicine, Seoul, Korea
- 4Department of Biomedical Sciences, Gangnam Severance Hospital, Yonsei University College of Medicine, Seoul, Korea
- KMID: 2559000
- DOI: http://doi.org/10.4093/dmj.2023.0368
Abstract
- Background
Diacylglycerol O-acyltransferase 2 (DGAT2) synthesizes triacylglycerol (TG) from diacylglycerol; therefore, DGAT2 is considered as a therapeutic target for steatosis. However, the consequence of inhibiting DGAT2 is not fully investigated due to side effects including lethality and lipotoxicity. In this article, we observed the role of DGAT2 in hepatocarcinoma.
Methods
The role of DGAT2 is analyzed via loss-of-function assay. DGAT2 knockdown (KD) and inhibitor treatment on HepG2 cell line was analyzed. Cumulative analysis of cell metabolism with bioinformatic data were assessed, and further compared with different cohorts of liver cancer patients and non-alcoholic fatty liver disease (NAFLD) patients to elucidate how DGAT2 is regulating cancer metabolism.
Results
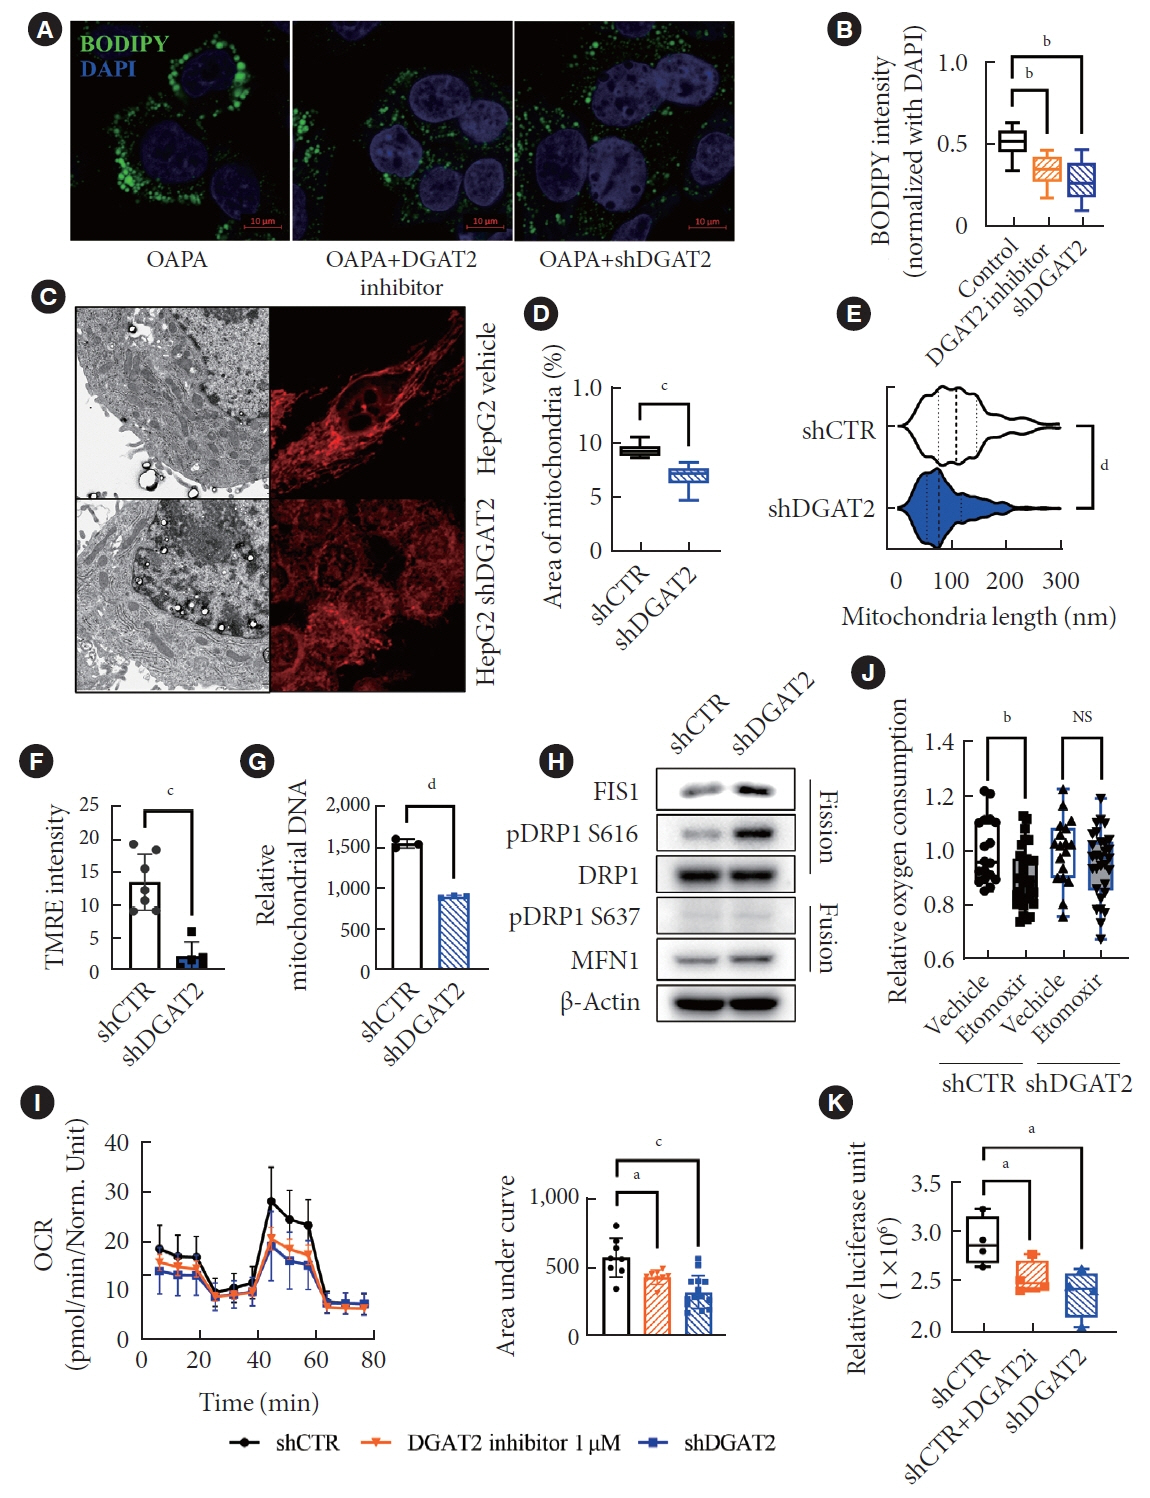
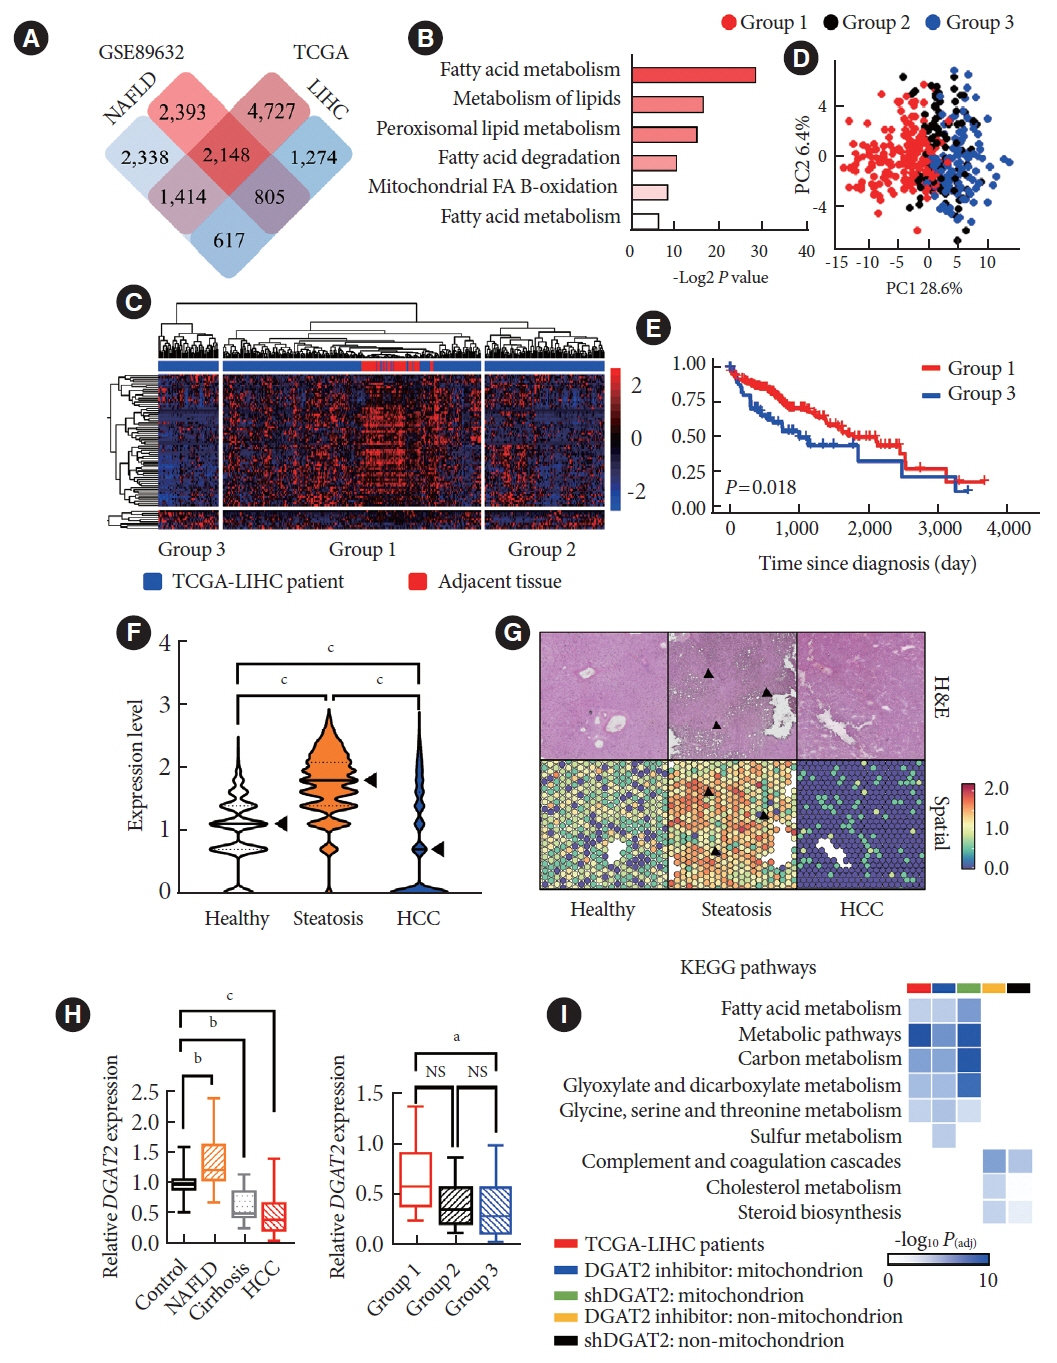
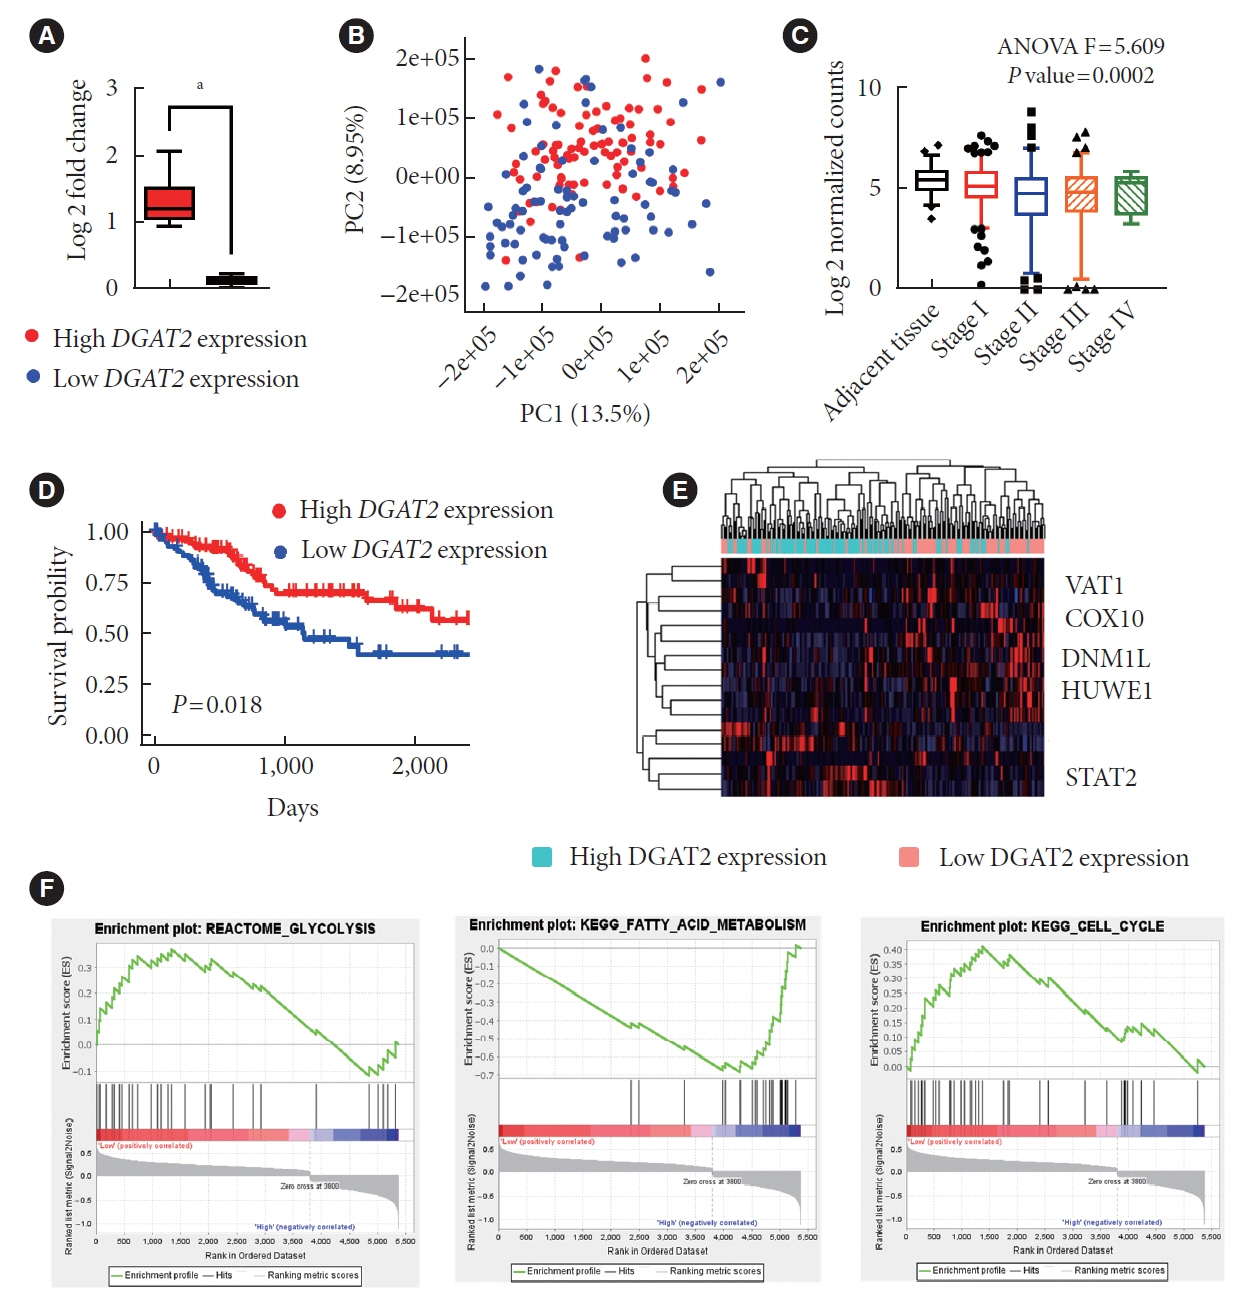
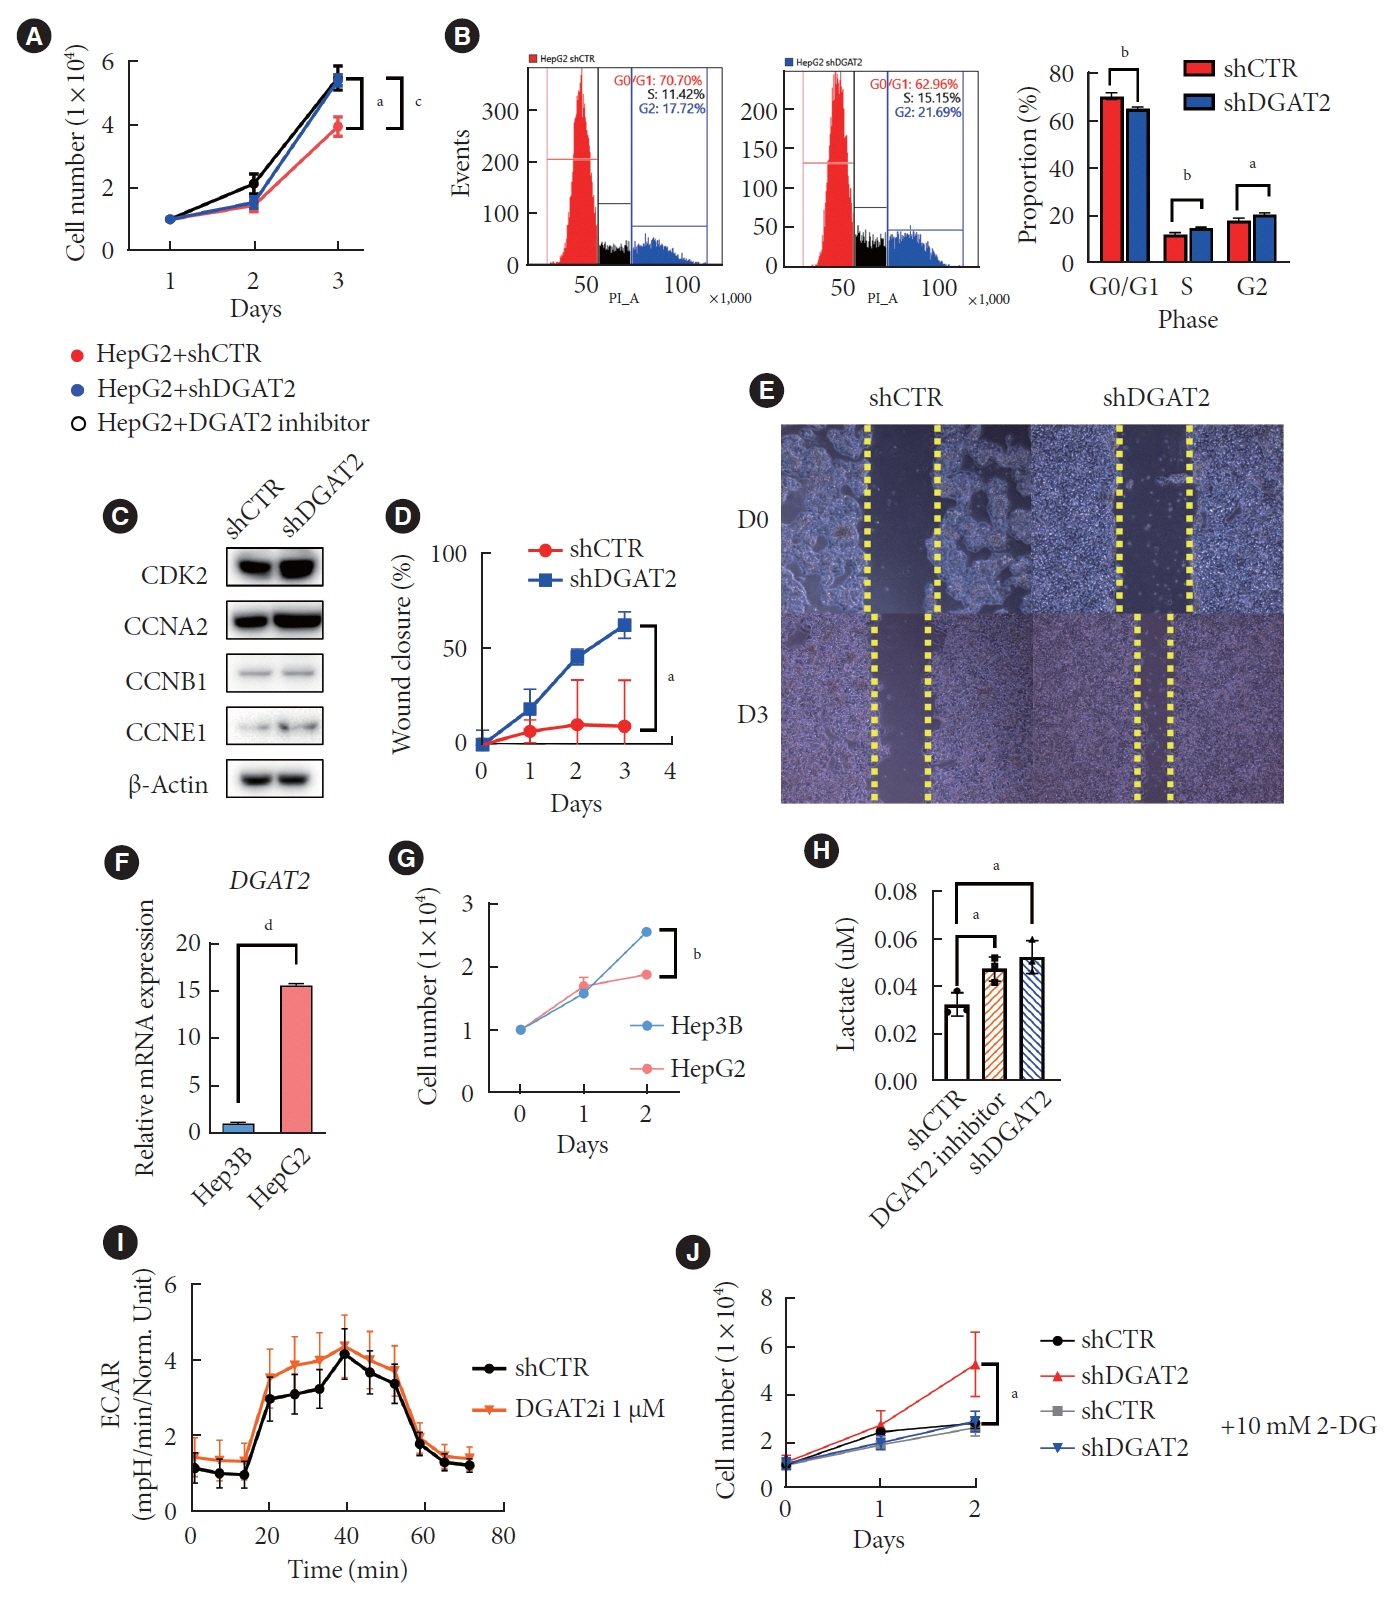
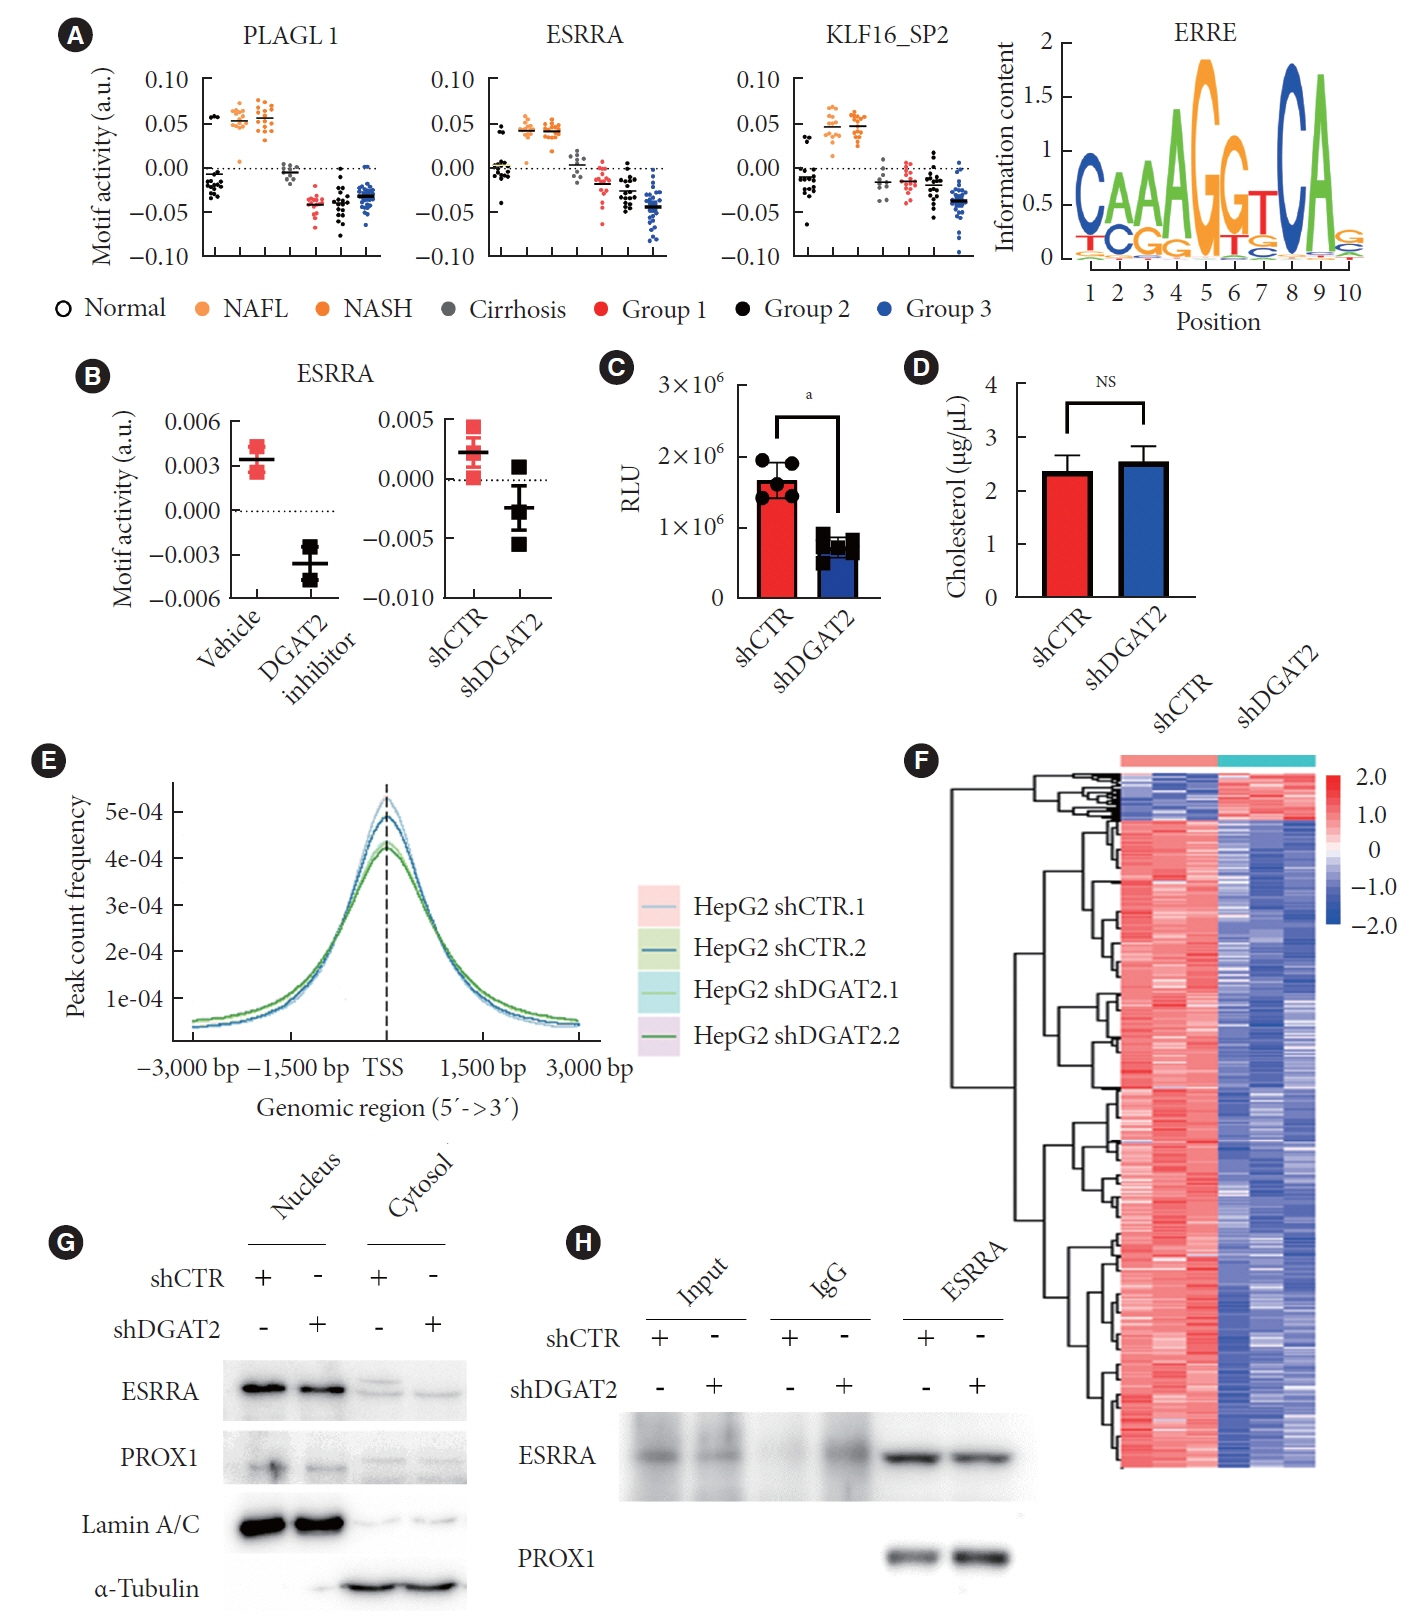
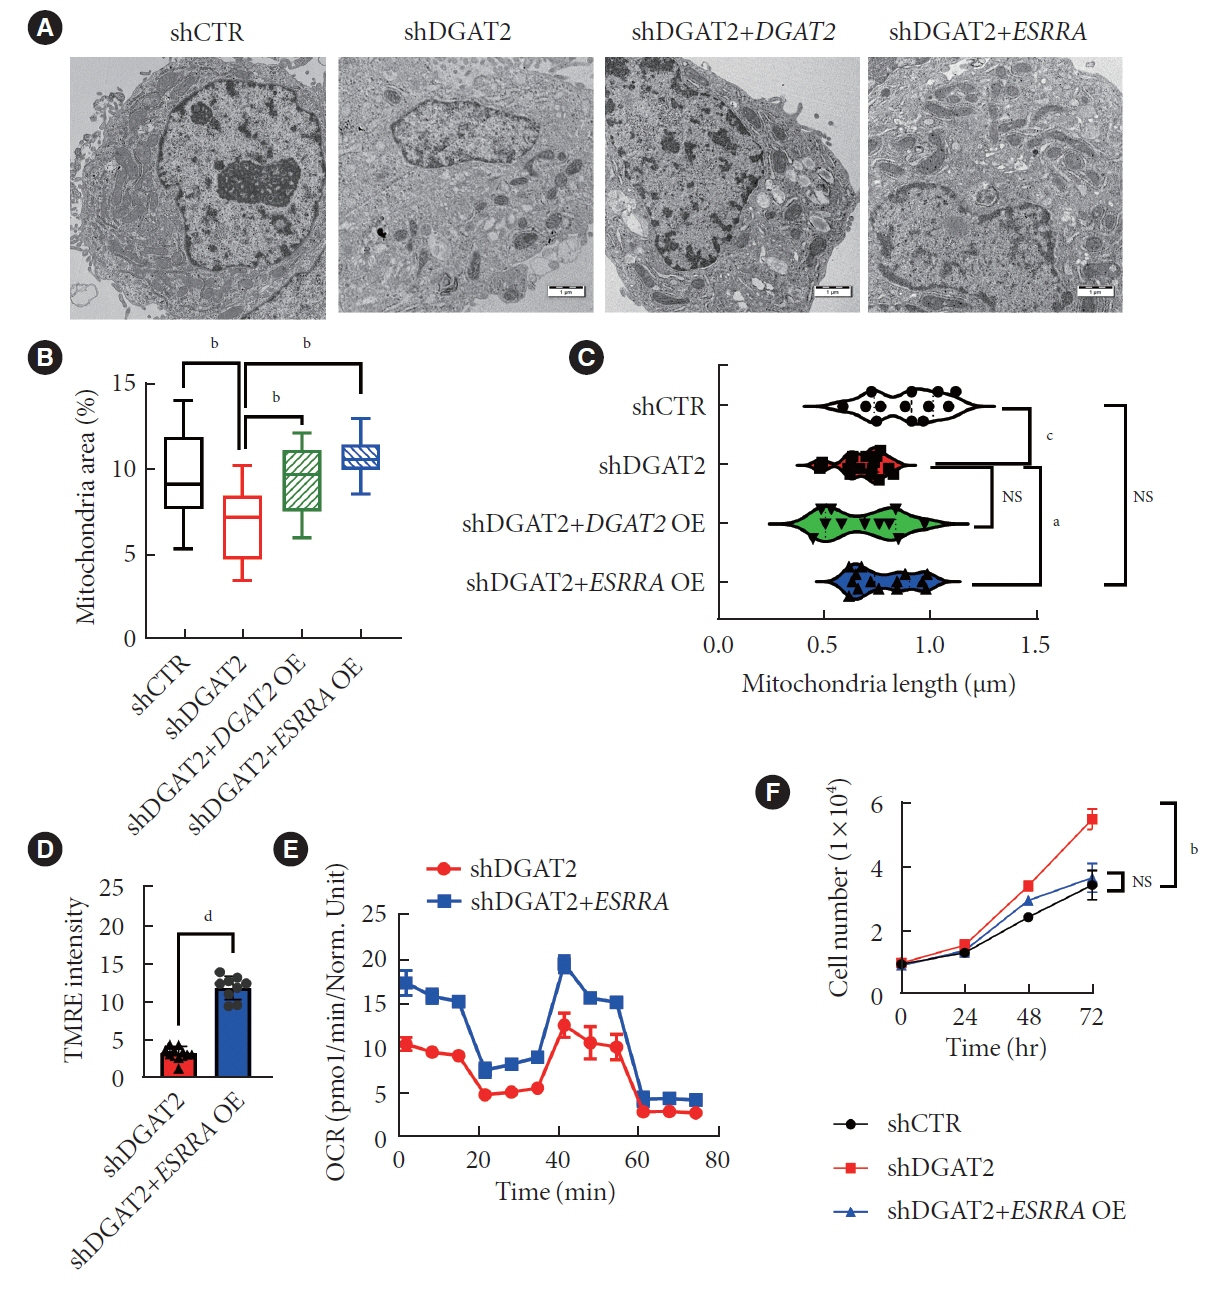
Mitochondrial function is suppressed in DGAT2 KD HepG2 cell along with the decreased lipid droplets. In the aspect of the cancer, DGAT2 KD upregulates cell proliferation. Analyzing transcriptome of NAFLD and hepatocellular carcinoma (HCC) patients highlights negatively correlating expression patterns of 73 lipid-associated genes including DGAT2. Cancer patients with the lower DGAT2 expression face lower survival rate. DGAT2 KD cell and patients’ transcriptome show downregulation in estrogen- related receptor alpha (ESRRA) via integrated system for motif activity response analysis (ISMARA), with increased dimerization with corepressor prospero homeobox 1 (PROX1).
Conclusion
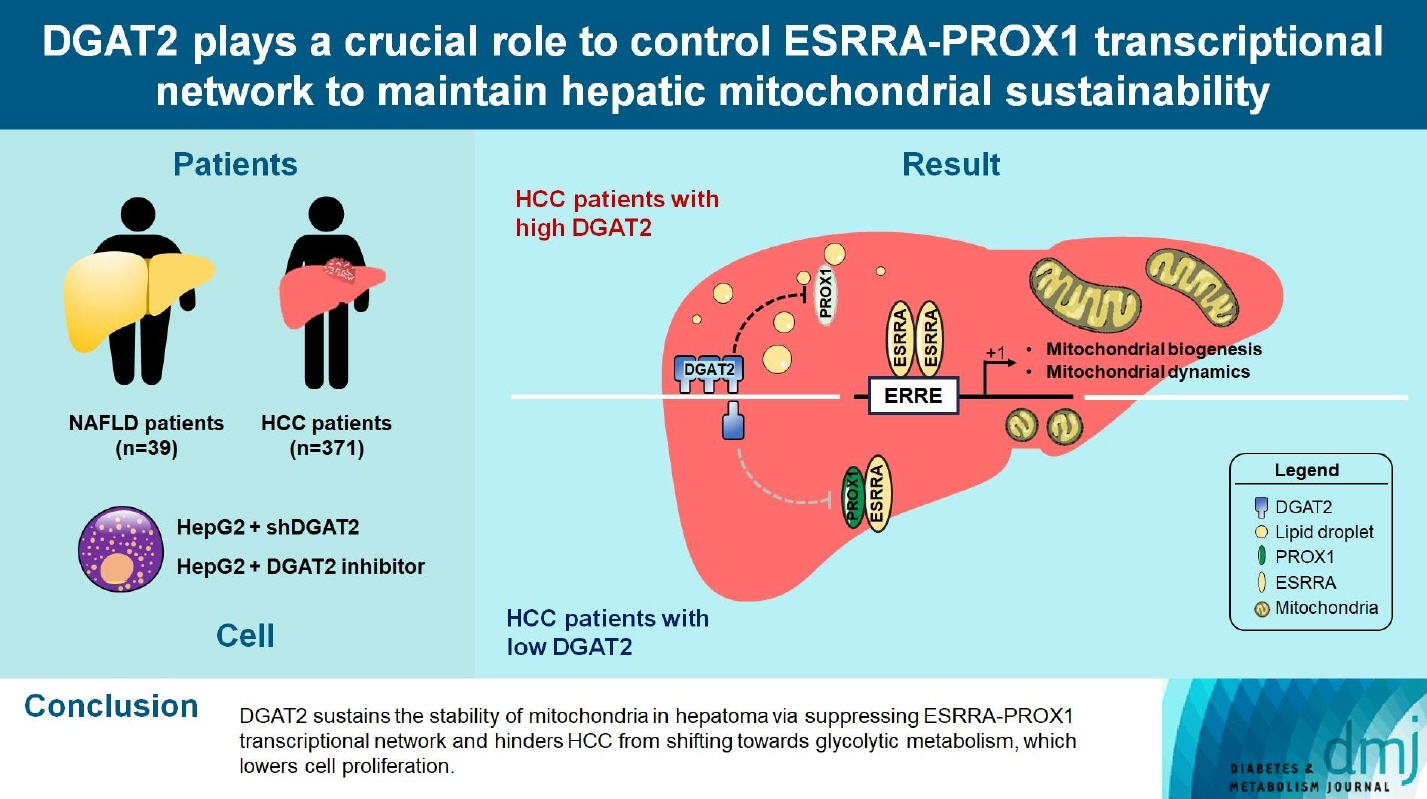
DGAT2 sustains the stability of mitochondria in hepatoma via suppressing ESRRA-PROX1 transcriptional network and hinders HCC from shifting towards glycolytic metabolism, which lowers cell proliferation.
Keyword
Figure
Reference
-
1. Jin Y, McFie PJ, Banman SL, Brandt C, Stone SJ. Diacylglycerol acyltransferase-2 (DGAT2) and monoacylglycerol acyltransferase-2 (MGAT2) interact to promote triacylglycerol synthesis. J Biol Chem. 2014; 289:28237–48.2. Yenilmez B, Wetoska N, Kelly M, Echeverria D, Min K, Lifshitz L, et al. An RNAi therapeutic targeting hepatic DGAT2 in a genetically obese mouse model of nonalcoholic steatohepatitis. Mol Ther. 2022; 30:1329–42.
Article3. Chitraju C, Walther TC, Farese RV Jr. The triglyceride synthesis enzymes DGAT1 and DGAT2 have distinct and overlapping functions in adipocytes. J Lipid Res. 2019; 60:1112–20.
Article4. Calle RA, Amin NB, Carvajal-Gonzalez S, Ross TT, Bergman A, Aggarwal S, et al. ACC inhibitor alone or co-administered with a DGAT2 inhibitor in patients with non-alcoholic fatty liver disease: two parallel, placebo-controlled, randomized phase 2a trials. Nat Med. 2021; 27:1836–48.
Article5. Singal AG, El-Serag HB. Rational HCC screening approaches for patients with NAFLD. J Hepatol. 2022; 76:195–201.
Article6. Rumgay H, Arnold M, Ferlay J, Lesi O, Cabasag CJ, Vignat J, et al. Global burden of primary liver cancer in 2020 and predictions to 2040. J Hepatol. 2022; 77:1598–606.
Article7. Nagaoki Y, Hyogo H, Ando Y, Kosaka Y, Uchikawa S, Nishida Y, et al. Increasing incidence of non-HBV- and non-HCV-related hepatocellular carcinoma: single-institution 20-year study. BMC Gastroenterol. 2021; 21:306.
Article8. Song K, Yang J, Lee HS, Kim SJ, Lee M, Suh J, et al. Changes in the prevalences of obesity, abdominal obesity, and non-alcoholic fatty liver disease among Korean children during the COVID-19 outbreak. Yonsei Med J. 2023; 64:269–77.
Article9. Loomba R, Lim JK, Patton H, El-Serag HB. AGA clinical practice update on screening and surveillance for hepatocellular carcinoma in patients with nonalcoholic fatty liver disease: expert review. Gastroenterology. 2020; 158:1822–30.
Article10. Luo X, Cheng C, Tan Z, Li N, Tang M, Yang L, et al. Emerging roles of lipid metabolism in cancer metastasis. Mol Cancer. 2017; 16:76.
Article11. Bae H, Lee SA, Choi JW, Hwang SH, Park S, Park MS. Effectiveness of hepatocellular carcinoma surveillance and an optimal surveillance interval: nationwide cohort of Korea. Yonsei Med J. 2021; 62:758–66.
Article12. Lee YG, Park DH, Chae YC. Role of mitochondrial stress response in cancer progression. Cells. 2022; 11:771.
Article13. Grasso D, Zampieri LX, Capeloa T, Van de Velde JA, Sonveaux P. Mitochondria in cancer. Cell Stress. 2020; 4:114–46.
Article14. Yambire KF, Fernandez-Mosquera L, Steinfeld R, Muhle C, Ikonen E, Milosevic I, et al. Mitochondrial biogenesis is transcriptionally repressed in lysosomal lipid storage diseases. Elife. 2019; 8:e39598.
Article15. Hanahan D. Hallmarks of cancer: new dimensions. Cancer Discov. 2022; 12:31–46.
Article16. Eynaudi A, Diaz-Castro F, Borquez JC, Bravo-Sagua R, Parra V, Troncoso R. Differential effects of oleic and palmitic acids on lipid droplet-mitochondria interaction in the hepatic cell line HepG2. Front Nutr. 2021; 8:775382.
Article17. Kuhlbrandt W. Structure and function of mitochondrial membrane protein complexes. BMC Biol. 2015; 13:89.
Article18. Futatsugi K, Kung DW, Orr ST, Cabral S, Hepworth D, Aspnes G, et al. Discovery and optimization of imidazopyridine-based inhibitors of diacylglycerol acyltransferase 2 (DGAT2). J Med Chem. 2015; 58:7173–85.
Article19. Xie L, Shi F, Li Y, Li W, Yu X, Zhao L, et al. Drp1-dependent remodeling of mitochondrial morphology triggered by EBVLMP1 increases cisplatin resistance. Signal Transduct Target Ther. 2020; 5:56.
Article20. Wu R, Guo W, Qiu X, Wang S, Sui C, Lian Q, et al. Comprehensive analysis of spatial architecture in primary liver cancer. Sci Adv. 2021; 7:eabg3750.
Article21. Habenicht LK, Wang Z, Zhang X, Li Y, Mogler C, Huspenina JS, et al. The C1q-ApoE complex: a new hallmark pathology of viral hepatitis and nonalcoholic fatty liver disease. Front Immunol. 2022; 13:970938.
Article22. Pelicano H, Martin DS, Xu RH, Huang P. Glycolysis inhibition for anticancer treatment. Oncogene. 2006; 25:4633–46.
Article23. Fox SN, McMeekin LJ, Savage CH, Joyce KL, Boas SM, Simmons MS, et al. Estrogen-related receptor gamma regulates mitochondrial and synaptic genes and modulates vulnerability to synucleinopathy. NPJ Parkinsons Dis. 2022; 8:106.
Article24. Hong EJ, Levasseur MP, Dufour CR, Perry MC, Giguere V. Loss of estrogen-related receptor α promotes hepatocarcinogenesis development via metabolic and inflammatory disturbances. Proc Natl Acad Sci USA. 2013; 110:17975–80.
Article25. Yi SW, Kim SH, Han KJ, Yi JJ, Ohrr H. Higher cholesterol levels, not statin use, are associated with a lower risk of hepatocellular carcinoma. Br J Cancer. 2020; 122:630–3.
Article26. Charest-Marcotte A, Dufour CR, Wilson BJ, Tremblay AM, Eichner LJ, Arlow DH, et al. The homeobox protein Prox1 is a negative modulator of ERR{alpha}/PGC-1{alpha} bioenergetic functions. Genes Dev. 2010; 24:537–42.27. Tang M, Yang M, Wu G, Mo S, Wu X, Zhang S, et al. Epigenetic induction of mitochondrial fission is required for maintenance of liver cancer-initiating cells. Cancer Res. 2021; 81:3835–48.
Article28. Lu M, van Tartwijk FW, Lin JQ, Nijenhuis W, Parutto P, Fantham M, et al. The structure and global distribution of the endoplasmic reticulum network are actively regulated by lysosomes. Sci Adv. 2020; 6:eabc7209.
Article29. Sunami Y. NASH, fibrosis and hepatocellular carcinoma: lipid synthesis and glutamine/acetate signaling. Int J Mol Sci. 2020; 21:6799.
Article30. Gluchowski NL, Gabriel KR, Chitraju C, Bronson RT, Mejhert N, Boland S, et al. Hepatocyte deletion of triglyceride-synthesis enzyme acyl CoA: diacylglycerol acyltransferase 2 reduces steatosis without increasing inflammation or fibrosis in mice. Hepatology. 2019; 70:1972–85.
Article31. Hong YB, Kang J, Kim JH, Lee J, Kwak G, Hyun YS, et al. DGAT2 mutation in a family with autosomal-dominant earlyonset axonal charcot-marie-tooth disease. Hum Mutat. 2016; 37:473–80.32. Cai J, Abramovici H, Gee SH, Topham MK. Diacylglycerol kinases as sources of phosphatidic acid. Biochim Biophys Acta. 2009; 1791:942–8.
Article33. Yang C, Kazanietz MG. Divergence and complexities in DAG signaling: looking beyond PKC. Trends Pharmacol Sci. 2003; 24:602–8.
Article34. Kolczynska K, Loza-Valdes A, Hawro I, Sumara G. Diacylglycerol-evoked activation of PKC and PKD isoforms in regulation of glucose and lipid metabolism: a review. Lipids Health Dis. 2020; 19:113.
Article35. Cooke M, Magimaidas A, Casado-Medrano V, Kazanietz MG. Protein kinase C in cancer: the top five unanswered questions. Mol Carcinog. 2017; 56:1531–42.
Article36. Lu N, Wang W, Liu J, Wong CW. Protein kinase C epsilon affects mitochondrial function through estrogen-related receptor alpha. Cell Signal. 2011; 23:1473–8.
Article37. Zheng Y, Chen Z, Han Y, Han L, Zou X, Zhou B, et al. Immune suppressive landscape in the human esophageal squamous cell carcinoma microenvironment. Nat Commun. 2020; 11:6268.
Article
- Full Text Links
- Actions
-
Cited
- CITED
-
- Close
- Share
- Similar articles
-
- Mitochondrial dysfunction in kidney injury, inflammation, and disease: potential therapeutic approaches
- Mitochondrial Quality Control: Its Role in Metabolic Dysfunction-Associated Steatotic Liver Disease (MASLD)
- Integrative Analysis of Microarray Data to Reveal Regulation Patterns in the Pathogenesis of Hepatocellular Carcinoma
- Endoplasmic Reticulum Stress Activates Hepatic Macrophages through PERK-hnRNPA1 Signaling
- Reduction of oocyte lipid droplets and meiotic failure due to biotin deficiency was not rescued by restoring the biotin nutritional status

