J Korean Med Sci.
2024 Jun;39(22):e176. 10.3346/jkms.2024.39.e176.
Fine-Scale Spatial Prediction on the Risk of Plasmodium vivax Infection in the Republic of Korea
- Affiliations
-
- 1College of Veterinary Medicine, Chungbuk National University, Cheongju, Korea
- 2Division of Infectious Diseases, Department of Internal Medicine, College of Medicine, Soonchunhyang University, Asan, Korea
- 3Division of Control for Zoonotic and Vector Borne Disease, Korea Disease Control and Prevention Agency, Cheongju, Korea
- 4Division of Infectious Disease, Department of Internal Medicine, Yonsei University College of Medicine, Seoul, Korea
- KMID: 2556296
- DOI: http://doi.org/10.3346/jkms.2024.39.e176
Abstract
- Background
Malaria elimination strategies in the Republic of Korea (ROK) have decreased malaria incidence but face challenges due to delayed case detection and response. To improve this, machine learning models for predicting malaria, focusing on high-risk areas, have been developed.
Methods
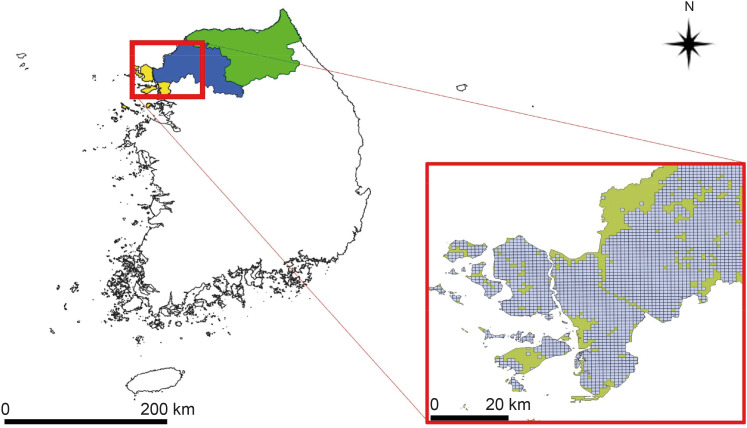
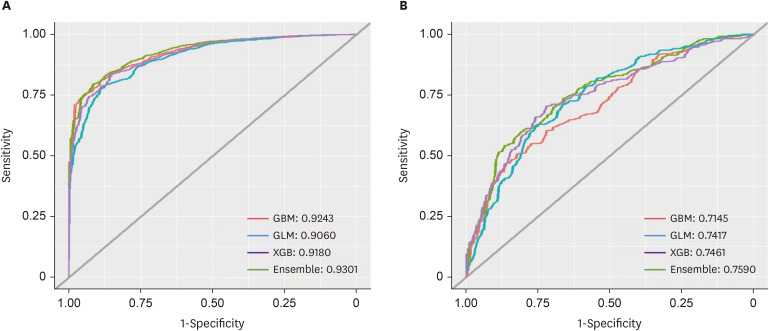
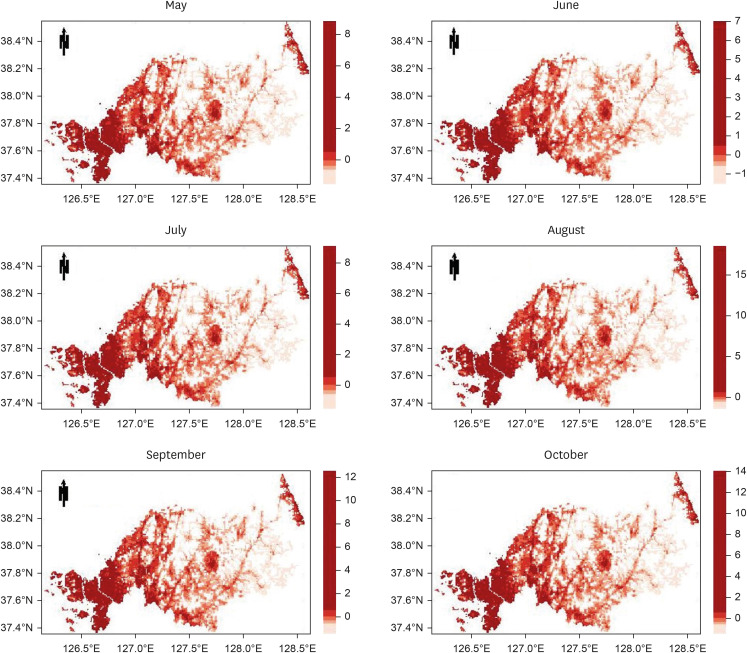
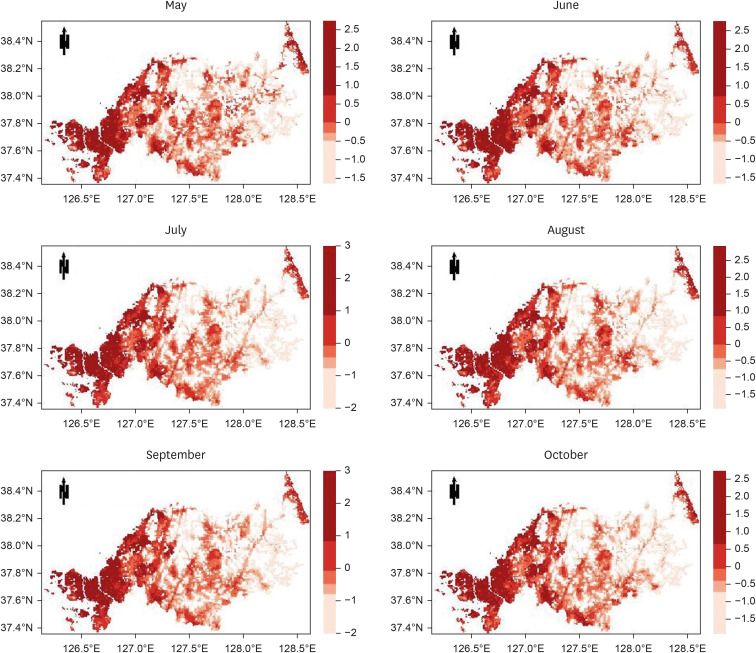
The study targeted the northern region of ROK, near the demilitarized zone, using a 1-km grid to identify areas for prediction. Grid cells without residential buildings were excluded, leaving 8,425 cells. The prediction was based on whether at least one malaria case was reported in each grid cell per month, using spatial data of patient locations. Four algorithms were used: gradient boosted (GBM), generalized linear (GLM), extreme gradient boosted (XGB), and ensemble models, incorporating environmental, sociodemographic, and meteorological data as predictors. The models were trained with data from May to October (2019–2021) and tested with data from May to October 2022. Model performance was evaluated using the area under the receiver operating characteristic curve (AUROC).
Results
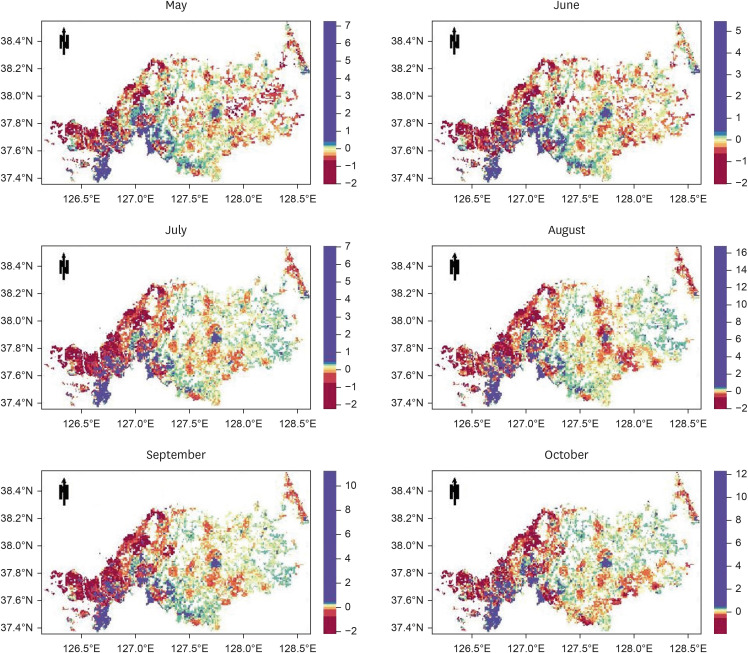
The AUROC of the prediction models performed excellently (GBM = 0.9243, GLM = 0.9060, XGB = 0.9180, and ensemble model = 0.9301). Previous malaria risk, population size, and meteorological factors influenced the model most in GBM and XGB.
Conclusion
Machine-learning models with properly preprocessed malaria case data can provide reliable predictions. Additional predictors, such as mosquito density, should be included in future studies to improve the performance of models.
Keyword
Figure
Reference
-
1. Im JH, Kim TS, Chung MH, Baek JH, Kwon HY, Lee JS. Current status and a perspective of mosquito-borne diseases in the Republic of Korea. Vector Borne Zoonotic Dis. 2021; 21(2):69–77. PMID: 33136531.2. Kim HC, Pacha LA, Lee WJ, Lee JK, Gaydos JC, Sames WJ, et al. Malaria in the Republic of Korea, 1993-2007. Variables related to re-emergence and persistence of Plasmodium vivax among Korean populations and U.S. forces in Korea. Mil Med. 2009; 174(7):762–769. PMID: 19685850.3. Chai JY. History and current status of malaria in Korea. Infect Chemother. 2020; 52(3):441–452. PMID: 32869559.4. Bahk YY, Cho SH, Kim KN, Shin EH, Jeon BH, Kim JH, et al. An epidemiological analysis of 28 vivax malaria cases in Gimpo-si, Korea, 2020. Korean J Parasitol. 2021; 59(5):507–512. PMID: 34724771.5. World Health Organization (WHO). Global Technical Strategy for Malaria, 2016–2030, 2021 Update. Geneva, Switzerland: WHO;2021.6. Fu C, Lopes S, Mellor S, Aryal S, Sovannaroth S, Roca-Feltrer A. Experiences from developing and upgrading a web-based surveillance system for malaria elimination in Cambodia. JMIR Public Health Surveill. 2017; 3(2):e30. PMID: 28615155.7. Saldanha R, Mosnier É, Barcellos C, Carbunar A, Charron C, Desconnets JC, et al. Contributing to elimination of cross-border malaria through a standardized solution for case surveillance, data sharing, and data interpretation: development of a cross-border monitoring system. JMIR Public Health Surveill. 2020; 6(3):e15409. PMID: 32663141.8. Kan H, Kwon J, Park S, Kim H, Park S. Characteristics of reported malaria cases, 2020. Public Health Wkly Rep. 2021; 14(17):1023–1035.9. Han B, Shin H, Lee H. Monitoring of malaria vector mosquitoes and Plasmodium vivax infection in the Republic of Korea, 2020. Public Health Wkly Rep. 2022; 15(17):1131–1141.10. Jeon B, Park K, Kwon J, Jo E. Epidemiological characteristics of malaria patients in 2018. Public Health Wkly Rep. 2019; 12(19):599–605.11. Ministry of the Interior and Safety (KR). Road name address. Updated 2022. Accessed March 20, 2022. https://www.juso.go.kr/openEngPage.do .12. Korea Disease Control and Prevention Agency (KDCA). Epidemiological Investigation of Malaria. Cheongju, Korea: KDCA;2023.13. Korea Meteorological Administration (KMA). KMA weather data service. Updated 2022. Accessed April 4, 2022. https://data.kma.go.kr/resources/html/en/aowdp.html .14. Banerjee S, Carlin BP, Gelfand AE. Hierarchical Modeling and Analysis for Spatial Data. Boca Raton, FL, USA: Chapman & Hall/CRC;2003.15. Ribeiro PJ Jr, Diggle PJ, Ribeiro MP Jr, Imports M. Package ‘geoR’. Vienna, Austria: R Foundation for Statistical Computing;2022.16. National Aeronautics and Space Administration (NASA). MODIS: Moderate Resolution Imaging Spectroradiometer. Updated 2022. Accessed April 15, 2022. https://modis.gsfc.nasa.gov/ .17. Busetto L, Ranghetti L. MODIStsp: an R package for automatic preprocessing of MODIS Land Products time series. Comput Geosci. 2016; 97:40–48.18. Hart T, Zandbergen P. Kernel density estimation and hotspot mapping: examining the influence of interpolation method, grid cell size, and bandwidth on crime forecasting. Policing. 2014; 37(2):305–323.19. Caha J. SpatialKDE: Kernel Density Estimation for Spatial Data (Version 0.8.2). Vienna, Austria: R Foundation for Statistical Computing;2022.20. Statistics Korea. SGIS: Statistical Geographic Information Service. Updated 2022. Accessed April 20, 2022. https://sgis.kostat.go.kr/jsp/english/index.jsp .21. National Aeronautics and Space Administration (NASA). Earth Observatory. Updated 2022. Accessed March 10, 2022. https://earthobservatory.nasa.gov/features/NightLights .22. Jarvis A, Reuter HI, Nelson A, Guevara E. Hole-filled SRTM for the globe Version 4. Updated 2008. Accessed December 18, 2019. https://cgiarcsi.community/data/srtm-90m-digital-elevation-database-v4-1/ .23. Hijmans RJ, Van Etten J, Cheng J, Mattiuzzi M, Sumner M, Greenberg JA, et al. Package ‘raster’. R Package. Vienna, Austria: R Foundation for Statistical Computing;2022.24. Elith J, Leathwick JR, Hastie T. A working guide to boosted regression trees. J Anim Ecol. 2008; 77(4):802–813. PMID: 18397250.25. Ridgeway G, Southworth MH, RUnit S. Package ‘gbm’. Vienna, Austria: R Foundation for Statistical Computing;2022.26. Li W, Yin Y, Quan X, Zhang H. Gene expression value prediction based on XGBoost algorithm. Front Genet. 2019; 10:1077. PMID: 31781160.27. Chen T, He T, Benesty M, Khotilovich V, Tang Y, Cho H, et al. Xgboost: Extreme Gradient Boosting. Vienna, Austria: R Foundation for Statistical Computing;2022.28. Rembold CM. Number needed to screen: development of a statistic for disease screening. BMJ. 1998; 317(7154):307–312. PMID: 9685274.29. Kim Y, Ratnam JV, Doi T, Morioka Y, Behera S, Tsuzuki A, et al. Malaria predictions based on seasonal climate forecasts in South Africa: a time series distributed lag nonlinear model. Sci Rep. 2019; 9(1):17882. PMID: 31784563.30. Nkiruka O, Prasad R, Clement O. Prediction of malaria incidence using climate variability and machine learning. Inform Med Unlocked. 2021; 22:100508.31. Wang M, Wang H, Wang J, Liu H, Lu R, Duan T, et al. A novel model for malaria prediction based on ensemble algorithms. PLoS One. 2019; 14(12):e0226910. PMID: 31877185.32. Cleary E, Hetzel MW, Siba PM, Lau CL, Clements AC. Spatial prediction of malaria prevalence in Papua New Guinea: a comparison of Bayesian decision network and multivariate regression modelling approaches for improved accuracy in prevalence prediction. Malar J. 2021; 20(1):269. PMID: 34120604.33. Haque U, Magalhães RJ, Reid HL, Clements AC, Ahmed SM, Islam A, et al. Spatial prediction of malaria prevalence in an endemic area of Bangladesh. Malar J. 2010; 9(1):120. PMID: 20459690.34. Zinszer K, Verma AD, Charland K, Brewer TF, Brownstein JS, Sun Z, et al. A scoping review of malaria forecasting: past work and future directions. BMJ Open. 2012; 2(6):e001992.35. Han ET, Lee DH, Park KD, Seok WS, Kim YS, Tsuboi T, et al. Reemerging vivax malaria: changing patterns of annual incidence and control programs in the Republic of Korea. Korean J Parasitol. 2006; 44(4):285–294. PMID: 17170570.36. Linthicum KJ, Anyamba A, Killenbeck B, Lee WJ, Lee HC, Klein TA, et al. Association of temperature and historical dynamics of malaria in the Republic of Korea, including reemergence in 1993. Mil Med. 2014; 179(7):806–814. PMID: 25003869.37. Kim YM, Park JW, Cheong HK. Estimated effect of climatic variables on the transmission of Plasmodium vivax malaria in the Republic of Korea. Environ Health Perspect. 2012; 120(9):1314–1319. PMID: 22711788.38. Ree HI. Studies on Anopheles sinensis, the vector species of vivax malaria in Korea. Korean J Parasitol. 2005; 43(3):75–92. PMID: 16192749.39. Donnelly B, Berrang-Ford L, Ross NA, Michel P. A systematic, realist review of zooprophylaxis for malaria control. Malar J. 2015; 14(1):313. PMID: 26264913.40. Foley DH, Klein TA, Kim HC, Brown T, Wilkerson RC, Rueda LM. Validation of ecological niche models for potential malaria vectors in the Republic of Korea. J Am Mosq Control Assoc. 2010; 26(2):210–213. PMID: 20649131.41. Janko MM, Irish SR, Reich BJ, Peterson M, Doctor SM, Mwandagalirwa MK, et al. The links between agriculture, Anopheles mosquitoes, and malaria risk in children younger than 5 years in the Democratic Republic of the Congo: a population-based, cross-sectional, spatial study. Lancet Planet Health. 2018; 2(2):e74–e82. PMID: 29457150.42. Shah HA, Carrasco LR, Hamlet A, Murray KA. Exploring agricultural land-use and childhood malaria associations in sub-Saharan Africa. Sci Rep. 2022; 12(1):4124. PMID: 35260722.
- Full Text Links
- Actions
-
Cited
- CITED
-
- Close
- Share
- Similar articles
-
- Multiple Cerebral Infarcts Following Acute Plasmodium vivax Infection
- A Case of Spontaneous Splenic Rupture in Vivax Malaria
- Cardiac Arrhythmia and Pericardial Effusion During Plasmodium vivax Infection
- A Case of Plasmodium vivax Malaria Associated with Autoimmune Hemolytic Anemia
- Plasmodium vivax Infection Accompanied by Acute Renal Failure

