Primary Hyperoxaluria Screening and Monitoring: Quantitative Measurement of Plasma Oxalate by Gas Chromatography-Mass Spectrometry With High Sensitivity
- Affiliations
-
- 1Department of Paediatric Laboratory Medicine, The Hospital for Sick Children, Toronto, Ontario, Canada
- 2Department of Laboratory Medicine and Pathobiology, University of Toronto, Toronto, Ontario, Canada
- KMID: 2555694
- DOI: http://doi.org/10.3343/alm.2023.0178
Abstract
- Background
Plasma oxalate measurements can be used for the screening and therapeutic monitoring of primary hyperoxaluria. We developed a gas chromatography-mass spectrometry (GC-MS) assay for plasma oxalate measurements with high sensitivity and suitable testing volumes for pediatric populations.
Methods
Plasma oxalate was extracted, derivatized, and analyzed by GC-MS. We measured the ion at m/z 261.10 to quantify oxalate and the 13 C 2-oxalate ion (m/z: 263.15) as the internal standard. Method validation included determination of the linear range, limit of blank, limit of detection, lower limit of quantification, precision, recovery, carryover, interference, and dilution effect. The cut-off value between primary and non-primary hyperoxaluria in a pediatric population was analyzed.
Results
The detection limit was 0.78 μmol/L, and the linear range was up to 80.0 μmol/L. The between-day precision was 5.7% at 41.3 μmol/L and 13.1% at 1.6 μmol/L. The carry-over was < 0.2%. The recovery rate ranged from 90% to 110%. Interference analysis showed that Hb did not interfere with plasma oxalate quantification, whereas intralipids and bilirubin caused false elevation of oxalate concentrations. A cut-off of 13.9 μmol/L showed 63% specificity and 77% sensitivity, whereas a cut-off of 4.15 μmol/L showed 100% specificity and 20% sensitivity. The minimum required sample volume was 250 μL. The detected oxalate concentrations showed interference from instrument conditioning, sample preparation procedures, medications, and various clinical conditions.
Conclusions
GC-MS is a sensitive assay for quantifying plasma oxalate and is suitable for pediatric patients. Plasma oxalate concentrations should be interpreted in a clinical context.
Keyword
Figure
-
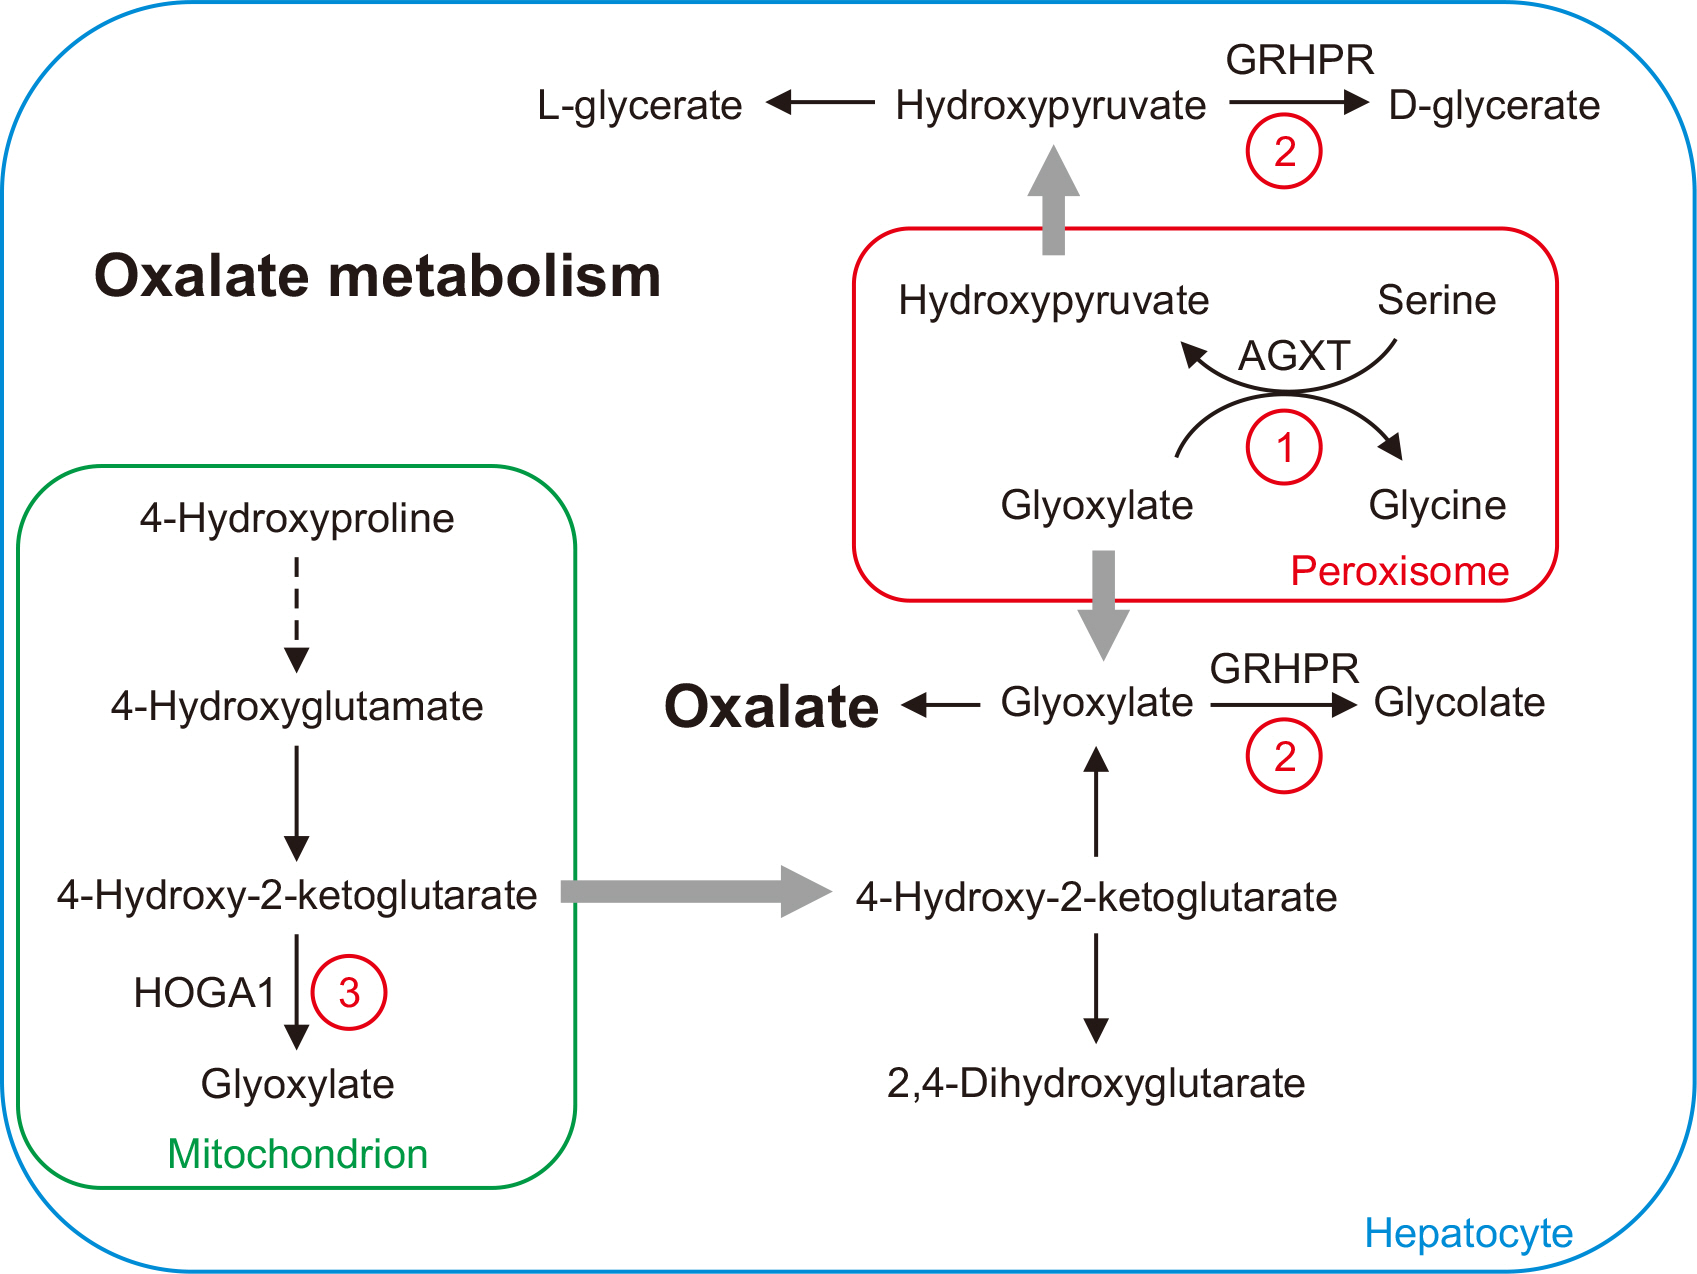
Fig. 1 Oxalate metabolism and primary hyperoxaluria. 1) Glyoxylate is converted to glycine by AGXT in peroxisomes. In hyperoxaluria type I, a defect in AGXT causes the accumulation of glyoxylate, which is converted to oxalate in the cytoplasm. 2) GRHPR catalyzes the conversions of glyoxylate to glycolate and hydroxypyruvate to D-glycerate in the cytoplasm. In hyperoxaluria type II, a defect in GRHPR leads to elevated oxalate and L-glycerate concentrations. 3) In hyperoxaluria type III, a defect in HOGA1 blocks the conversion of 4-hydroxy-2-ketoglutarate to glyoxylate in mitochondria. Excessive 4-hydroxy-2-ketoglutarate in the cytoplasm leads to elevated oxalate concentrations. Abbreviations: AGXT, alanine-glyoxylate aminotransferase; GRHPR, glyoxylate reductase/hydroxypyruvate reductase; HOGA1, 4-hydroxy-2-oxoglutarate aldolase 1.
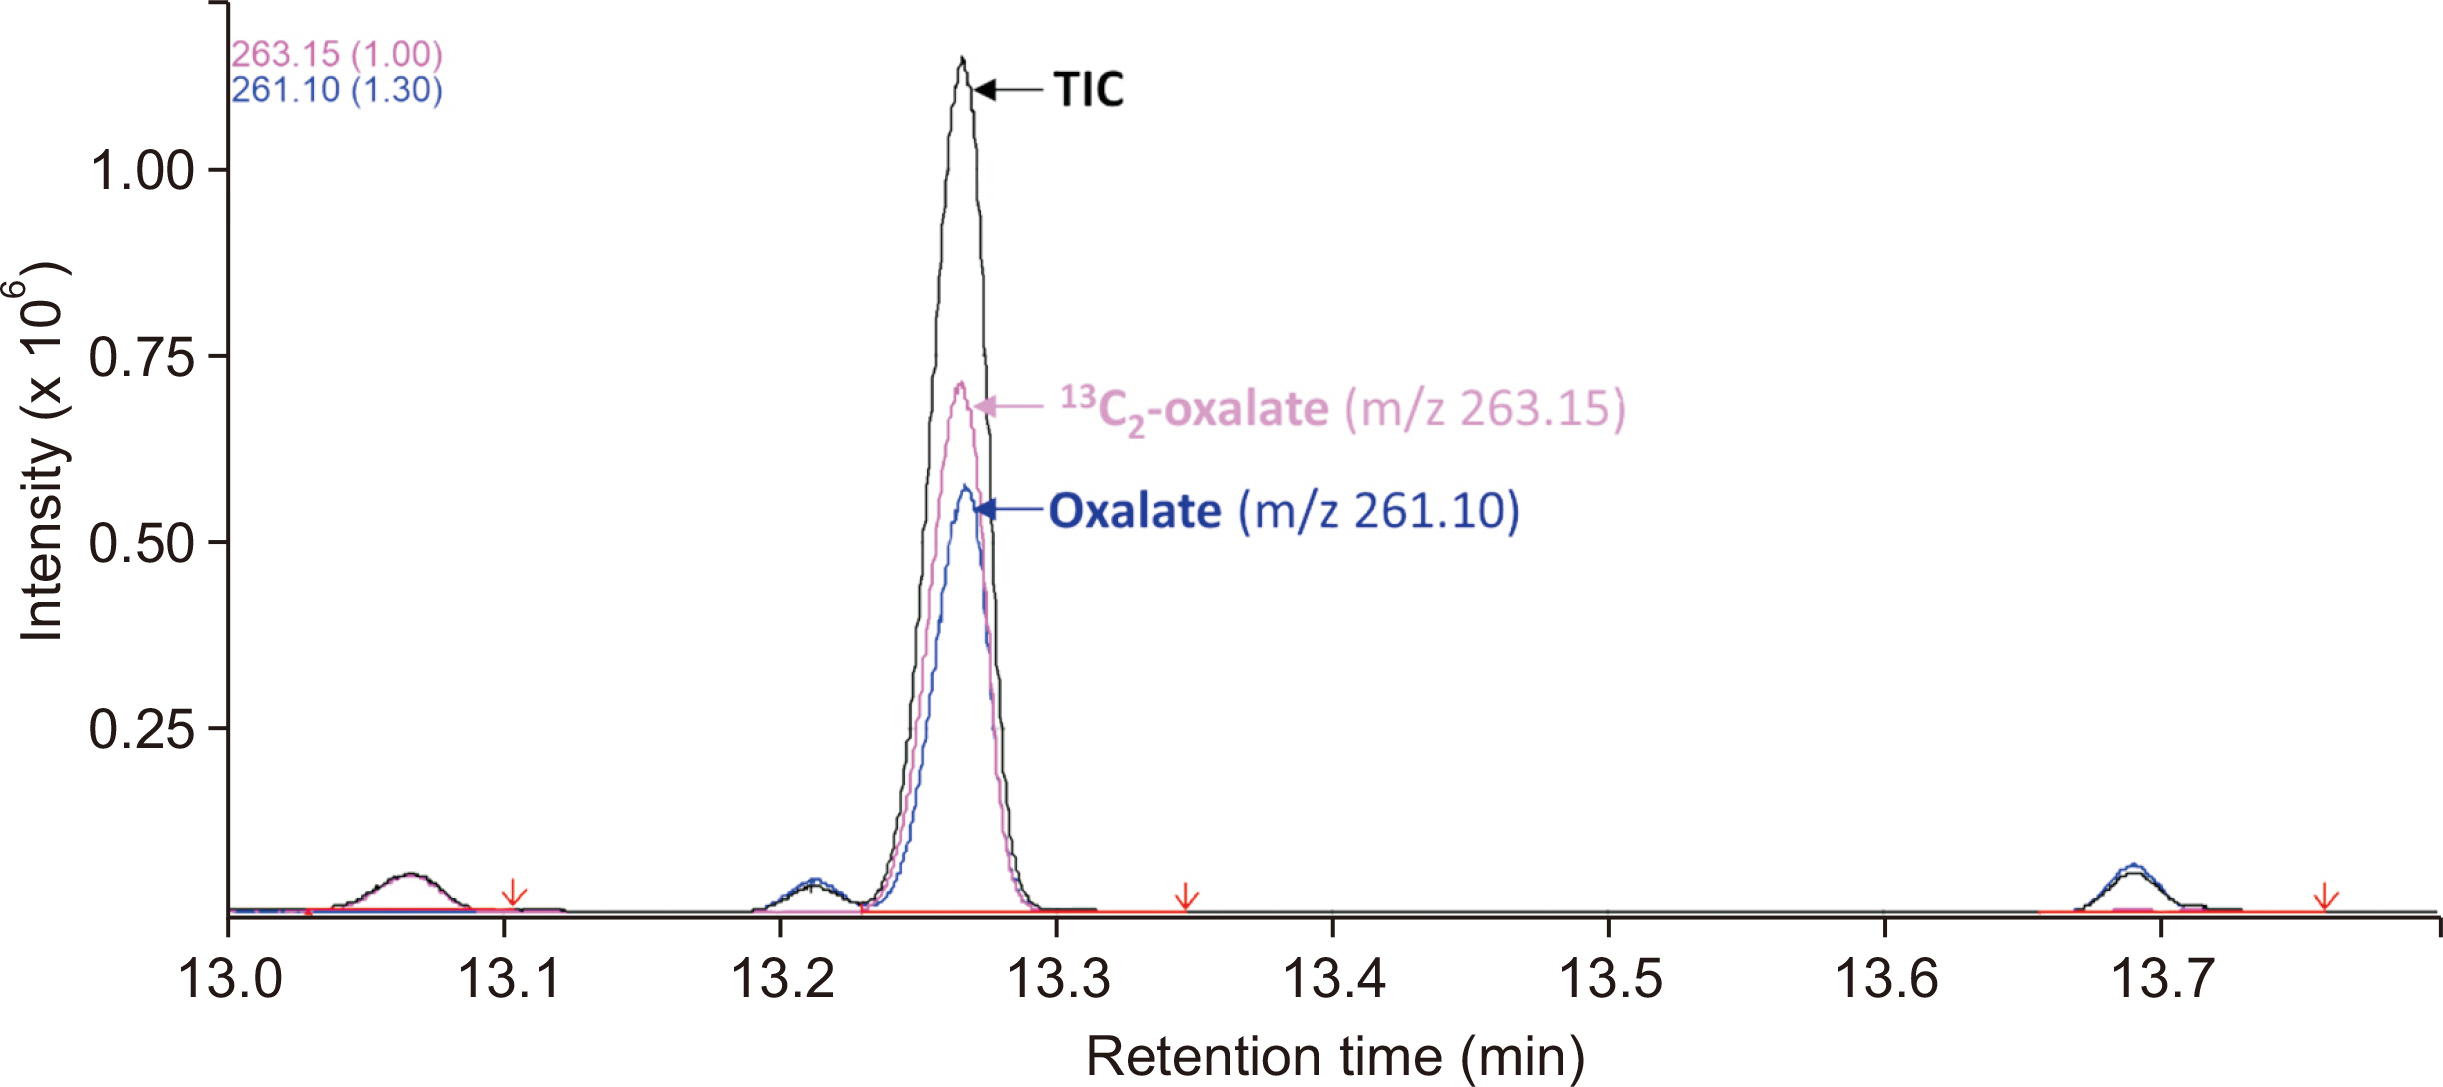
Fig. 2 GC-MS chromatograph of plasma oxalate. The peaks of oxalate (m/z 261.1) and 13C2-oxalate (m/z 263.15) elute at 13.26 mins. The oxalate peak is baseline-resolved from those of other, closely eluting molecules. No interference material co-elutes with oxalate. Abbreviations: GC-MS, gas chromatography-mass spectrometry; TIC, total ion chromatograph.
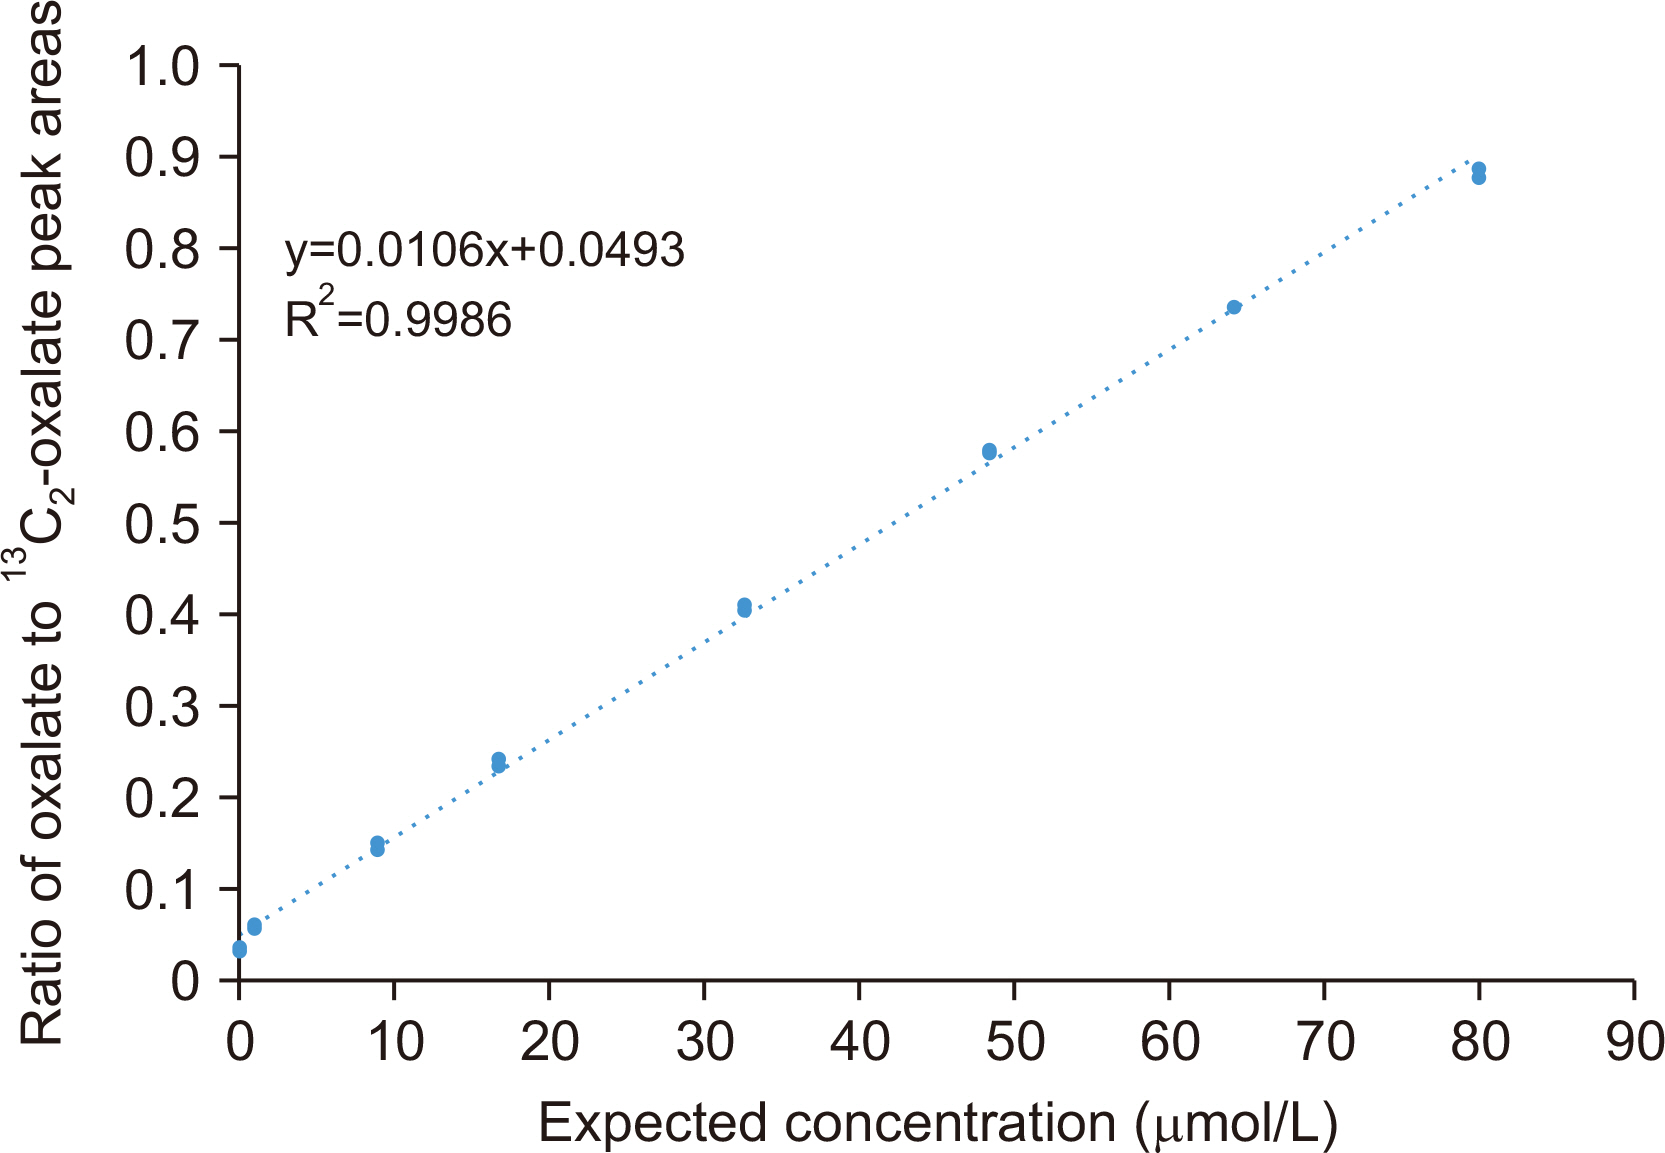
Fig. 3 Plasma oxalate linearity analysis. Linearity was assessed by analyzing eight calibrators with oxalate concentrations of 0.0, 1.0, 8.9, 16.8, 32.6, 48.4, 64.2, and 80.0 µmol/L. Each sample was run in triplicate. The ratio of the oxalate to 13C2-oxalate peak areas was calculated for each concentration to plot a linear regression line. The line was visually linear in the range of 0–80 µmol/L. The data points were close to the linear regression lines, with an R2 value of 0.9986.
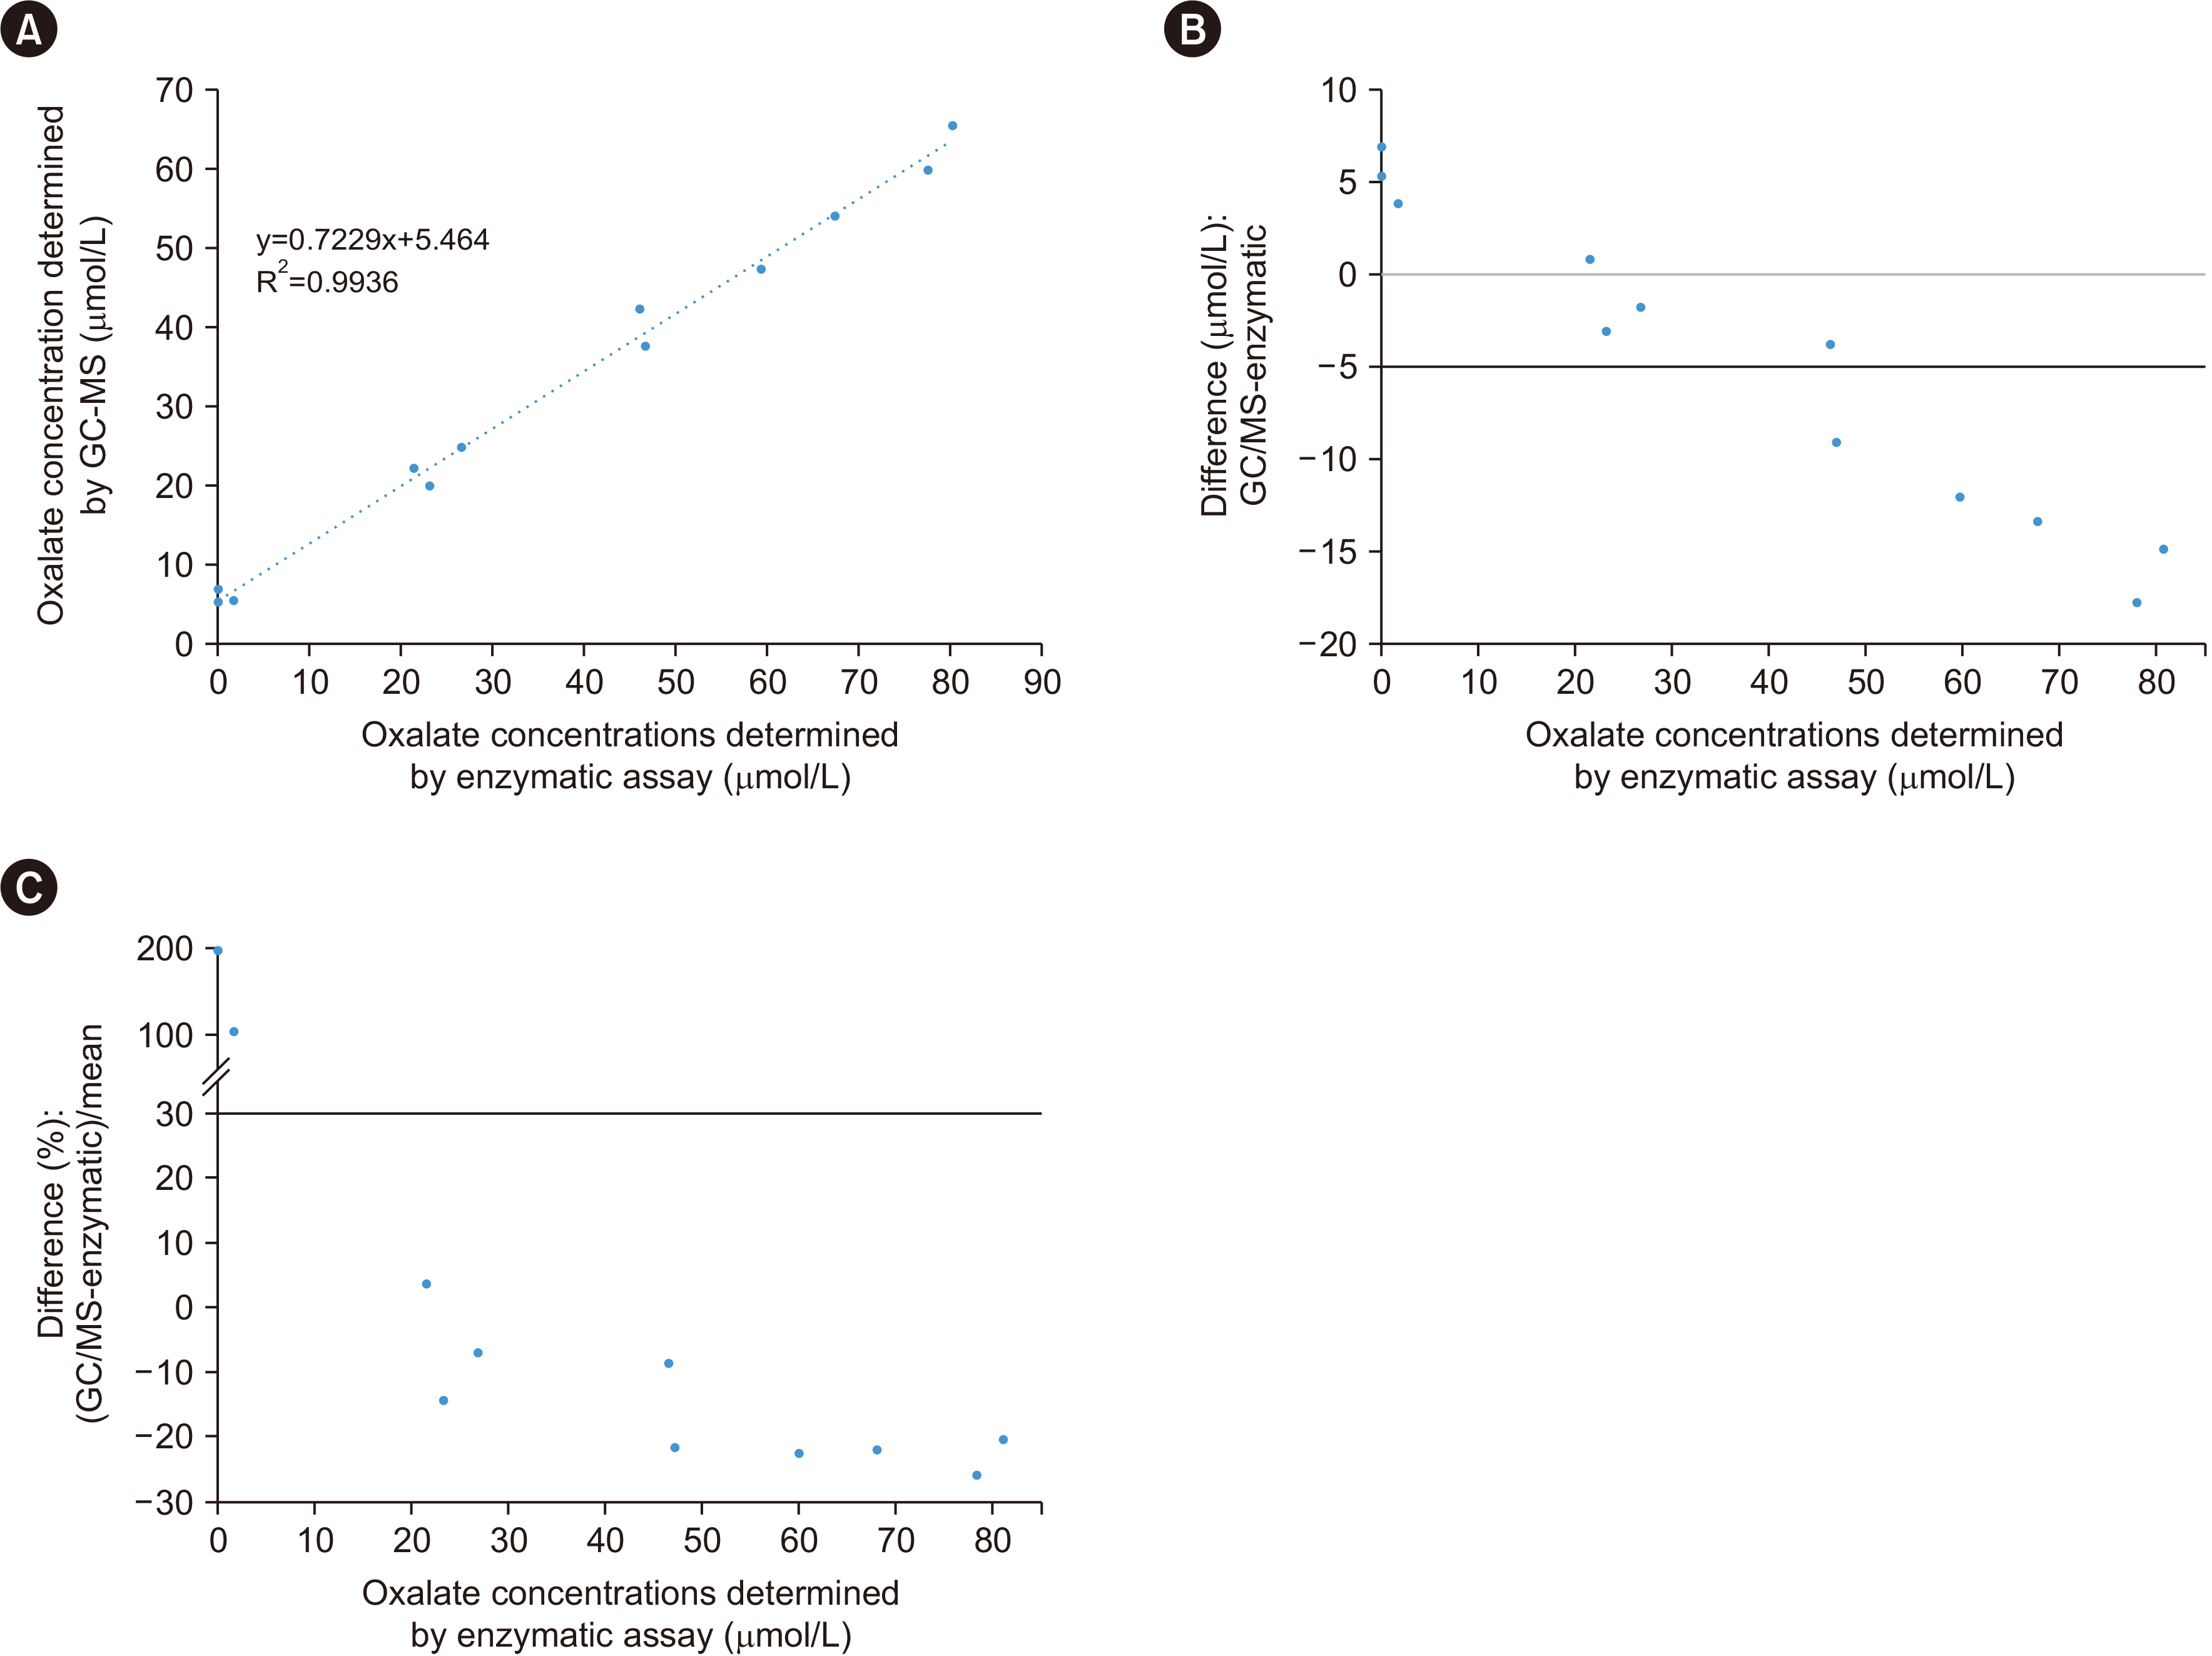
Fig. 4 Comparison between GC-MS and enzymatic methods. Method comparison was performed using 12 patient samples with oxalate concentrations between 0 and 80 μmol/L. (A) Linear regression analysis showed that the two sets of measurements were in a linear relationship, with an R2 value of 0.9936. (B) Absolute difference plot and (C) relative difference plot indicating that, for the three lowest concentrations, the enzymatic assay results were significantly lower than those from GC-MS. At concentrations >40 μmol/L, the enzymatic assay results were consistently higher than those from GC-MS, with an average difference of 20%. Abbreviation: GC-MS, gas chromatography-mass spectrometry.
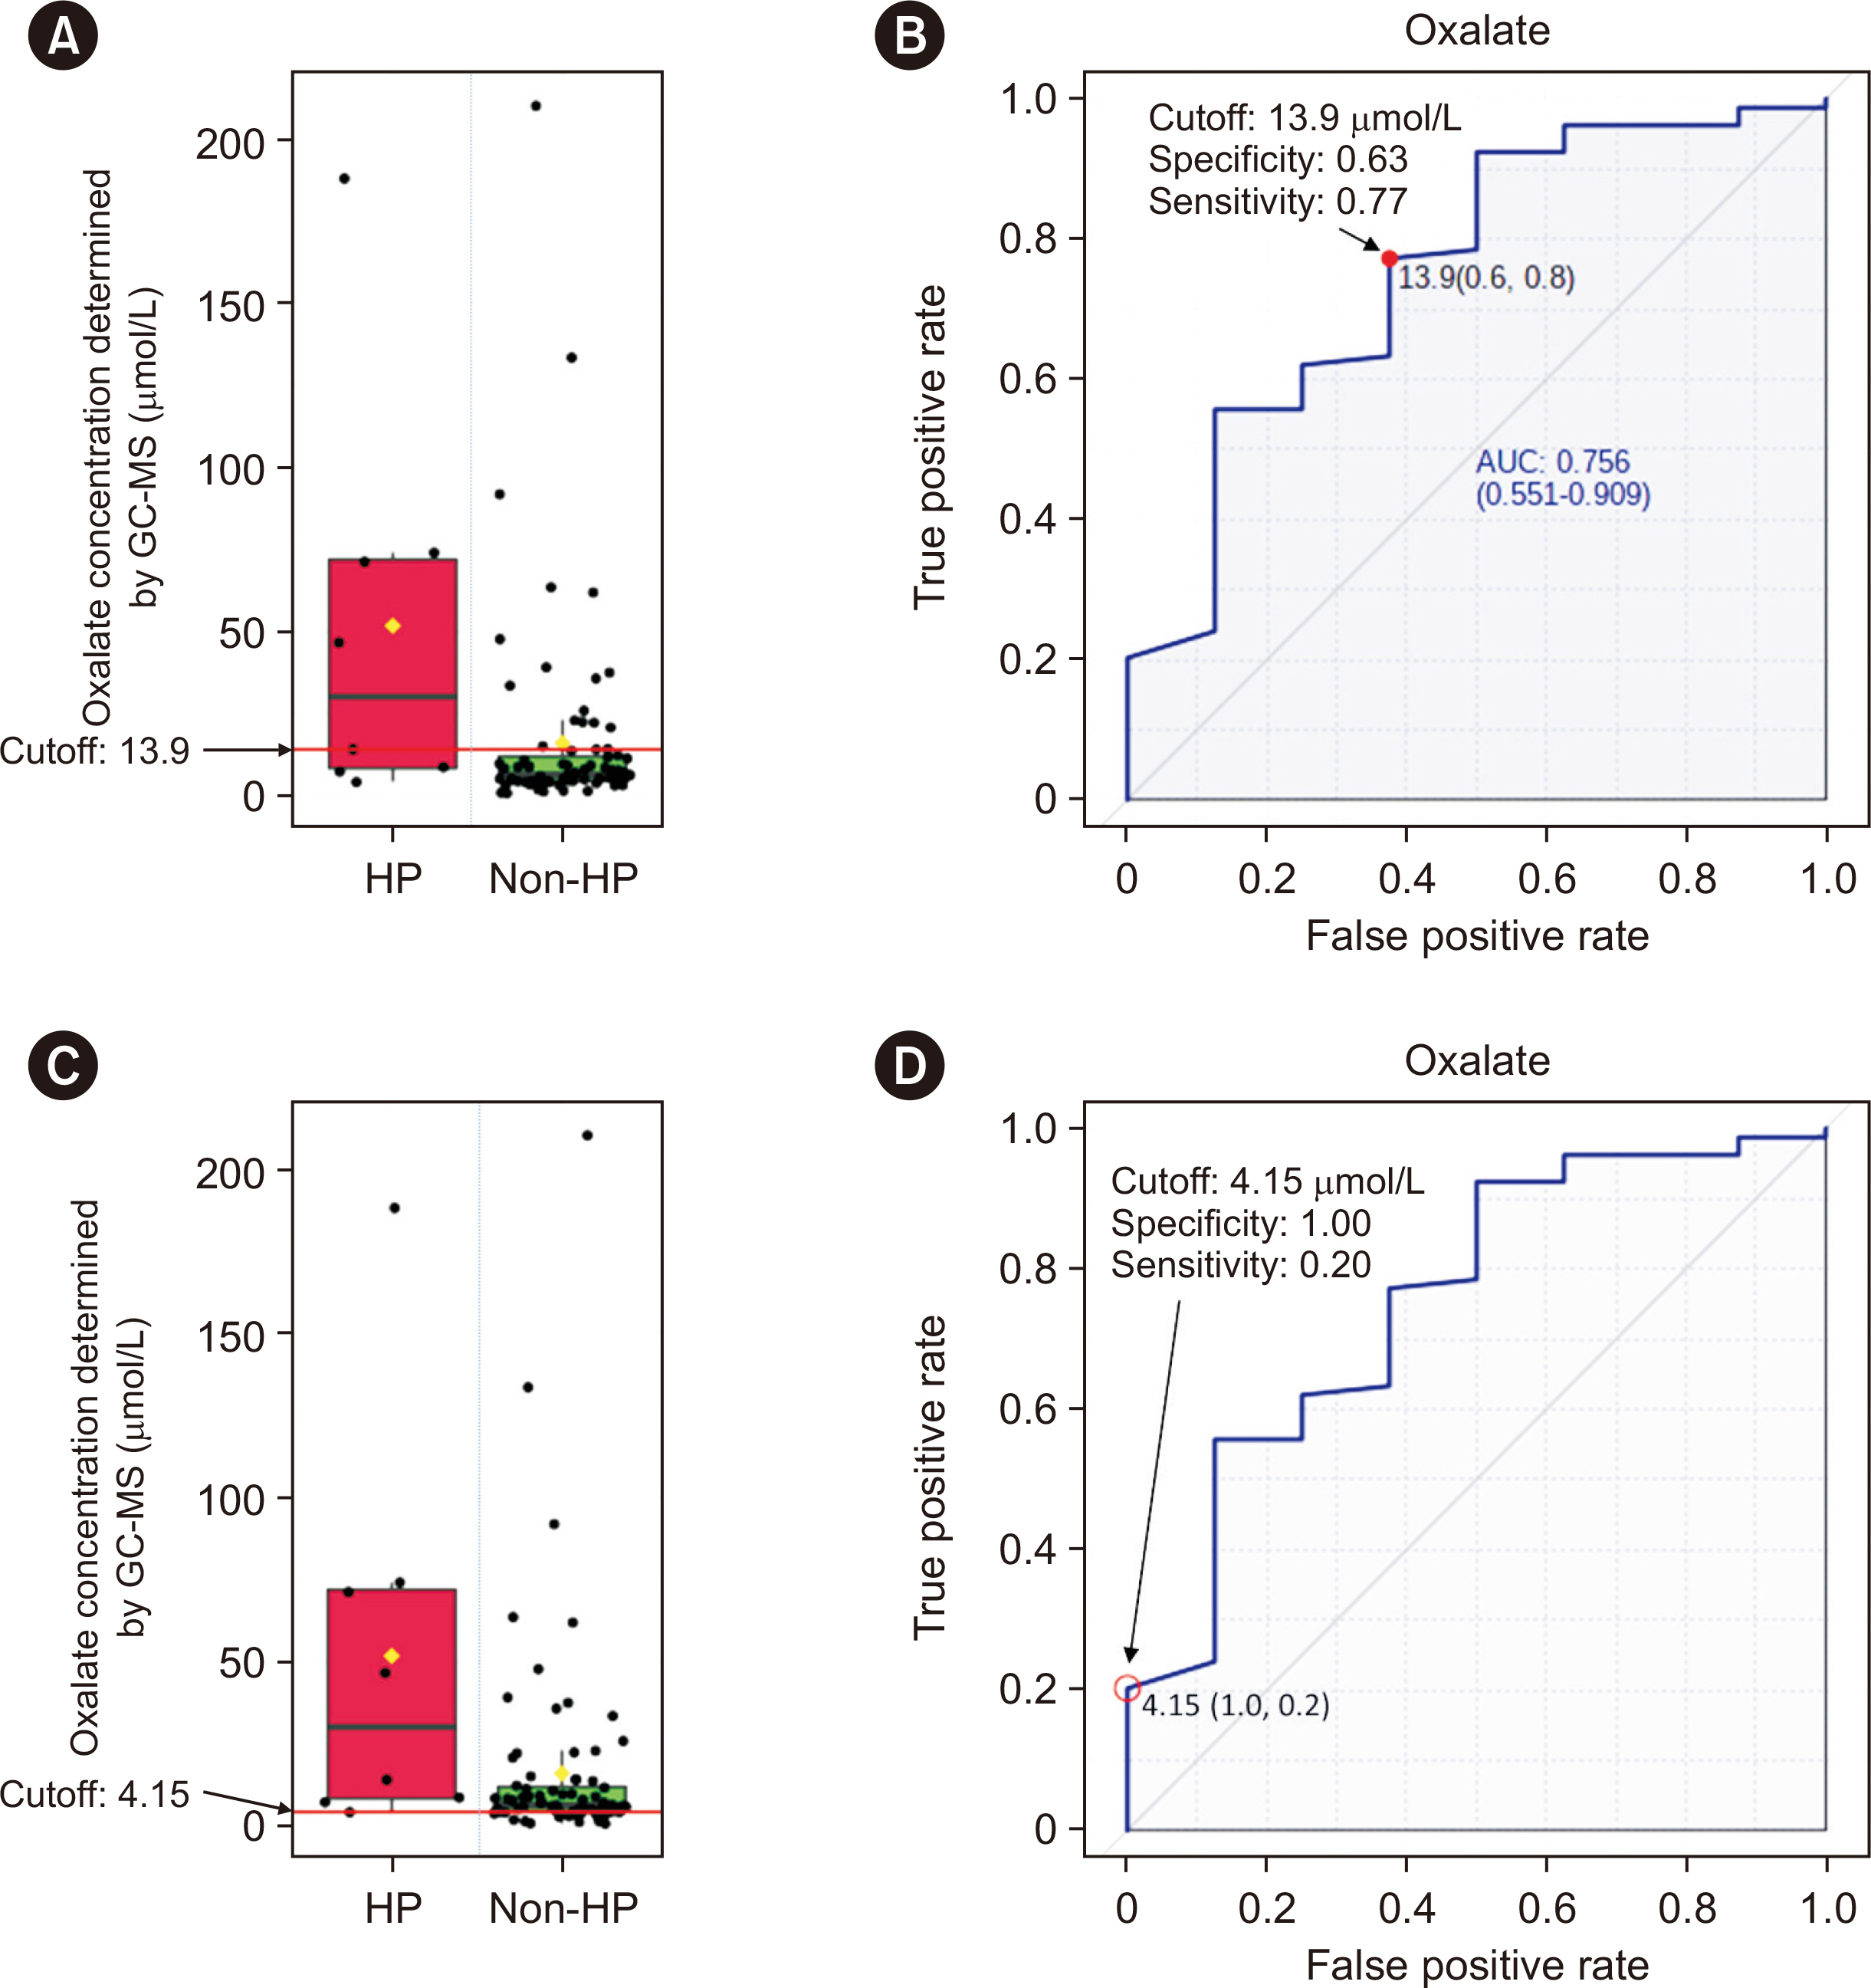
Fig. 5 Plasma oxalate cut-offs for HP. (A) Boxplot of plasma oxalate concentrations in primary HP (red box) and non-primary HP conditions (green box). The cut-off of 13.9 μmol/L is indicated by the red line. (B) ROC curve, AUC value, specificity, and sensitivity for the cut-off of 13.9 μmol/L. (C) Boxplot of plasma oxalate concentrations with the cut-off of 4.15 μmol/L (indicated by the red line). (D) ROC curve, AUC value, specificity, and sensitivity for the cut-off of 4.15 μmol/L. Abbreviations: GC-MS, gas chromatography-mass spectrometry; HP, primary hyperoxaluria; AUC, area under the ROC curve.
Reference
-
References
1. Brzica H, Breljak D, Burckhardt BC, Burckhardt G, Sabolić I. 2013; Oxalate: from the environment to kidney stones. Arh Hig Rada Toksikol. 64:609–30. DOI: 10.2478/10004-1254-64-2013-2428. PMID: 24384768.2. Danpure CJ, Cooper PJ, Wise PJ, Jennings PR. 1989; An enzyme trafficking defect in two patients with primary hyperoxaluria type 1: peroxisomal alanine/glyoxylate aminotransferase rerouted to mitochondria. J Cell Biol. 108:1345–52. DOI: 10.1083/jcb.108.4.1345. PMID: 2925788. PMCID: PMC2115519.3. Williams EL, Acquaviva C, Amoroso A, Chevalier F, Coulter-Mackie M, Monico CG, et al. 2009; Primary hyperoxaluria type 1: update and additional mutation analysis of the AGXT gene. Hum Mutat. 30:910–7. DOI: 10.1002/humu.21021. PMID: 19479957.4. Cochat P, Hulton SA, Acquaviva C, Danpure CJ, Daudon M, De Marchi M, et al. 2012; Primary hyperoxaluria type 1: indications for screening and guidance for diagnosis and treatment. Nephrol Dial Transplant. 27:1729–36. DOI: 10.1093/ndt/gfs078. PMID: 22547750.5. Cramer SD, Ferree PM, Lin K, Milliner DS, Holmes RP. 1999; The gene encoding hydroxypyruvate reductase (GRHPR) is mutated in patients with primary hyperoxaluria type II. Hum Mol Genet. 8:2063–9. DOI: 10.1093/hmg/8.11.2063. PMID: 10484776.6. Rumsby G, Cochat P. 2013; Primary hyperoxaluria. N Engl J Med. 369:2163. DOI: 10.1056/NEJMc1311606.7. Williams EL, Bockenhauer D, van't Hoff WG, Johri N, Laing C, Sinha MD, et al. 2012; The enzyme 4-hydroxy-2-oxoglutarate aldolase is deficient in primary hyperoxaluria type 3. Nephrol Dial Transplant. 27:3191–5. DOI: 10.1093/ndt/gfs039. PMID: 22391140.8. Greed L, Willis F, Johnstone L, Teo S, Belostotsky R, Frishberg Y, et al. 2018; Metabolite diagnosis of primary hyperoxaluria type 3. Pediatr Nephrol. 33:1443–6. DOI: 10.1007/s00467-018-3967-6. PMID: 29705963.9. Porowski T, Gałasiński W. 2003; A semi-micromethod for determination of oxalate in human plasma. Acta Pol Pharm. 60:239–45.10. Hoppe B, Kemper MJ, Hvizd MG, Sailer DE, Langman CB. 1998; Simultaneous determination of oxalate, citrate and sulfate in children's plasma with ion chromatography. Kidney Int. 53:1348–52. DOI: 10.1046/j.1523-1755.1998.00891.x. PMID: 9573551.11. Elgstoen KBP. 2008; Liquid chromatography-tandem mass spectrometry method for routine measurement of oxalic acid in human plasma. J Chromatogr B Analyt Technol Biomed Life Sci. 873:31–6. DOI: 10.1016/j.jchromb.2008.07.002. PMID: 18755640.12. Chambers MM, Russell JC. 1973; A specific assay for plasma oxalate. Clin Biochem. 6:22–8. DOI: 10.1016/S0009-9120(73)80005-0. PMID: 4699617.13. France NC, Holland PT, McGhie TK, Wallace MR. 1988; Measurement of plasma oxalate by capillary gas chromatography and its validation by isotope dilution mass spectrometry. J Chromatogr. 433:1–7. DOI: 10.1016/S0378-4347(00)80579-4. PMID: 3069854.14. Inoue Y, Masuyama H, Ikawa H, Mitsubuchi H, Kuhara T. 2003; Monitoring method for pre- and post-liver transplantation in patients with primary hyperoxaluria type I. J Chromatogr B Analyt Technol Biomed Life Sci. 792:89–97. DOI: 10.1016/S1570-0232(03)00278-2. PMID: 12829001.15. Wolthers BG, Hayer M. 1982; The determination of oxalic acid in plasma and urine by means of capillary gas chromatography. Clin Chim Acta. 120:87–102. DOI: 10.1016/0009-8981(82)90080-8. PMID: 7067141.16. Ladwig PM, Liedtke RR, Larson TS, Lieske JC. 2005; Sensitive spectrophotometric assay for plasma oxalate. Clin Chem. 51:2377–80. DOI: 10.1373/clinchem.2005.054353. PMID: 16306102.17. Xia J, Psychogios N, Young N, Wishart DS. 2009; MetaboAnalyst: a web server for metabolomic data analysis and interpretation. Nucleic Acids Res. 37(Web Server issue):W652–60. DOI: 10.1093/nar/gkp356. PMID: 19429898. PMCID: PMC2703878.18. De Nicolò A, Cantù M, D'Avolio A. 2017; Matrix effect management in liquid chromatography mass spectrometry: the internal standard normalized matrix effect. Bioanalysis. 9:1093–105. DOI: 10.4155/bio-2017-0059. PMID: 28737421.19. Cortese M, Gigliobianco MR, Magnoni F, Censi R, Di Martino PD. 2020; Compensate for or minimize matrix effects? Strategies for overcoming matrix effects in liquid chromatography-mass spectrometry technique: a tutorial review. Molecules. 25:3047. DOI: 10.3390/molecules25133047. PMID: 32635301. PMCID: PMC7412464.20. Stokes F, Acquaviva-Bourdain C, Hoppe B, Lieske JC, Lindner E, Toulson G, et al. 2020; Plasma oxalate: comparison of methodologies. Urolithiasis. 48:473–80. DOI: 10.1007/s00240-020-01197-4. PMID: 32472220. PMCID: PMC7666277.21. Assimos DG. 2020; Re: plasma oxalate: comparison of methodologies. J Urol. 204:1374. DOI: 10.1097/JU.0000000000001280.22. Mazzachi BC, Teubner JK, Ryall RL. 1984; Factors affecting measurement of urinary oxalate. Clin Chem. 30:1339–43. DOI: 10.1093/clinchem/30.8.1339. PMID: 6744582.23. Hellman L, Burns JJ. 1958; Metabolism of l-ascorbic acid-1-C14 in man. J Biol Chem. 230:923–30. DOI: 10.1016/S0021-9258(18)70515-2. PMID: 13525409.24. Knight J, Madduma-Liyanage K, Mobley JA, Assimos DG, Holmes RP. 2016; Ascorbic acid intake and oxalate synthesis. Urolithiasis. 44:289–97. DOI: 10.1007/s00240-016-0868-7. PMID: 27002809. PMCID: PMC4946963.25. Rolton HA, McConnell KM, Modi KS, Macdougall AI. 1991; The effect of vitamin C intake on plasma oxalate in patients on regular haemodialysis. Nephrol Dial Transplant. 6:440–3. DOI: 10.1093/ndt/6.6.440. PMID: 1876286.26. Wechtersbach L, Cigić B. 2007; Reduction of dehydroascorbic acid at low pH. J Biochem Biophys Methods. 70:767–72. DOI: 10.1016/j.jbbm.2007.04.007. PMID: 17544513.27. Simpson GL, Ortwerth BJ. 2000; The non-oxidative degradation of ascorbic acid at physiological conditions. Biochim Biophys Acta. 1501:12–24. DOI: 10.1016/S0925-4439(00)00009-0. PMID: 10727845.28. Kasidas GP, Rose GA. 1986; Measurement of plasma oxalate in healthy subjects and in patients with chronic renal failure using immobilised oxalate oxidase. Clin Chim Acta. 154:49–58. DOI: 10.1016/0009-8981(86)90087-2. PMID: 3943224.29. Perinpam M, Enders FT, Mara KC, Vaughan LE, Mehta RA, Voskoboev N, et al. 2017; Plasma oxalate in relation to eGFR in patients with primary hyperoxaluria, enteric hyperoxaluria and urinary stone disease. Clin Biochem. 50:1014–9. DOI: 10.1016/j.clinbiochem.2017.07.017. PMID: 28764885. PMCID: PMC5705406.30. Costello JF, Sadovnic MJ, Cottington EM. 1991; Plasma oxalate concentrations rise in hemodialysis patients despite increased oxalate removal. J Am Soc Nephrol. 1:1289–98. DOI: 10.1681/ASN.V1121289. PMID: 1912391.
- Full Text Links
-
- Actions
-
Cited
- CITED
-
- Close
- Share
-
- Similar articles
-
- A screening method for neuroblastoma and organic acidemias by gas chromatography-mass spectrometry
- Quantitative analysis of endogenous steroids in human urine by using gas chromatography-mass spectrometry
- A Case of Primary Hyperoxaluria with Renal Allograft Dysfunction
- Quantitative Analysis of Urinary Organic Acids by Gas Chromatography-Mass Spectrometry
- End-stage Renal Disease Caused by Primary Hyperoxaluria
