Cancer Res Treat.
2024 Jan;56(1):162-177. 10.4143/crt.2023.330.
Tumor Microenvironment Can Predict Chemotherapy Response of Patients with Triple-Negative Breast Cancer Receiving Neoadjuvant Chemotherapy
- Affiliations
-
- 1Interdisciplinary Program of Genomic Data Science, Pusan National University, Yangsan, Korea
- 2Biomedical Research Institute, Pusan National University School of Medicine, Yangsan, Korea
- 3Department of Internal Medicine, Pusan National University Yangsan Hospital, Pusan National University School of Medicine, Yangsan, Korea
- 4Periodontal Disease Signaling Network Research Center, Pusan National University School of Dentistry, Yangsan, Korea
- 5Department of Anatomy, Pusan National University School of Medicine, Yangsan, Korea
- 6Department of Biomedical Informatics, Pusan National University School of Medicine, Yangsan, Korea
- 7Division of Hematology and Oncology, Department of Internal Medicine, Pusan National University Yangsan Hospital, Yangsan, Korea
- KMID: 2550333
- DOI: http://doi.org/10.4143/crt.2023.330
Abstract
- Purpose
Triple-negative breast cancer (TNBC) is a breast cancer subtype that has poor prognosis and exhibits a unique tumor microenvironment. Analysis of the tumor microbiome has indicated a relationship between the tumor microenvironment and treatment response. Therefore, we attempted to reveal the role of the tumor microbiome in patients with TNBC receiving neoadjuvant chemotherapy.
Materials and Methods
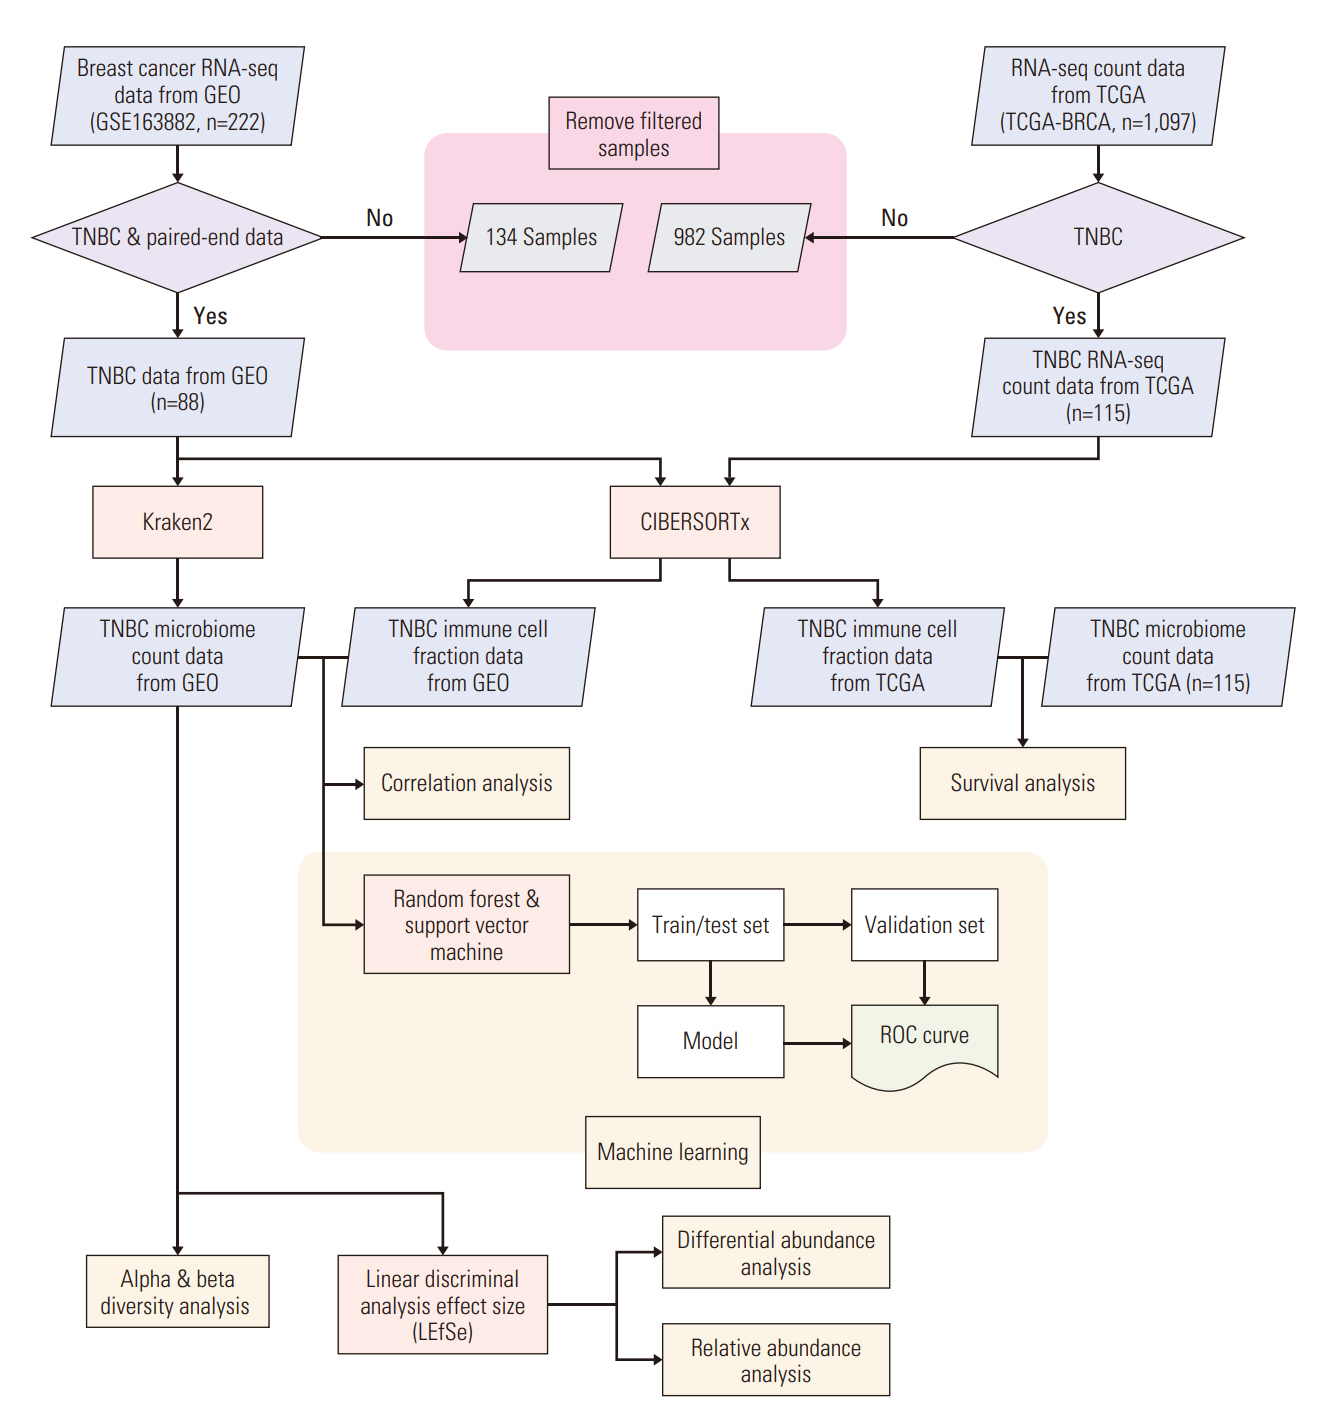
We collected TNBC patient RNA-sequencing samples from the Gene Expression Omnibus and extracted microbiome count data. Differential and relative abundance were estimated with linear discriminant analysis effect size. We calculated the immune cell fraction with CIBERSORTx and conducted survival analysis using the Cancer Genome Atlas patient data. Correlations between the microbiome and immune cell compositions were analyzed and a prediction model was constructed to estimate drug response.
Results
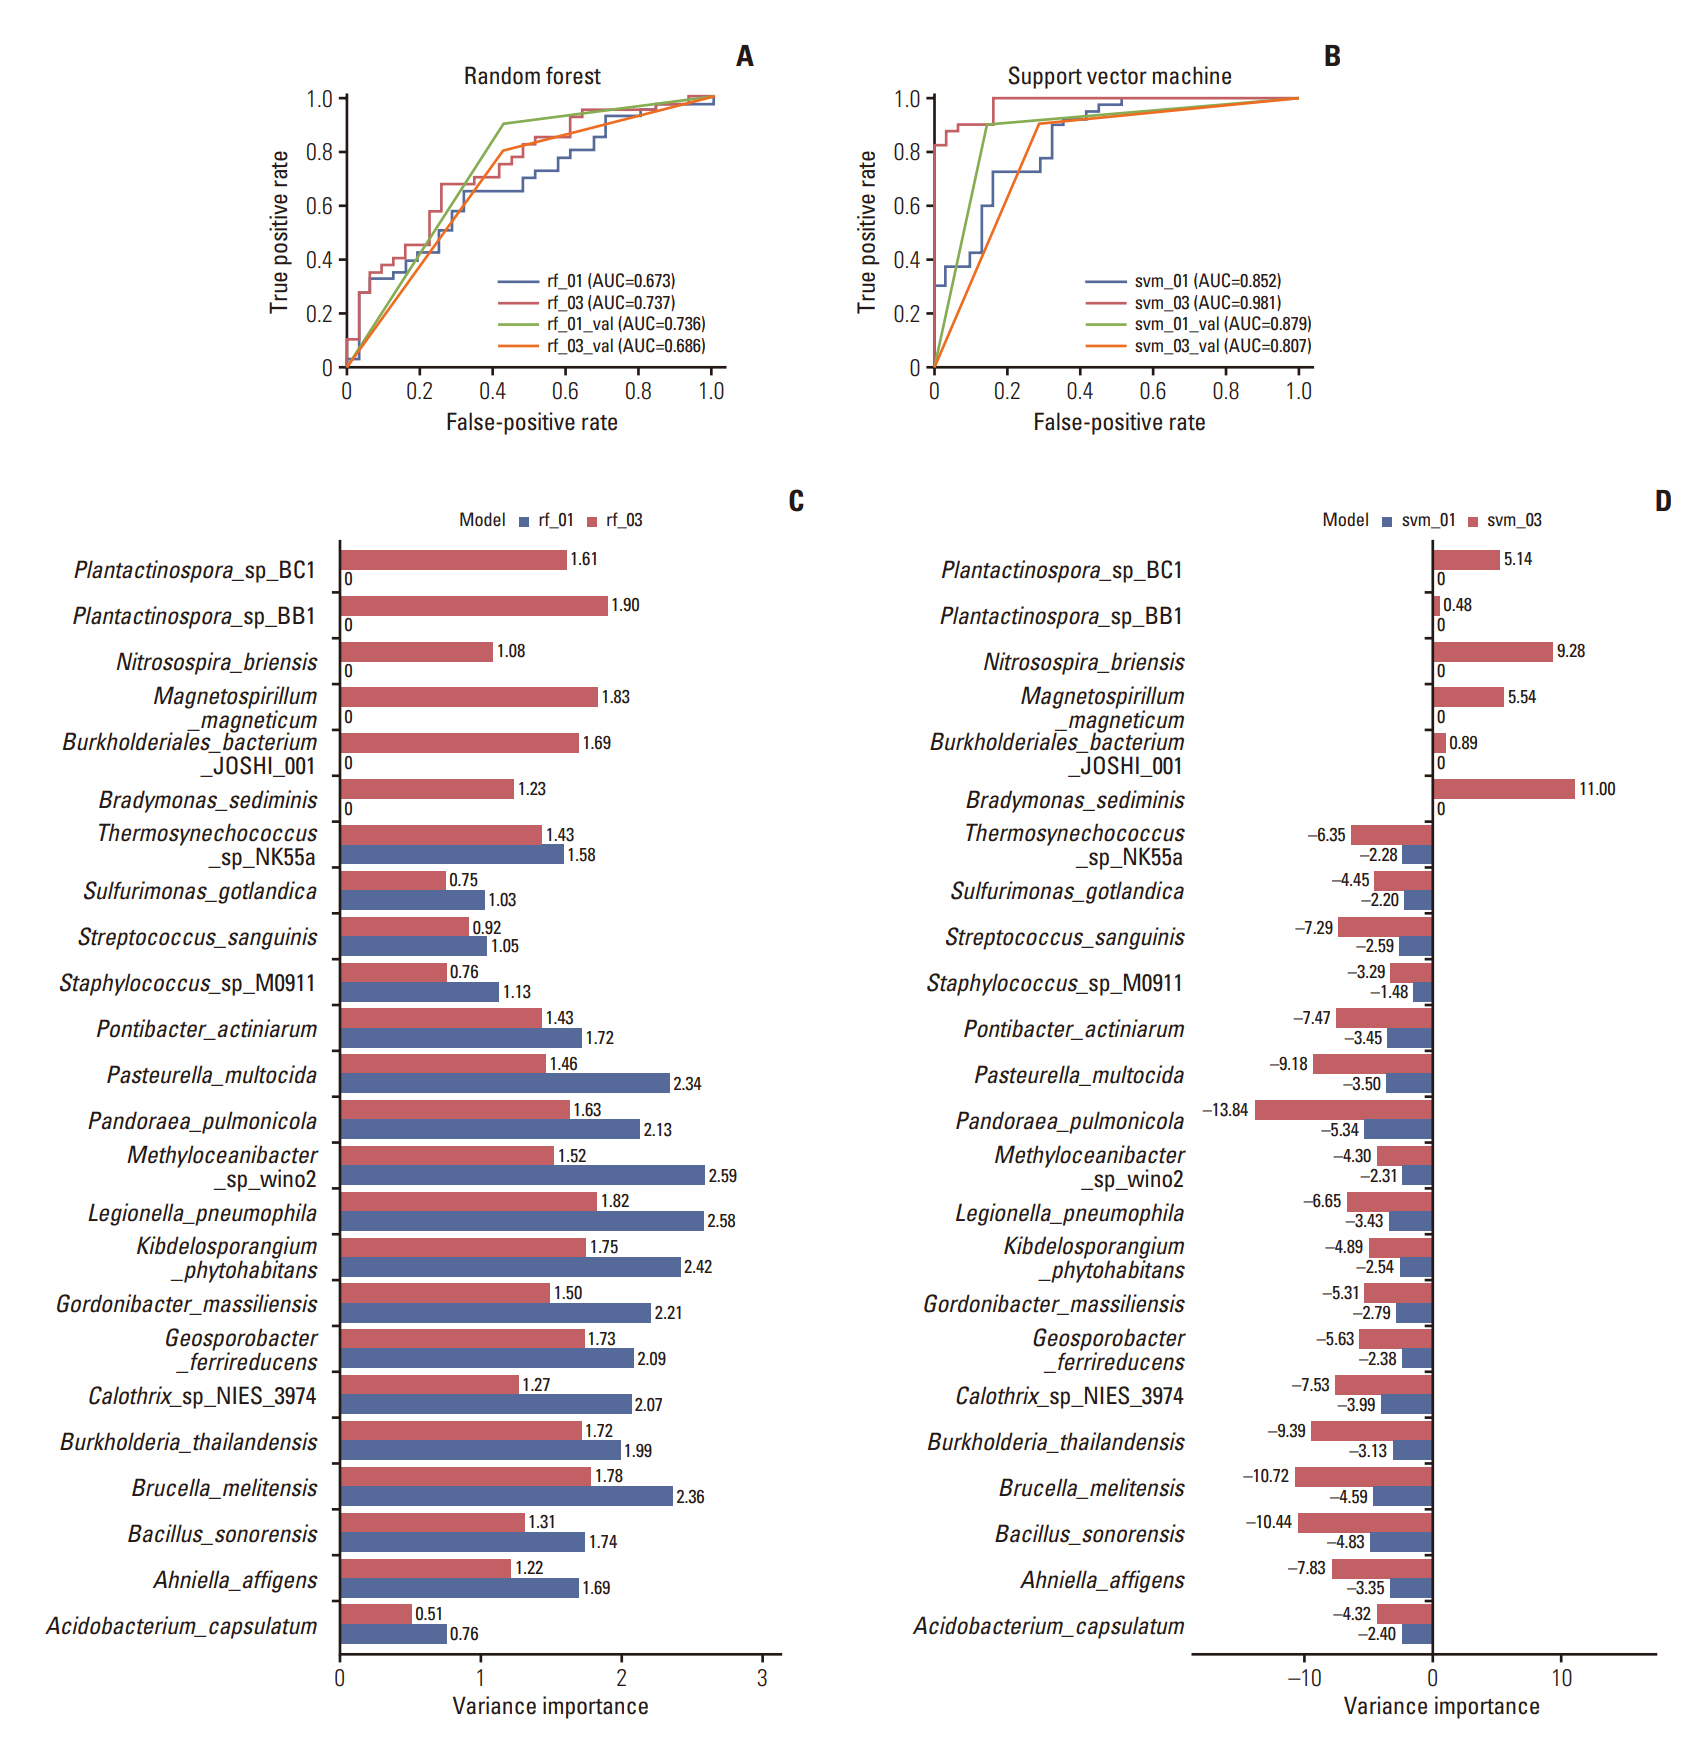
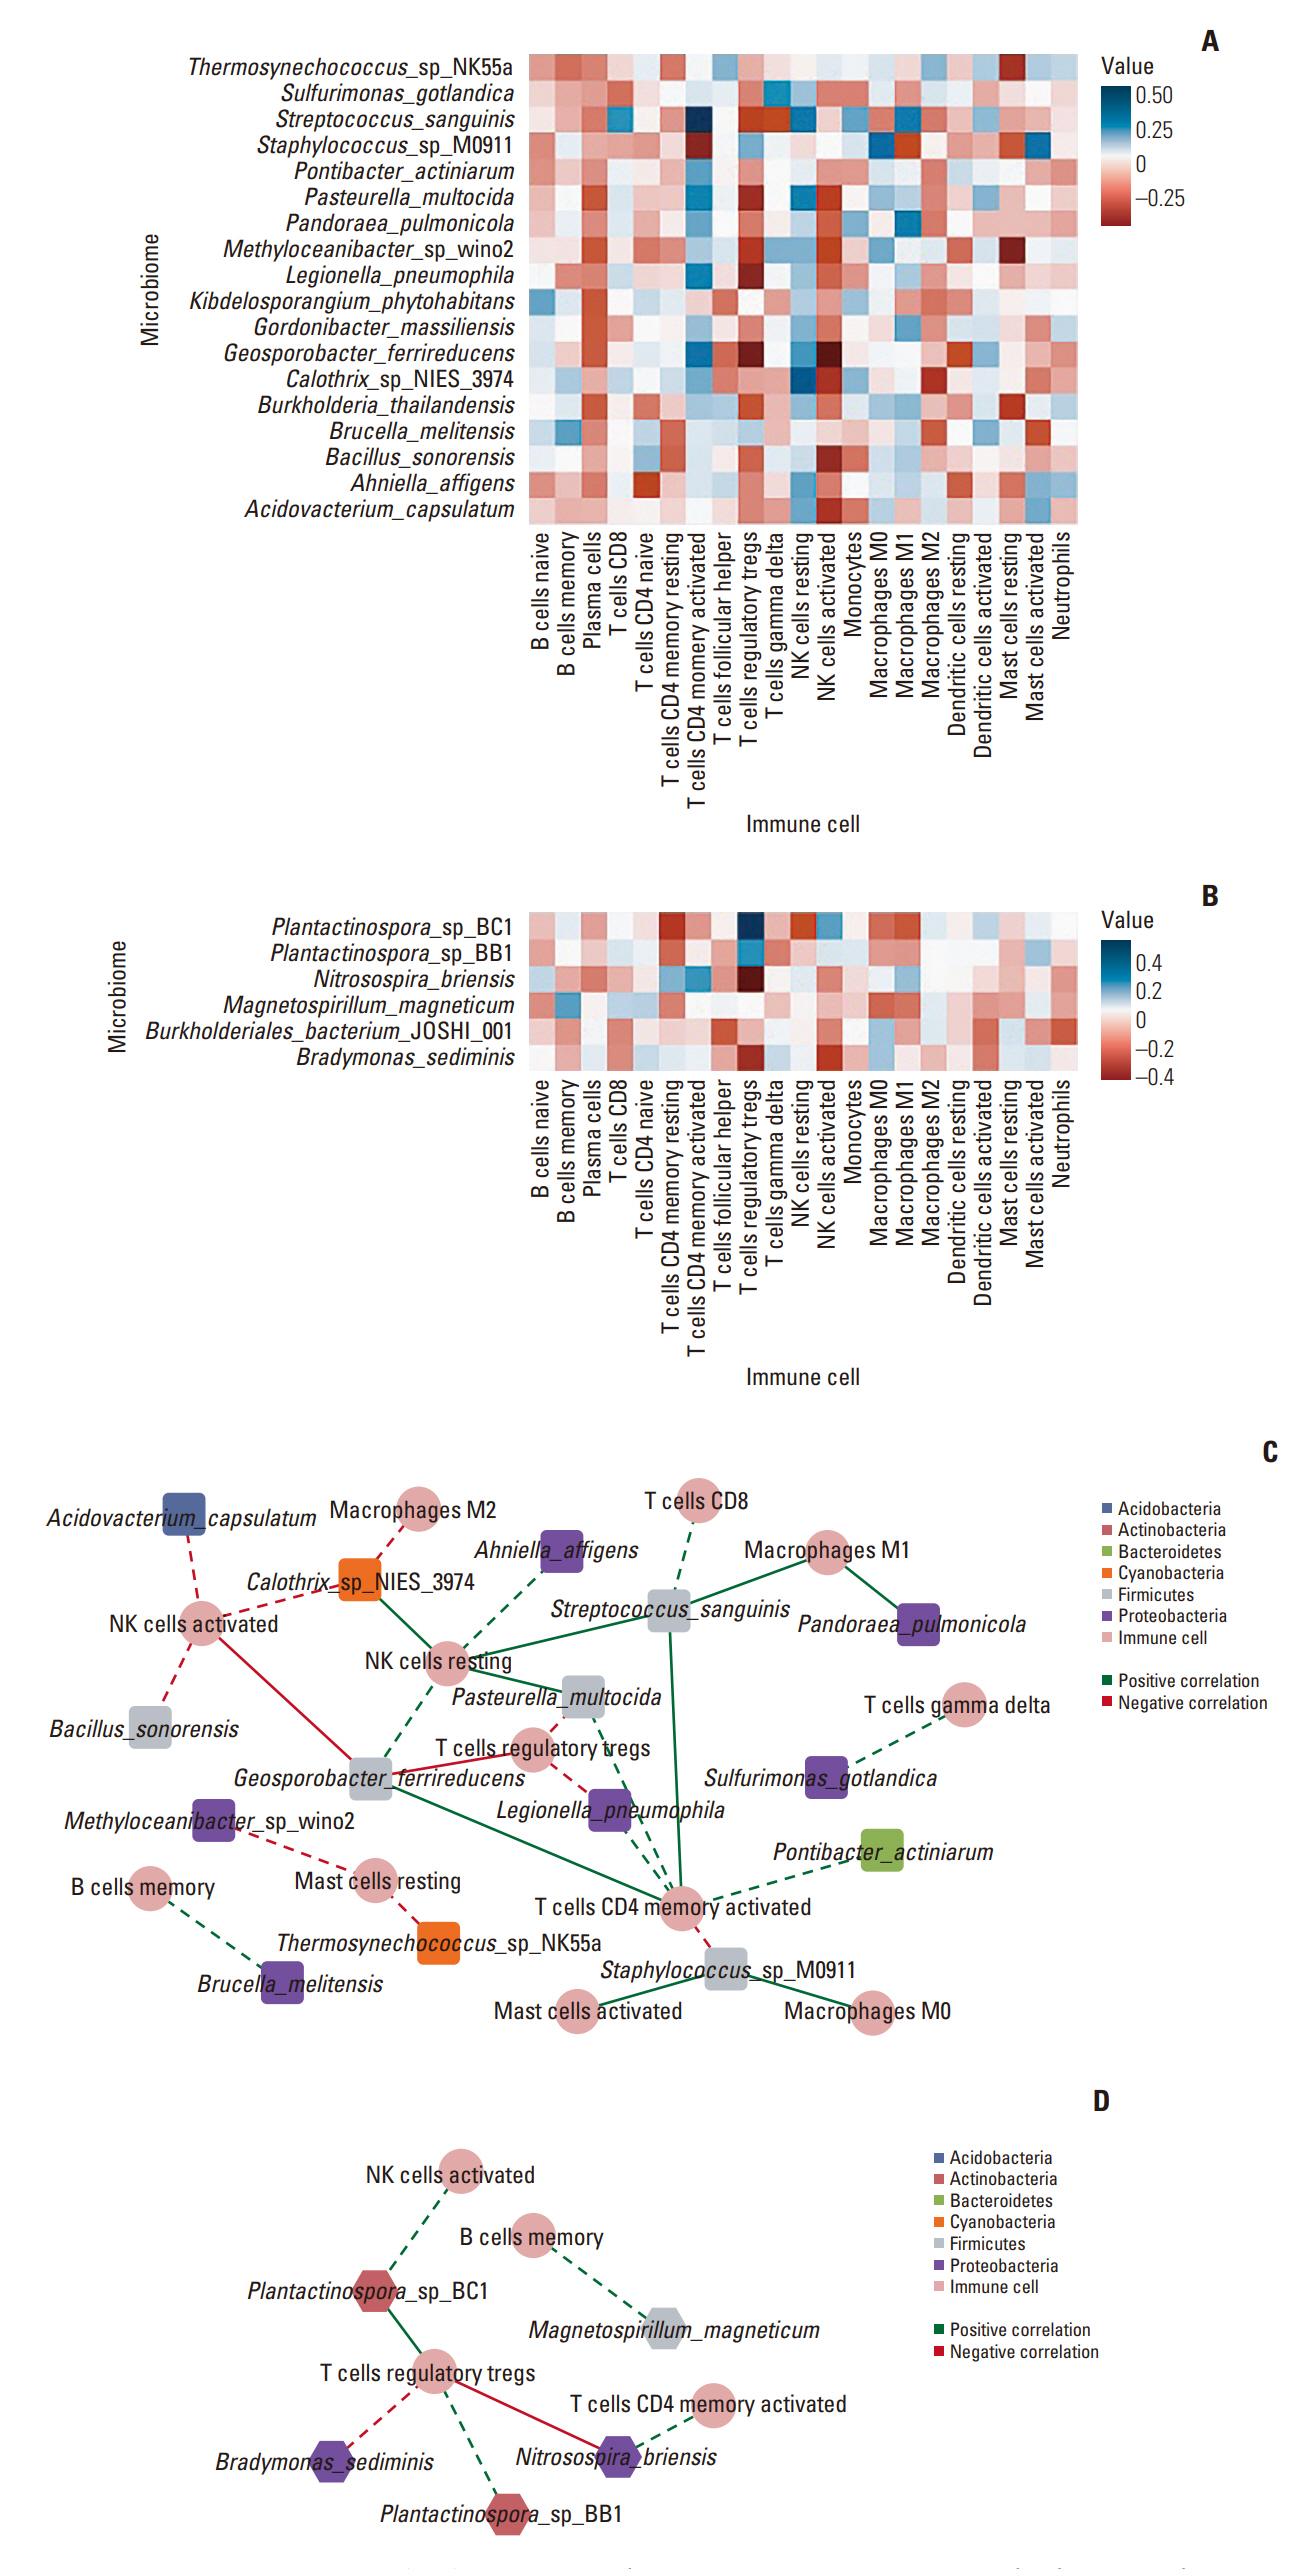
Among the pathological complete response group (pCR), the beta diversity varied considerably; consequently, 20 genera and 24 species were observed to express a significant differential and relative abundance. Pandoraea pulmonicola and Brucella melitensis were found to be important features in determining drug response. In correlation analysis, Geosporobacter ferrireducens, Streptococcus sanguinis, and resting natural killer cells were the most correlated factors in the pCR, whereas Nitrosospira briensis, Plantactinospora sp. BC1, and regulatory T cells were key features in the residual disease group.
Conclusion
Our study demonstrated that the microbiome analysis of tumor tissue can predict chemotherapy response of patients with TNBC. Further, the immunological tumor microenvironment may be impacted by the tumor microbiome, thereby affecting the corresponding survival and treatment response.
Figure
Reference
-
References
1. Bray F, Ferlay J, Soerjomataram I, Siegel RL, Torre LA, Jemal A. G1lobal cancer statistics 2018: GLOBOCAN estimates of incidence and mortality worldwide for 36 cancers in 185 countries. CA Cancer J Clin. 2018; 68:394–424.2. Siegel RL, Miller KD, Jemal A. Cancer statistics, 2018. CA Cancer J Clin. 2018; 68:7–30.3. Yin L, Duan JJ, Bian XW, Yu SC. Triple-negative breast cancer molecular subtyping and treatment progress. Breast Cancer Res. 2020; 22:61.4. Rakha EA, Reis-Filho JS, Ellis IO. Basal-like breast cancer: a critical review. J Clin Oncol. 2008; 26:2568–81.5. Suba Z. Triple-negative breast cancer risk in women is defined by the defect of estrogen signaling: preventive and therapeutic implications. Onco Targets Ther. 2014; 7:147–64.6. Brouckaert O, Wildiers H, Floris G, Neven P. Update on triple-negative breast cancer: prognosis and management strategies. Int J Womens Health. 2012; 4:511–20.7. Xu B, Sun H, Song X, Liu Q, Jin W. Mapping the tumor microenvironment in TNBC and deep exploration for M1 macrophages-associated prognostic genes. Front Immunol. 2022; 13:923481.8. Fan Y, He S. The characteristics of tumor microenvironment in triple negative breast cancer. Cancer Manag Res. 2022; 14:1–17.9. Liu F, Lang R, Zhao J, Zhang X, Pringle GA, Fan Y, et al. CD8(+) cytotoxic T cell and FOXP3(+) regulatory T cell infiltration in relation to breast cancer survival and molecular subtypes. Breast Cancer Res Treat. 2011; 130:645–55.10. Liu S, Lachapelle J, Leung S, Gao D, Foulkes WD, Nielsen TO. CD8+ lymphocyte infiltration is an independent favorable prognostic indicator in basal-like breast cancer. Breast Cancer Res. 2012; 14:R48.11. Lee S, Cho EY, Park YH, Ahn JS, Im YH. Prognostic impact of FOXP3 expression in triple-negative breast cancer. Acta Oncol. 2013; 52:73–81.12. Stanton SE, Disis ML. Clinical significance of tumor-infiltrating lymphocytes in breast cancer. J Immunother Cancer. 2016; 4:59.13. Annaratone L, Cascardi E, Vissio E, Sarotto I, Chmielik E, Sapino A, et al. The multifaceted nature of tumor microenvironment in breast carcinomas. Pathobiology. 2020; 87:125–42.14. Smith IE, Lipton L. Preoperative/neoadjuvant medical therapy for early breast cancer. Lancet Oncol. 2001; 2:561–70.15. Shin HC, Han W, Moon HG, Im SA, Moon WK, Park IA, et al. Breast-conserving surgery after tumor downstaging by neoadjuvant chemotherapy is oncologically safe for stage III breast cancer patients. Ann Surg Oncol. 2013; 20:2582–9.16. Masuda N, Lee SJ, Ohtani S, Im YH, Lee ES, Yokota I, et al. Adjuvant capecitabine for breast cancer after preoperative chemotherapy. N Engl J Med. 2017; 376:2147–59.17. Spring LM, Fell G, Arfe A, Sharma C, Greenup R, Reynolds KL, et al. Pathologic complete response after neoadjuvant chemotherapy and impact on breast cancer recurrence and survival: a comprehensive meta-analysis. Clin Cancer Res. 2020; 26:2838–48.18. Hyder T, Bhattacharya S, Gade K, Nasrazadani A, Brufsky AM. Approaching neoadjuvant therapy in the management of early-stage breast cancer. Breast Cancer (Dove Med Press). 2021; 13:199–211.19. Tutt AN, Garber JE, Kaufman B, Viale G, Fumagalli D, Rastogi P, et al. Adjuvant olaparib for patients with BRCA1- or BRCA2-mutated breast cancer. N Engl J Med. 2021; 384:2394–405.20. Rizzo A, Cusmai A, Acquafredda S, Giovannelli F, Rinaldi L, Misino A, et al. KEYNOTE-522, IMpassion031 and GeparNUEVO: changing the paradigm of neoadjuvant immune checkpoint inhibitors in early triple-negative breast cancer. Future Oncol. 2022; 18:2301–9.21. Chen JW, Russell RP, Desai T, Fiel-Gan M, Bhat V, de Fatima Dias Gaui M, et al. RNA expression classifiers from a model of breast epithelial cell organization to predict pathological complete response in triple negative breast cancer. medRxiv. Preprint at: https://doi.org/10.1101/2021.02.10.21251517. 2021.22. Davis S, Meltzer PS. GEOquery: a bridge between the Gene Expression Omnibus (GEO) and BioConductor. Bioinformatics. 2007; 23:1846–7.23. Poore GD, Kopylova E, Zhu Q, Carpenter C, Fraraccio S, Wandro S, et al. Microbiome analyses of blood and tissues suggest cancer diagnostic approach. Nature. 2020; 579:567–74.24. Wood DE, Lu J, Langmead B. Improved metagenomic analysis with Kraken 2. Genome Biol. 2019; 20:257.25. Lu J, Breitwieser FP, Thielen P, Salzberg SL. Bracken: estimating species abundance in metagenomics data. PeerJ Comput Sci. 2017; 3:e104.26. McMurdie PJ, Holmes S. phyloseq: an R package for reproducible interactive analysis and graphics of microbiome census data. PLoS One. 2013; 8:e61217.27. Segata N, Izard J, Waldron L, Gevers D, Miropolsky L, Garrett WS, et al. Metagenomic biomarker discovery and explanation. Genome Biol. 2011; 12:R60.28. Newman AM, Steen CB, Liu CL, Gentles AJ, Chaudhuri AA, Scherer F, et al. Determining cell type abundance and expression from bulk tissues with digital cytometry. Nat Biotechnol. 2019; 37:773–82.29. Therneau TM. A package for survival analysis in S. R package version. Vienna: The R Foundation;2015.30. Harrell FE Jr, Harrell MF Jr. Package ‘hmisc’. CRAN2018. Vienna: The R Foundation;2019. p. 235–6.31. Shannon P, Markiel A, Ozier O, Baliga NS, Wang JT, Ramage D, et al. Cytoscape: a software environment for integrated models of biomolecular interaction networks. Genome Res. 2003; 13:2498–504.32. Dimitriadou E, Hornik K, Leisch F, Meyer D, Weingessel A. Misc functions of the Department of Statistics (e1071), TU Wien. R package 1. Vienna: The R Foundation;2008.33. Liaw A, Wiener M. Classification and regression based on a forest of trees using random inputs. R Package. Vienna: The R Foundation;2018.34. Hatzis C, Pusztai L, Valero V, Booser DJ, Esserman L, Lluch A, et al. A genomic predictor of response and survival following taxane-anthracycline chemotherapy for invasive breast cancer. JAMA. 2011; 305:1873–81.35. Xuan C, Shamonki JM, Chung A, Dinome ML, Chung M, Sieling PA, et al. Microbial dysbiosis is associated with human breast cancer. PLoS One. 2014; 9:e83744.36. McAllister F, Khan MAW, Helmink B, Wargo JA. The tumor microbiome in pancreatic cancer: bacteria and beyond. Cancer Cell. 2019; 36:577–9.37. Riquelme E, Zhang Y, Zhang L, Montiel M, Zoltan M, Dong W, et al. Tumor microbiome diversity and composition influence pancreatic cancer outcomes. Cell. 2019; 178:795–806.38. Greathouse KL, White JR, Vargas AJ, Bliskovsky VV, Beck JA, von Muhlinen N, et al. Interaction between the microbiome and TP53 in human lung cancer. Genome Biol. 2018; 19:123.39. Sakamoto Y, Mima K, Ishimoto T, Ogata Y, Imai K, Miyamoto Y, et al. Relationship between Fusobacterium nucleatum and antitumor immunity in colorectal cancer liver metastasis. Cancer Sci. 2021; 112:4470–7.40. Nejman D, Livyatan I, Fuks G, Gavert N, Zwang Y, Geller LT, et al. The human tumor microbiome is composed of tumor type-specific intracellular bacteria. Science. 2020; 368:973–80.41. Tzeng A, Sangwan N, Jia M, Liu CC, Keslar KS, Downs-Kelly E, et al. Human breast microbiome correlates with prognostic features and immunological signatures in breast cancer. Genome Med. 2021; 13:60.42. Fu A, Yao B, Dong T, Chen Y, Yao J, Liu Y, et al. Tumor-resident intracellular microbiota promotes metastatic colonization in breast cancer. Cell. 2022; 185:1356–72.43. Yu T, Di G. Role of tumor microenvironment in triple-negative breast cancer and its prognostic significance. Chin J Cancer Res. 2017; 29:237–52.
- Full Text Links
- Actions
-
Cited
- CITED
-
- Close
- Share
- Similar articles
-
- Differences in prognosis by p53 expression after neoadjuvant chemotherapy in triple-negative breast cancer
- Pathologic Findings of Residual Tumor according to the Response Rate after Neoadjuvant Chemotherapy for Breast Cancer
- Comment on “Histomorphological Factors Predicting the Response to Neoadjuvant Chemotherapy in Triple-Negative Breast Cancerâ€
- Histomorphological Factors Predicting the Response to Neoadjuvant Chemotherapy in Triple-Negative Breast Cancer
- Bilateral Triple Negative Invasive Ductal Breast Carcinoma in a BRCA1 Mutation Carrier with Discrepant Pathologic Response to Neoadjuvant Chemotherapy


