Improvement of Dialysis Dosing Using Big Data Analytics
- Mumtaz SL
 1
1 - Shamayleh A1,2,3
- Alshraideh H1,2,3
- Guella A4
- Affiliations
-
- 1Biomedical Engineering Graduate Program, American University of Sharjah, Sharjah, UAE
- 2Engineering Systems Management, American University of Sharjah, Sharjah, UAE
- 3Department of Industrial Engineering, American University of Sharjah, Sharjah, UAE
- 4Department of Nephrology, University Hospital Sharjah, Sharjah, UAE
- KMID: 2542144
- DOI: http://doi.org/10.4258/hir.2023.29.2.174
Abstract
Objectives
Large amounts of healthcare data are now generated via patient health records, records of diagnosis and treatment, smart devices, and wearables. Extracting insights from such data can transform healthcare from a traditional, symptom-driven practice into precisely personalized medicine. Dialysis treatments generate a vast amount of data, with more than 100 parameters that must be regulated for ideal treatment outcomes. When complications occur, understanding electrolyte parameters and predicting their outcomes to deliver the optimal dialysis dosing for each patient is a challenge. This study focused on refining dialysis dosing by utilizing emerging data from the growing number of dialysis patients to improve patients’ quality of life and well-being.
Methods
Exploratory data analysis and data prediction approaches were performed to gather insights from patients’ vital electrolytes on how to improve the patients’ dialysis dosing. Four predictive models were constructed to predict electrolyte levels through various dialysis parameters.
Results
The decision tree model showed excellent performance and more accurate results than the support vector machine, linear regression, and neural network models.
Conclusions
The predictive models identified that pre-dialysis blood urea nitrogen, pre-weight, dry weight, anticoagulation, and sex had the most significant effects on electrolyte concentrations. Such models could fine-tune dialysis dosing levels for the growing number of dialysis patients to improve each patient’s quality of life, life expectancy, and well-being, and to reduce costs, efforts, and time consumption for both patients and physicians. The study’s results need to be validated on a larger scale.
Keyword
Figure
-

Figure 1 Definitions of categories and dialysis patients’ attributes. The figure represents the 14 categories that comprised 117 attributes, respectively. The most significant categories used for exploratory data analysis or data prediction were the demographic, electrolyte, and patient dialysis factors. DOB: date of birth, LMW: low molecular weight, TSH: thyroid-stimulating hormone, ECG: echocardiography, GGT: gamma-glutamyl transferase, GTT: glucose tolerance test, PTH: parathyroid hormone, LDH: lactate dehydrogenase, ALT: alanine transaminase, LDL: low density lipoprotein, HDL: high density lipoprotein, TIBC: total iron binding capacity, TSAT: transferrin saturation, HIV: human immunodeficiency virus, HCV: hepatitis C virus, PCR: polymerase chain reaction, BNP: B-type natriuretic peptide, CRP: C-reactive protein, AST: aspartate aminotransferase, MCV: mean corpuscular volume, MCH: mean corpuscular hemoglobin, MCHC: mean corpuscular hemoglobin concentration, EPO: erythropoietin, URR: urea reduction rate, BUN: blood urea nitrogen.
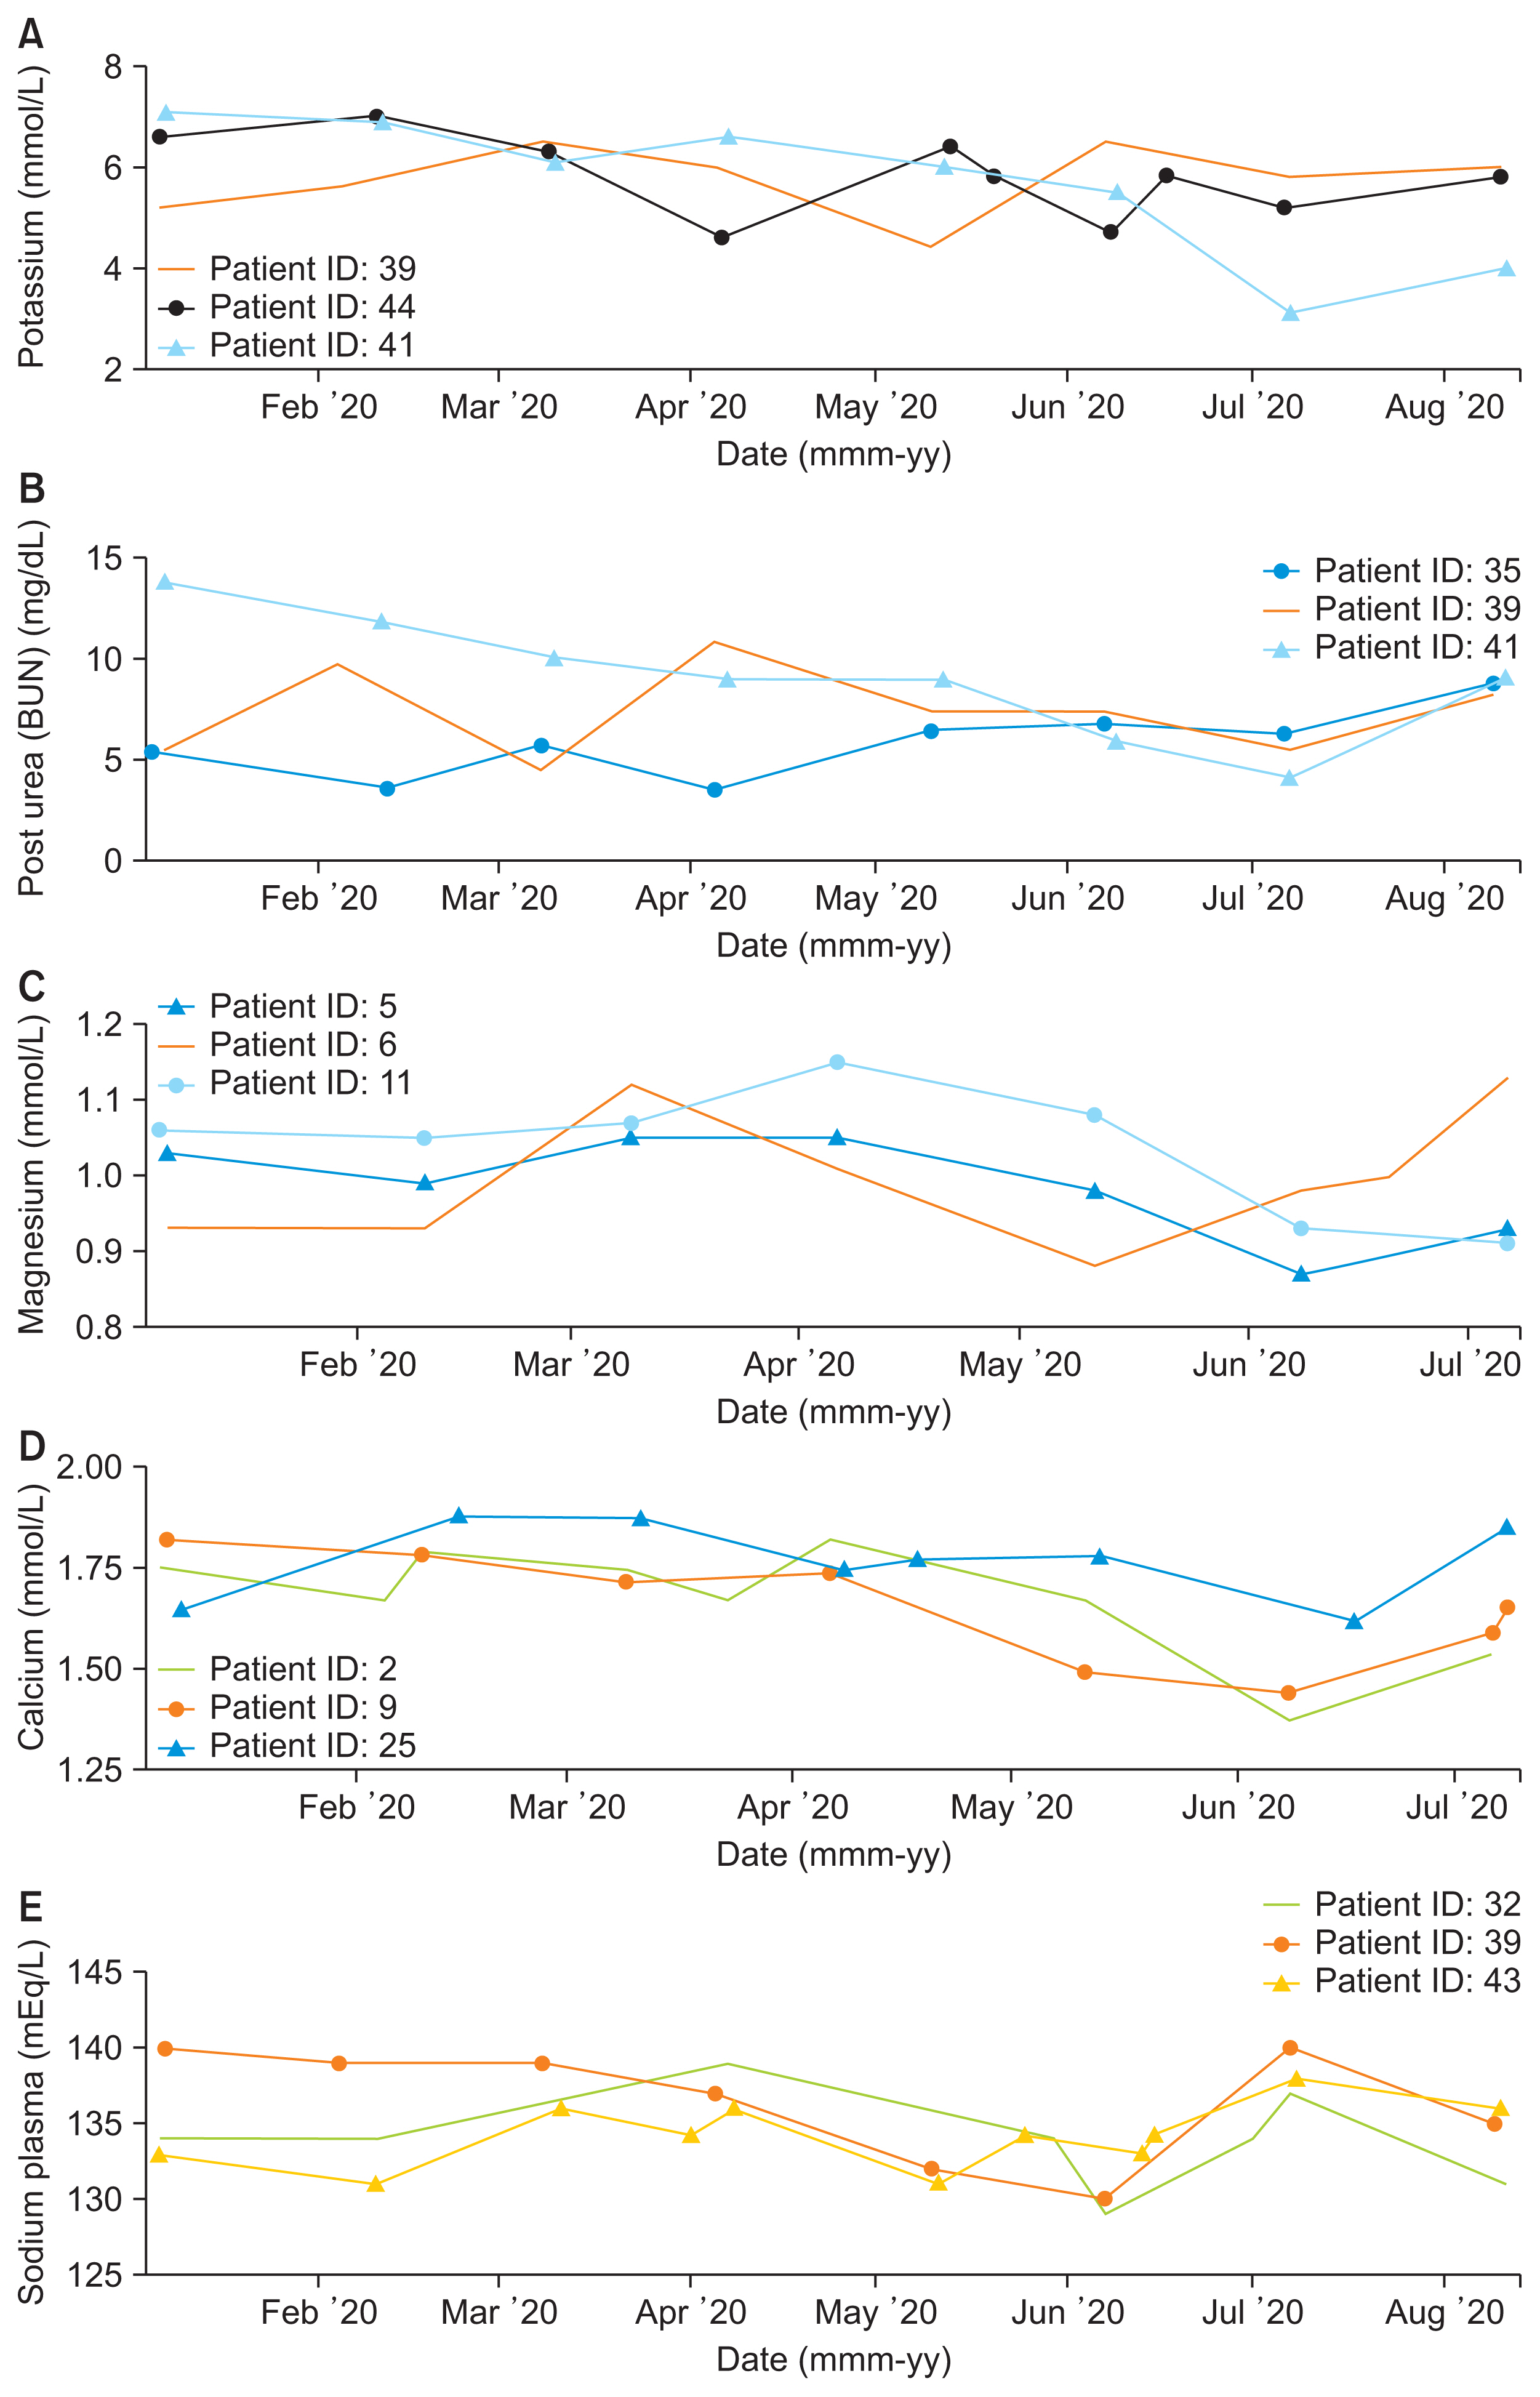
Figure 2 Electrolyte variability profiles among patients. Representation of electrolyte variability among patients over a 1-year period: (A) potassium, (B) post-urea, (C) magnesium, (D) calcium, and (E) plasma sodium.
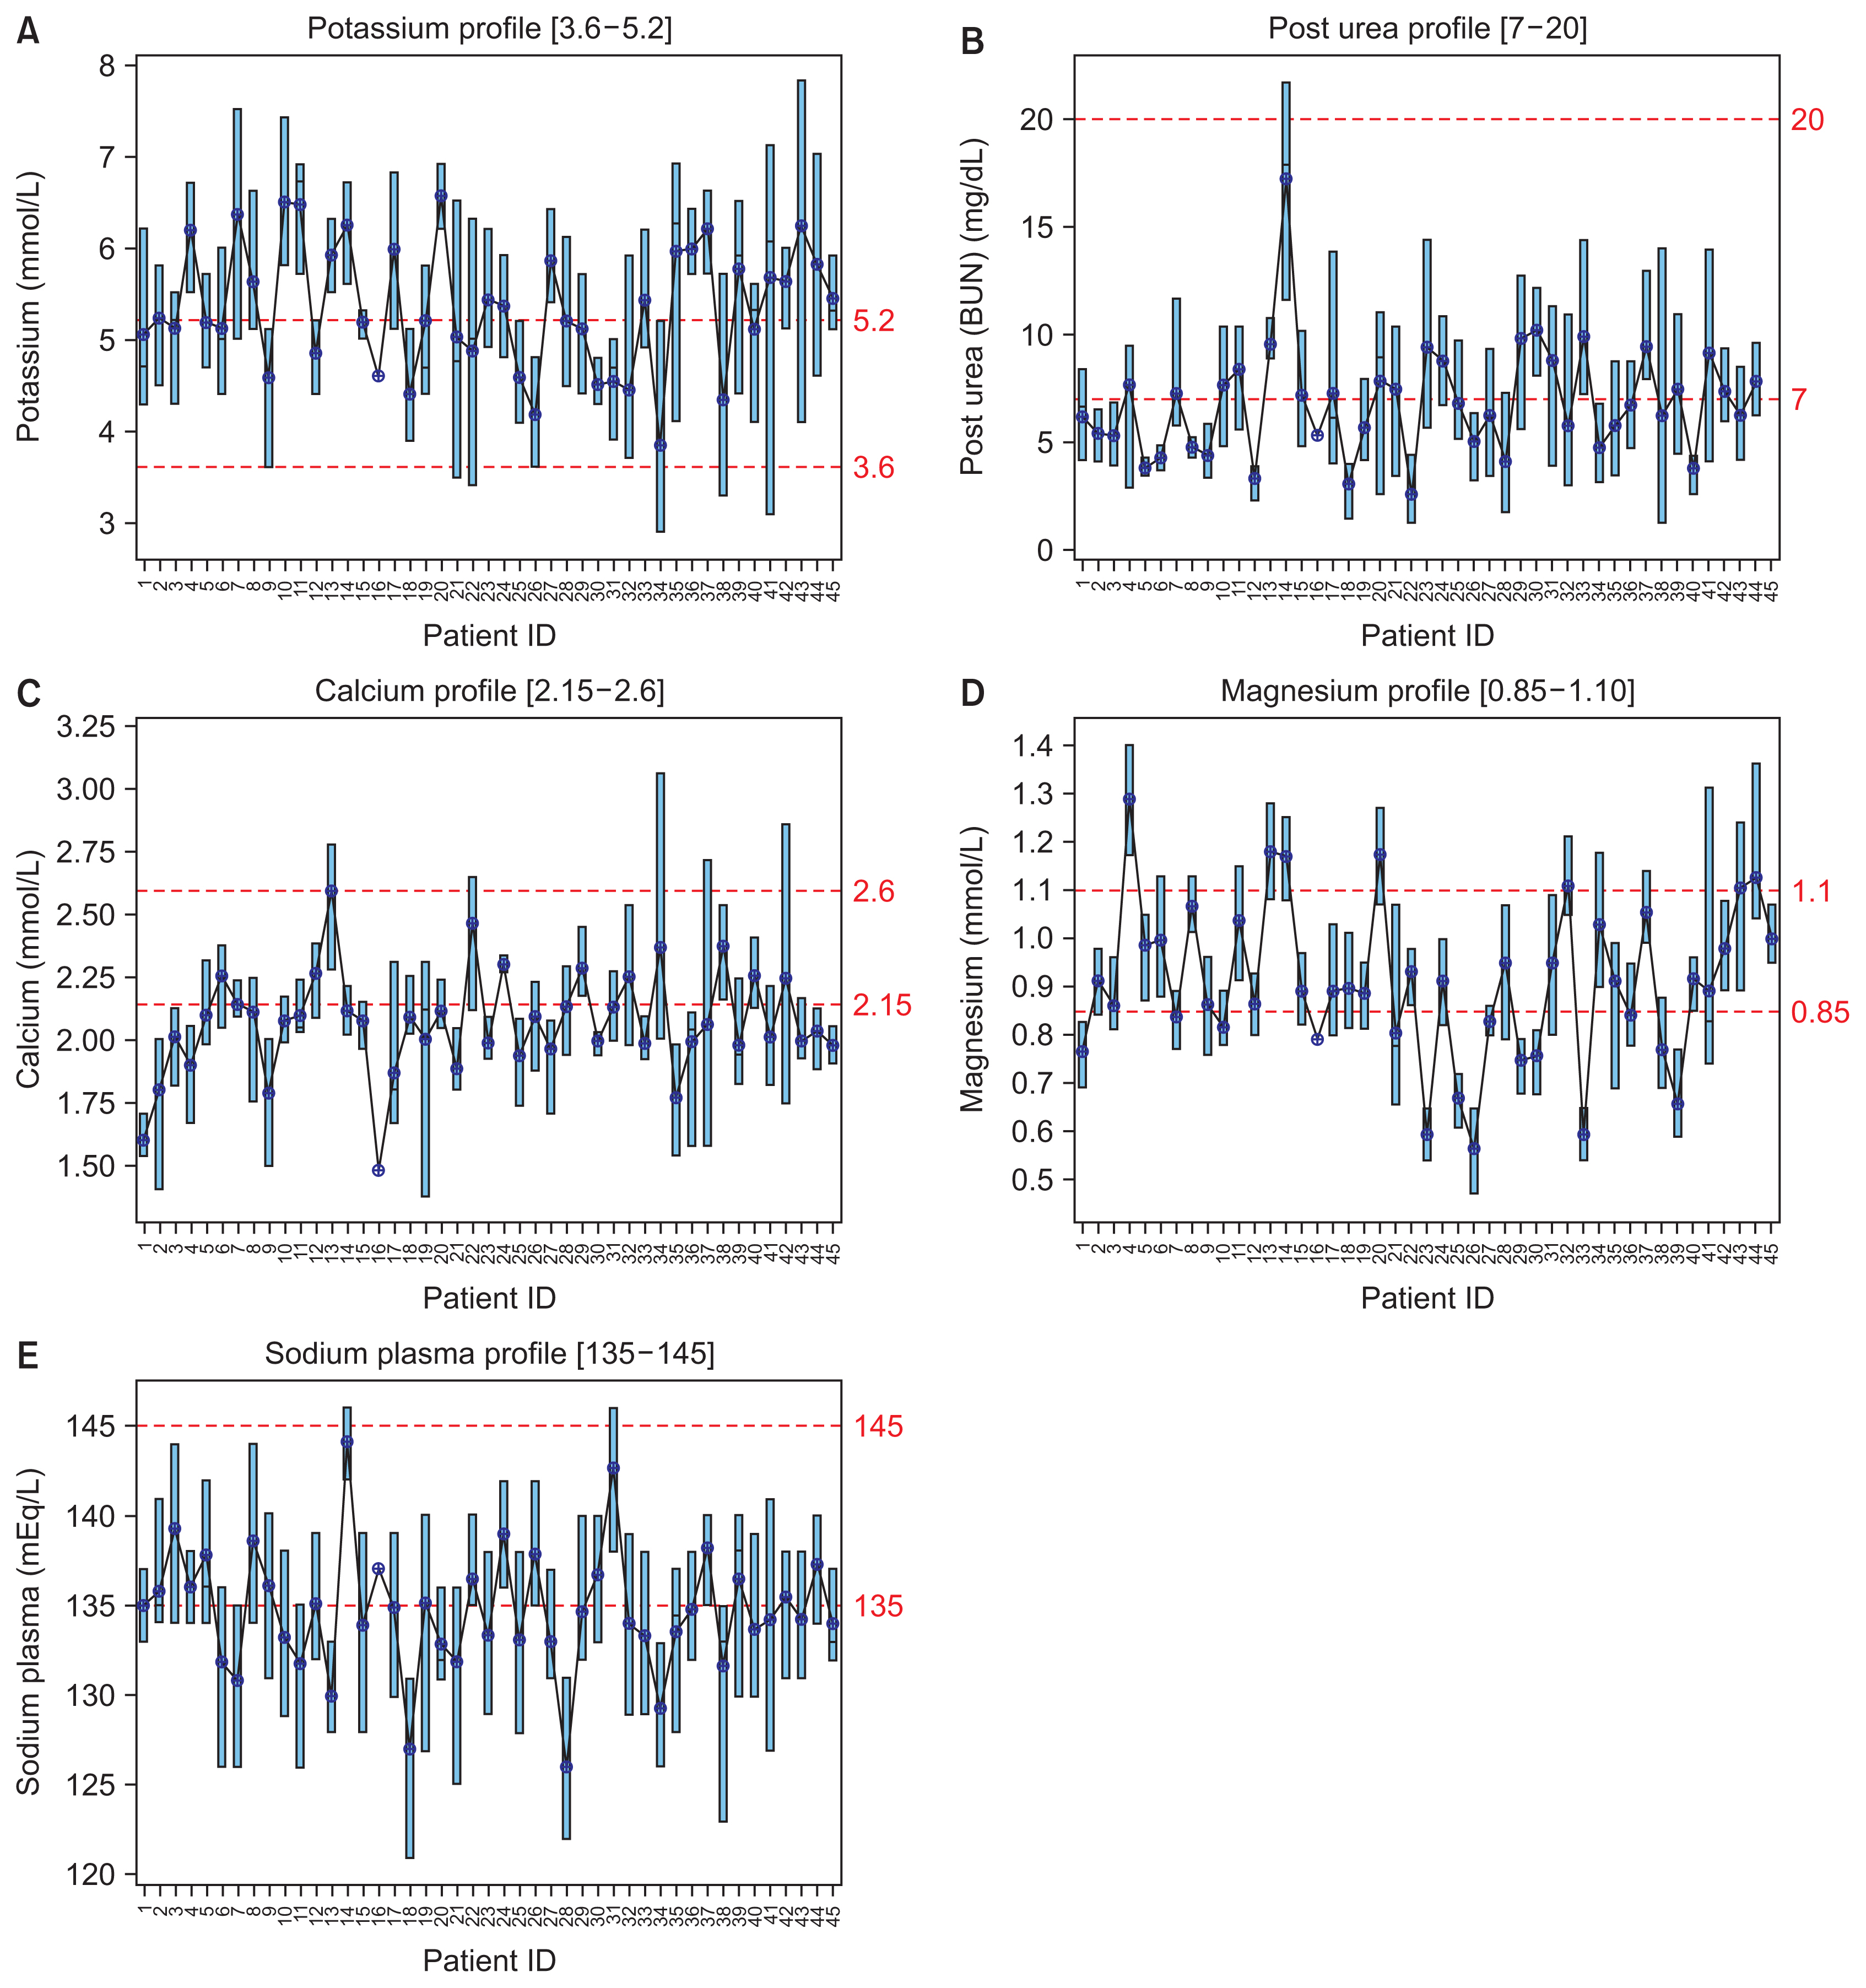
Figure 3 Boxplot electrolyte profiles of (A) potassium, (B) post-dialysis urea, (C) calcium, (D) magnesium, and (E) plasma sodium. Illustration of variability of electrolytes from patient to patient.
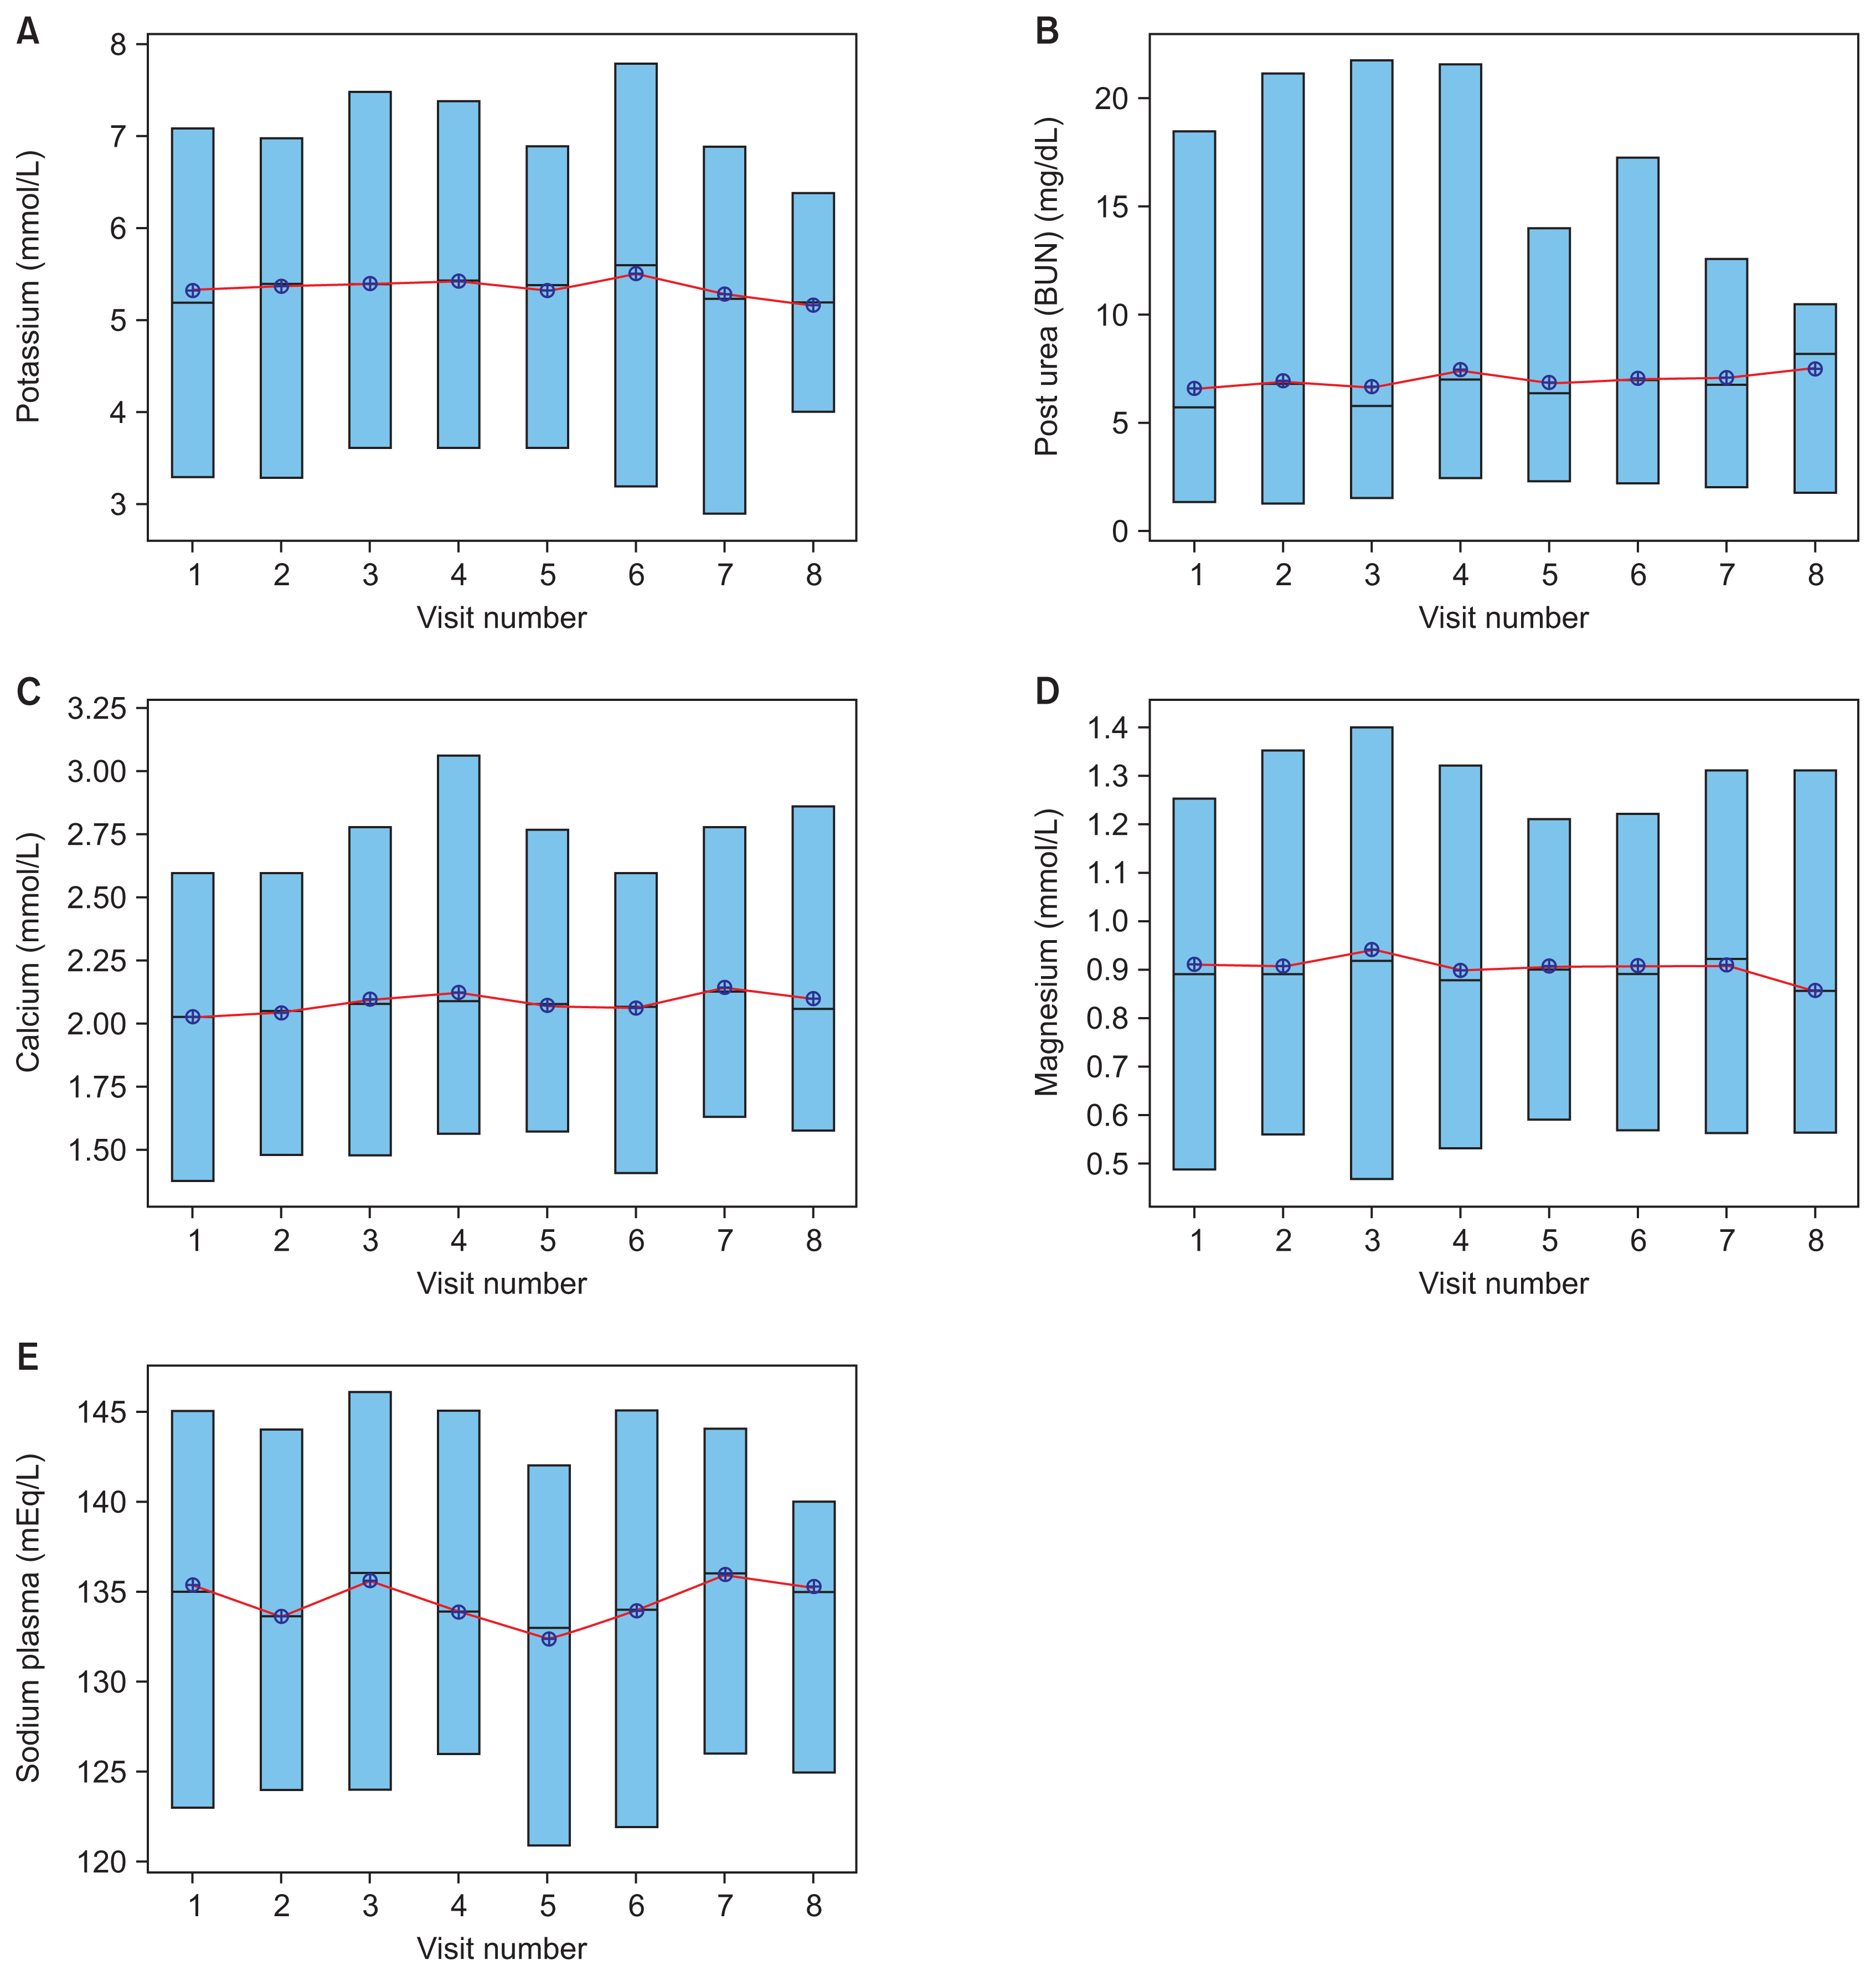
Figure 4 Boxplot time-lapses of (A) potassium, (B) post-dialysis urea, (C) calcium, (D) magnesium, and (E) plasma sodium. Representation of electrolyte variables as a range for all patients.

Figure 5 Most significant electrolyte predictor attributes. These attributes had an impact on predicting certain electrolytes and their relative significance. LR: linear regression, DT: decision tree, SVM: support vector machine, NN: neural network.
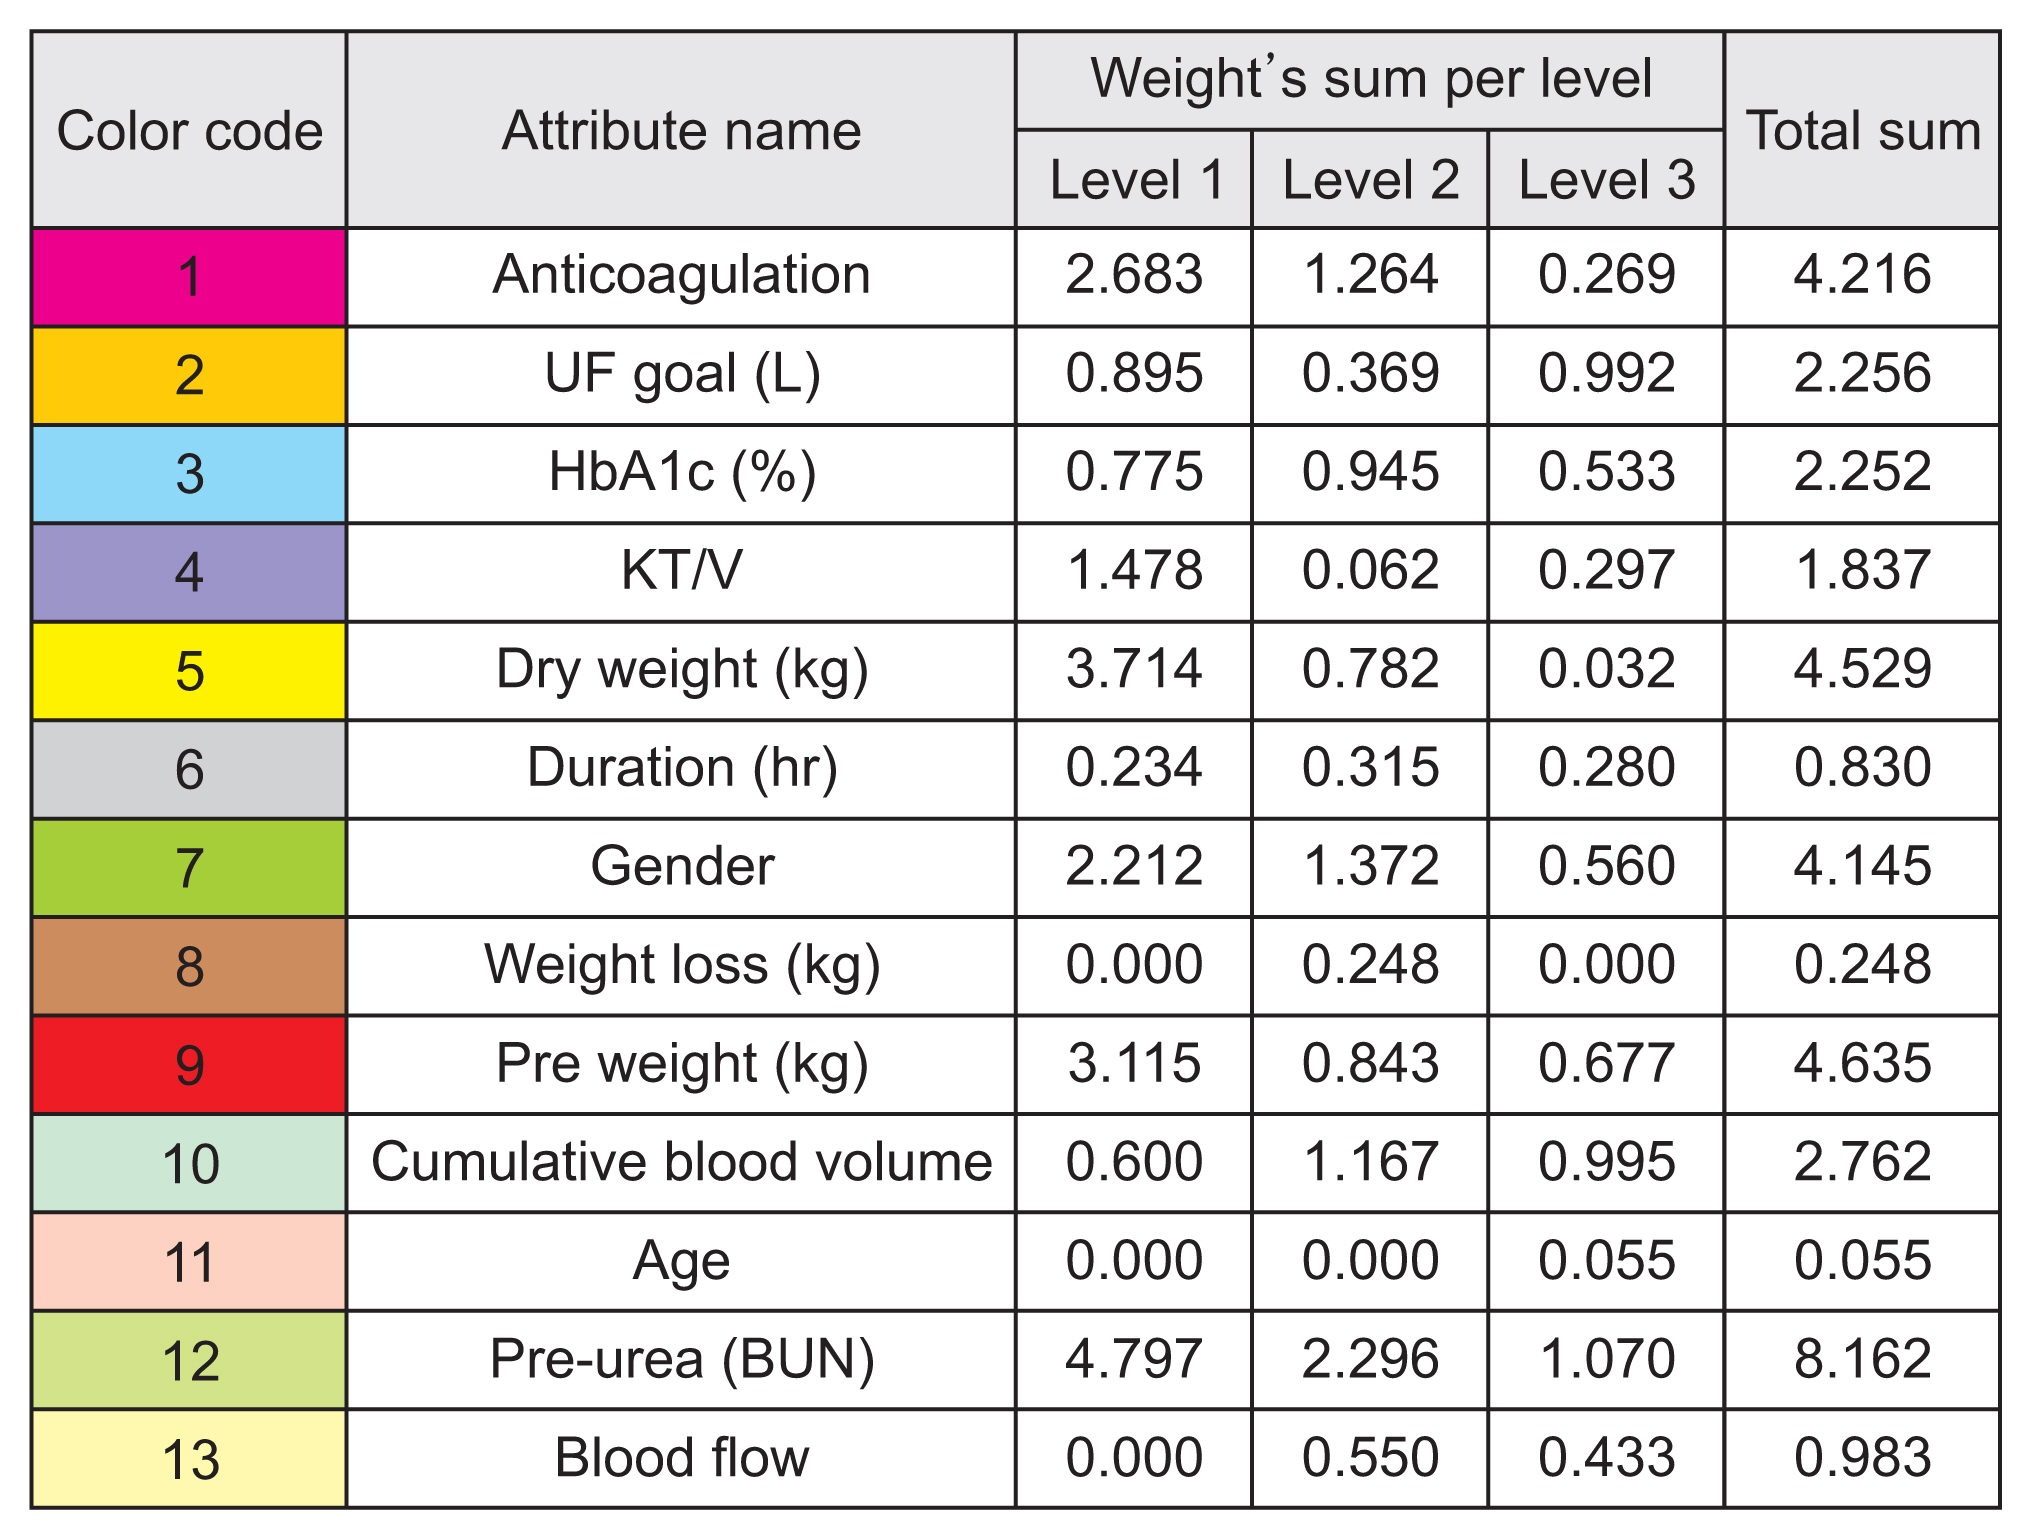
Figure 6 Weighted table for input attributes according to the level of significance.
Reference
-
References
1. GBD Chronic Kidney Disease Collaboration. Global, regional, and national burden of chronic kidney disease, 1990–2017: a systematic analysis for the Global Burden of Disease Study 2017. Lancet. 2020; 395(10225):709–733. https://doi.org/10.1016/S0140-6736(20)30045-3.2. Chaudhary SB. Free dialysis for underprivileged kidney patients in UAE [Internet]. Dubai, UAE: Gulf News;2019. [cited at 2023 Mar 30]. Available from: https://gulfnews.com/uae/health/free-dialysis-for-underprivileged-kidney-patients-in-uae-1.61500736.3. Barbieri C, Cattinelli I, Neri L, Mari F, Ramos R, Brancaccio D, et al. Development of an artificial intelligence model to guide the management of blood pressure, fluid volume, and dialysis dose in end-stage kidney disease patients: proof of concept and first clinical assessment. Kidney Dis (Basel). 2019; 5(1):28–33. https://doi.org/10.1159/000493479.
Article4. Samarrai F. Dialysis drug dosing improved by using big data analytics [Internet]. Charlottesville (VA): University of Virginia;2019. [cited at 2023 Mar 30]. Available from: https://news.med.virginia.edu/blog/dialysis-drug-dosing-improved-by-using-big-data-analytics/.5. Welsh ET. Incremental dialysis may help maintain residual renal function, improve quality of life [Internet]. Thorofare (NJ): Healio News;2020. [cited at 2023 Mar 30]. Available from: https://www.healio.com/news/nephrology/20200225/incremental-dialysis-may-help-maintain-residual-renal-function-improve-quality-of-life.6. Nuemann ME. ADC keynote: big data in ESRD can be used to improve outcomes, but ties to policy may be troublesome [Internet]. Thorofare (NJ): Healio News;2019. [cited at 2023 Mar 30]. Available from: https://www.healio.com/news/nephrology/20190329/adc-keynote-big-data-in-esrd-can-be-used-to-improve-outcomes-but-ties-to-policy-may-be-troublesome.7. Perl J, Dember LM, Bargman JM, Browne T, Charytan DM, Flythe JE, et al. The use of a multidimensional measure of dialysis adequacy-moving beyond small solute kinetics. Clin J Am Soc Nephrol. 2017; 12(5):839–47. https://doi.org/10.2215/CJN.08460816.
Article8. Kusiak A, Dixon B, Shah S. Predicting survival time for kidney dialysis patients: a data mining approach. Comput Biol Med. 2005; 35(4):311–27. https://doi.org/10.1016/j.compbiomed.2004.02.004.
Article9. Banerjee A, Noor A, Siddiqua N, Uddin MN. Significance of attribute selection in the classification of chronic renal disease. In : Proceedings of 2019 2nd International Conference on Advanced Computational and Communication Paradigms (ICACCP); 2019 Feb 25–28; Gangtok, India. p. 1–6. https://doi.org/10.1109/ICACCP.2019.8882937.
Article10. National Kidney Foundation. KDOQI clinical practice guideline for hemodialysis adequacy: 2015 update. Am J Kidney Dis. 2015; 66(5):884–930. https://doi.org/10.1053/j.ajkd.2015.07.015.11. Belle A, Thiagarajan R, Soroushmehr SM, Navidi F, Beard DA, Najarian K. Big data analytics in healthcare. Biomed Res Int. 2015; 2015:370194. https://doi.org/10.1155/2015/370194.
Article12. Hueso M, de Haro L, Calabia J, Dal-Re R, Tebe C, Gibert K, et al. Leveraging data science for a personalized haemodialysis. Kidney Dis (Basel). 2020; 6(6):385–94. https://doi.org/10.1159/000507291.
Article13. Wickramasinghe MP, Perera DM, Kahandawaarachchi KA. Dietary prediction for patients with chronic kidney disease (CKD) by considering blood potassium level using machine learning algorithms. In : Proceedings of 2017 IEEE Life Sciences Conference (LSC); 2017 Dec 13–15; Sydney, Australia. p. 300–3. https://doi.org/10.1109/LSC.2017.8268202.
Article14. Maurya A, Wable R, Shinde R, John S, Jadhav R, Dakshayani R. Chronic kidney disease prediction and recommendation of suitable diet plan by using machine learning. In : Proceedings of 2019 International Conference on Nascent Technologies in Engineering (ICNTE); 2019 Jan 4–5; Navi Mumbai, India. p. 1–4. https://doi.org/10.1109/ICNTE44896.2019.8946029.
Article15. Amirgaliyev Y, Shamiluulu S, Serek A. Analysis of chronic kidney disease dataset by applying machine learning methods. In : Proceedings of 2018 IEEE 12th International Conference on Application of Information and Communication Technologies (AICT); 2018 Oct 17–19; Almaty, Kazakhstan. p. 1–4. https://doi.org/10.1109/ICAICT.2018.8747140.
Article16. Makino M, Yoshimoto R, Ono M, Itoko T, Katsuki T, Koseki A, et al. Artificial intelligence predicts the progression of diabetic kidney disease using big data machine learning. Sci Rep. 2019; 9(1):11862. https://doi.org/10.1038/s41598-019-48263-5.
Article17. Ishan D. Demystifying support vector machine, part I [Internet]. San Francisco (CA): Medium;2020. [cited at 2023 Mar 30]. Available from: https://medium.com/swlh/demystifying-support-vector-machine-part-ib5b083844c9a.18. Madhuresh K. Regression Analysis: linear regression, SSE, assumption of linear regression error term and best fit line [Internet]. [place unknown]: WordPress;2015. [cited at 2023 Mar 30]. Available from: https://madhureshkumar.wordpress.com/2015/07/21/regression-analysis-linear-regression-sse-assumption-of-linear-regression-error-term-and-best-fit-line/.
- Full Text Links
-
- Actions
-
Cited
- CITED
-
- Close
- Share
-
- Similar articles
-
- Predictive Analytics in Spine Oncology Research: First Steps, Limitations, and Future Directions
- Finding Pluto: An Analytics-Based Approach to Safety Data Ecosystems
- Book Review: Data-Driven Healthcare & Analytics in a Big Data World
- Clinical research using medical big data
- Pediatric Cancer Research using Healthcare Big Data
