Cancer Res Treat.
2023 Jan;55(1):231-244. 10.4143/crt.2021.1526.
PD-L1 Upregulation by the mTOR Pathway in VEGFR-TKI–Resistant Metastatic Clear Cell Renal Cell Carcinoma
- Affiliations
-
- 1Department of Pathology, Asan Medical Center, University of Ulsan College of Medicine, Seoul, Korea
- 2Department of Pathology, Gangnam Severance Hospital, Yonsei University College of Medicine, Seoul, Korea
- 3Department of Oncology, Asan Medical Center, University of Ulsan College of Medicine, Seoul, Korea
- 4AI Recommendation, T3K, SK Telecom, Seoul, Korea
- KMID: 2538007
- DOI: http://doi.org/10.4143/crt.2021.1526
Abstract
- Purpose
Tyrosine kinase inhibitors (TKI) targeting vascular endothelial growth factor receptor (VEGFR) signaling pathways have been used for metastatic clear cell renal cell carcinoma (mCCRCC), but resistance to the drug develops in most patients. We aimed to explore the underlying mechanism of the TKI resistance with regard to programmed death-ligand 1 (PD-L1) and to investigate signaling pathway associated with the resistant mechanism.
Materials and Methods
To determine the mechanism of resistance, 10 mCCRCC patients from whom tumor tissues were harvested at both the pretreatment and the TKI-resistant post-treatment period were included as the discovery cohort, and their global gene expression profiles were compared. A TKI-resistant renal cancer cell line was established by long-term treatment with sunitinib.
Results
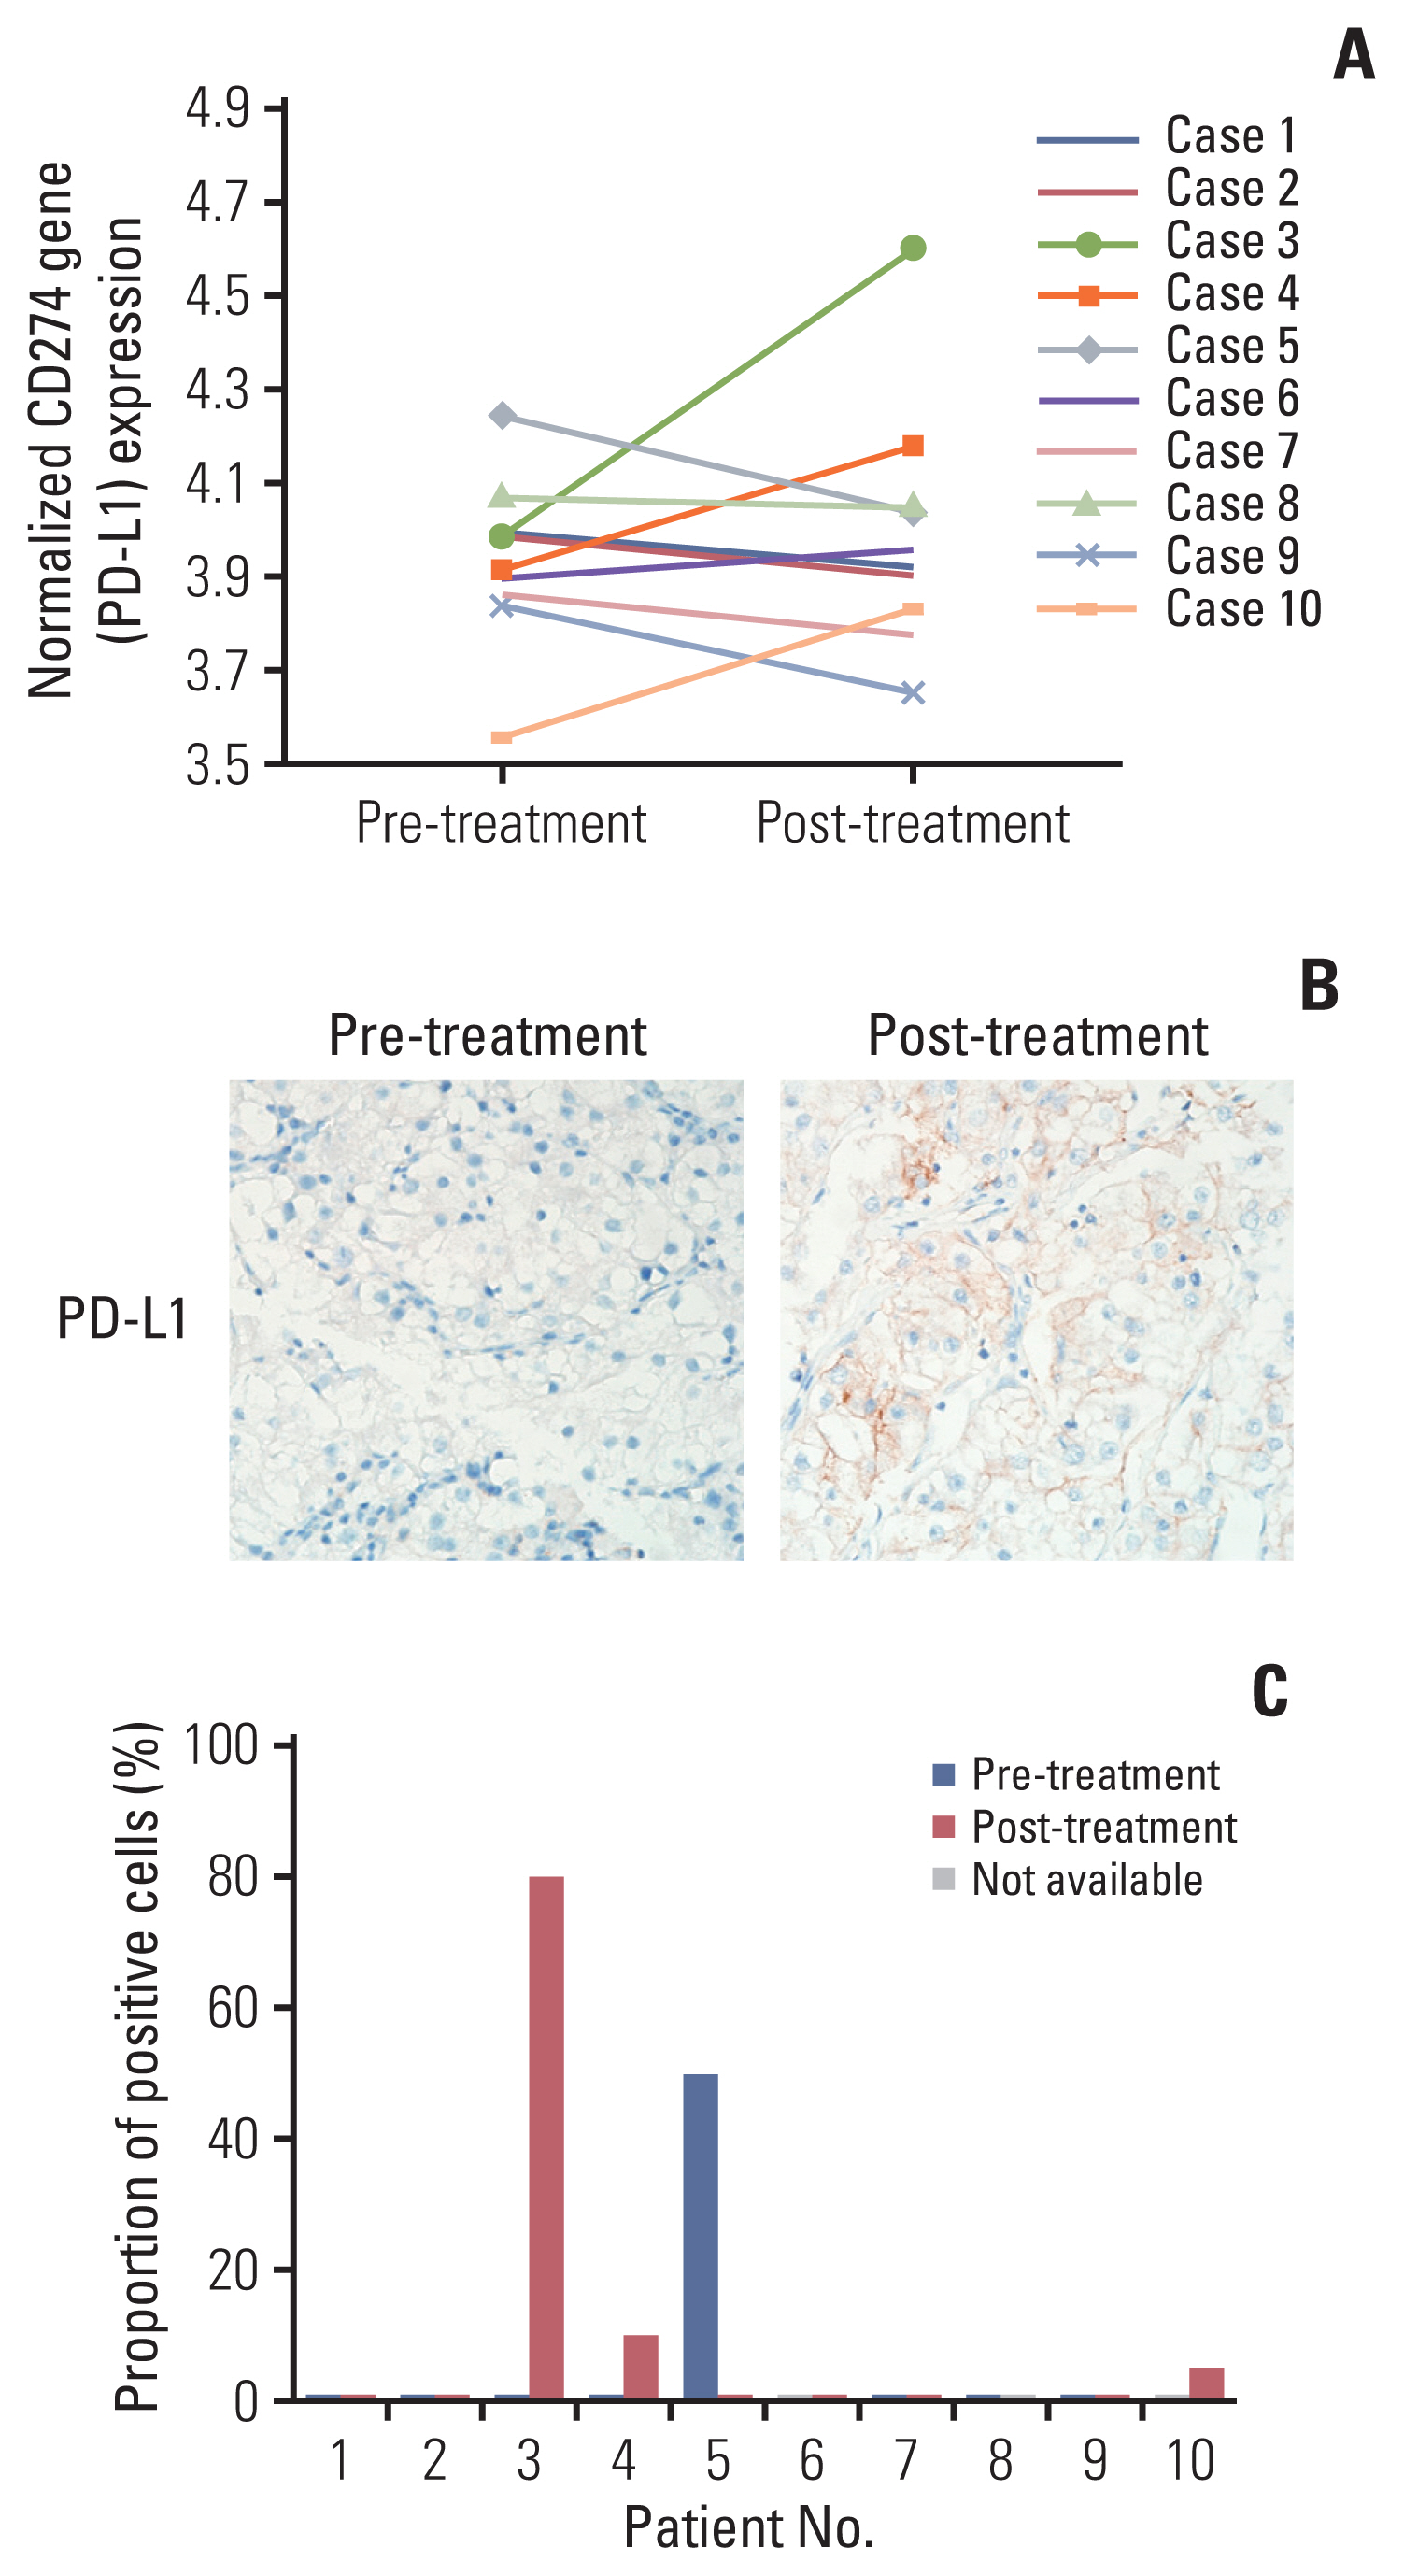
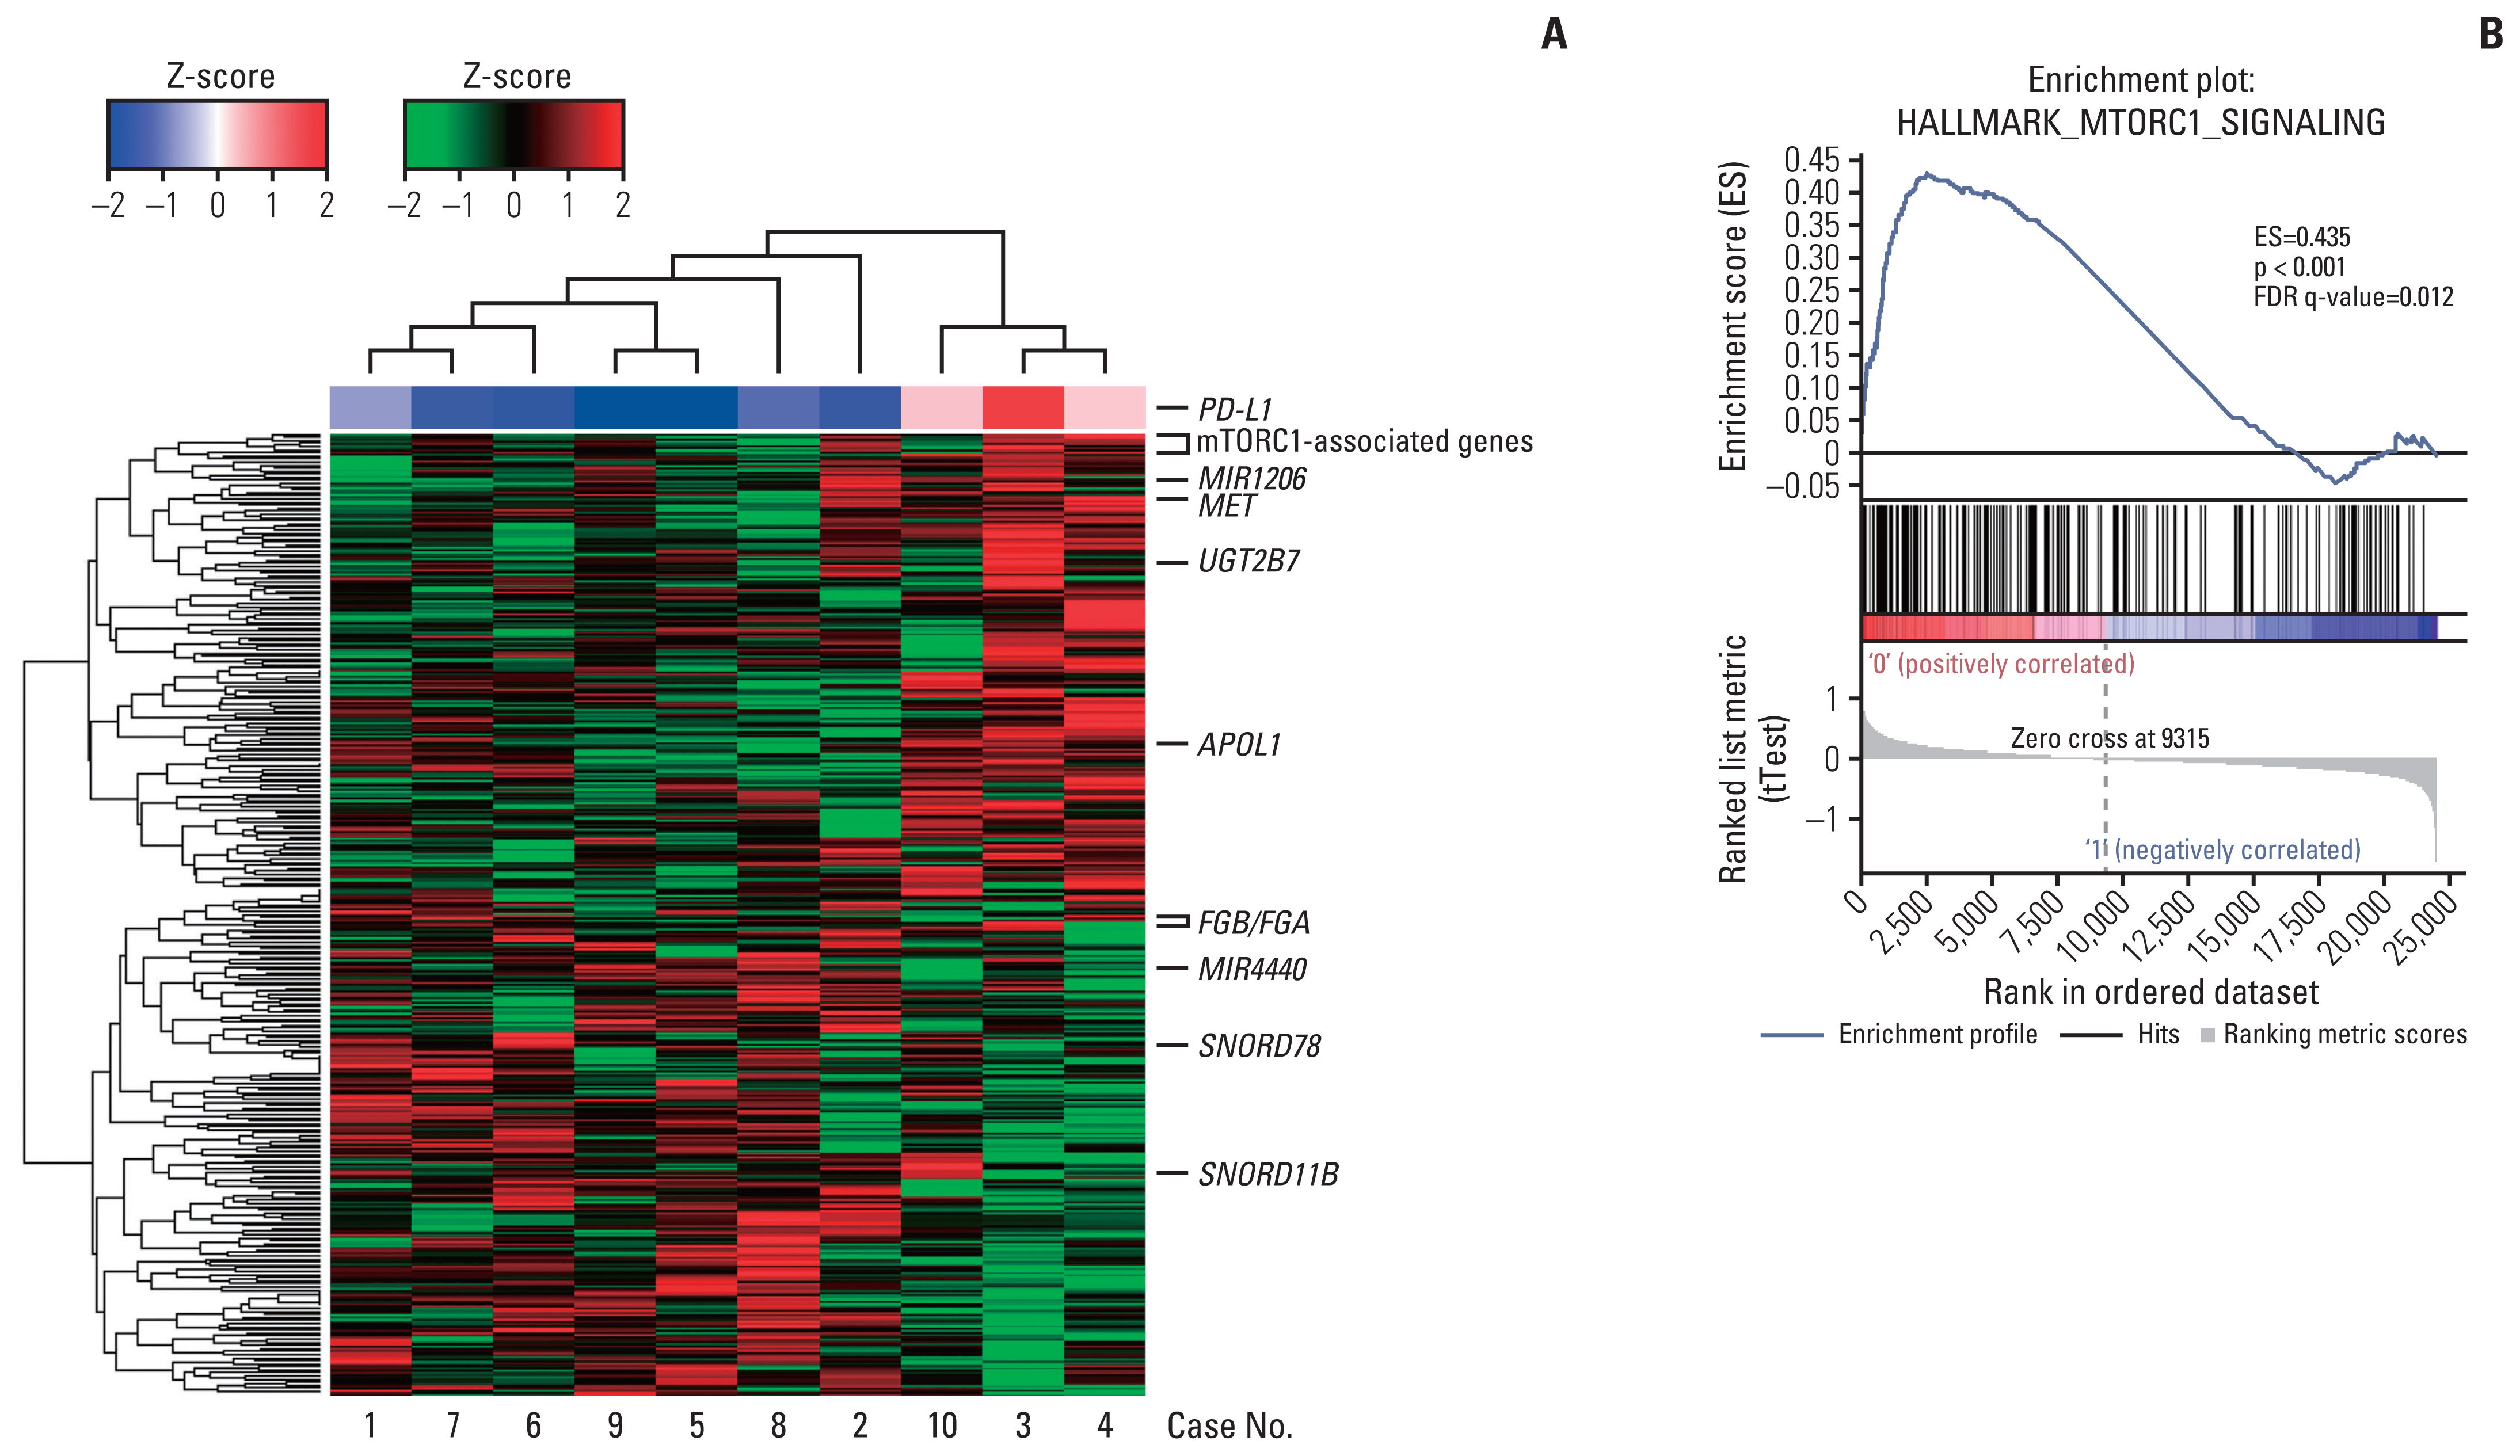
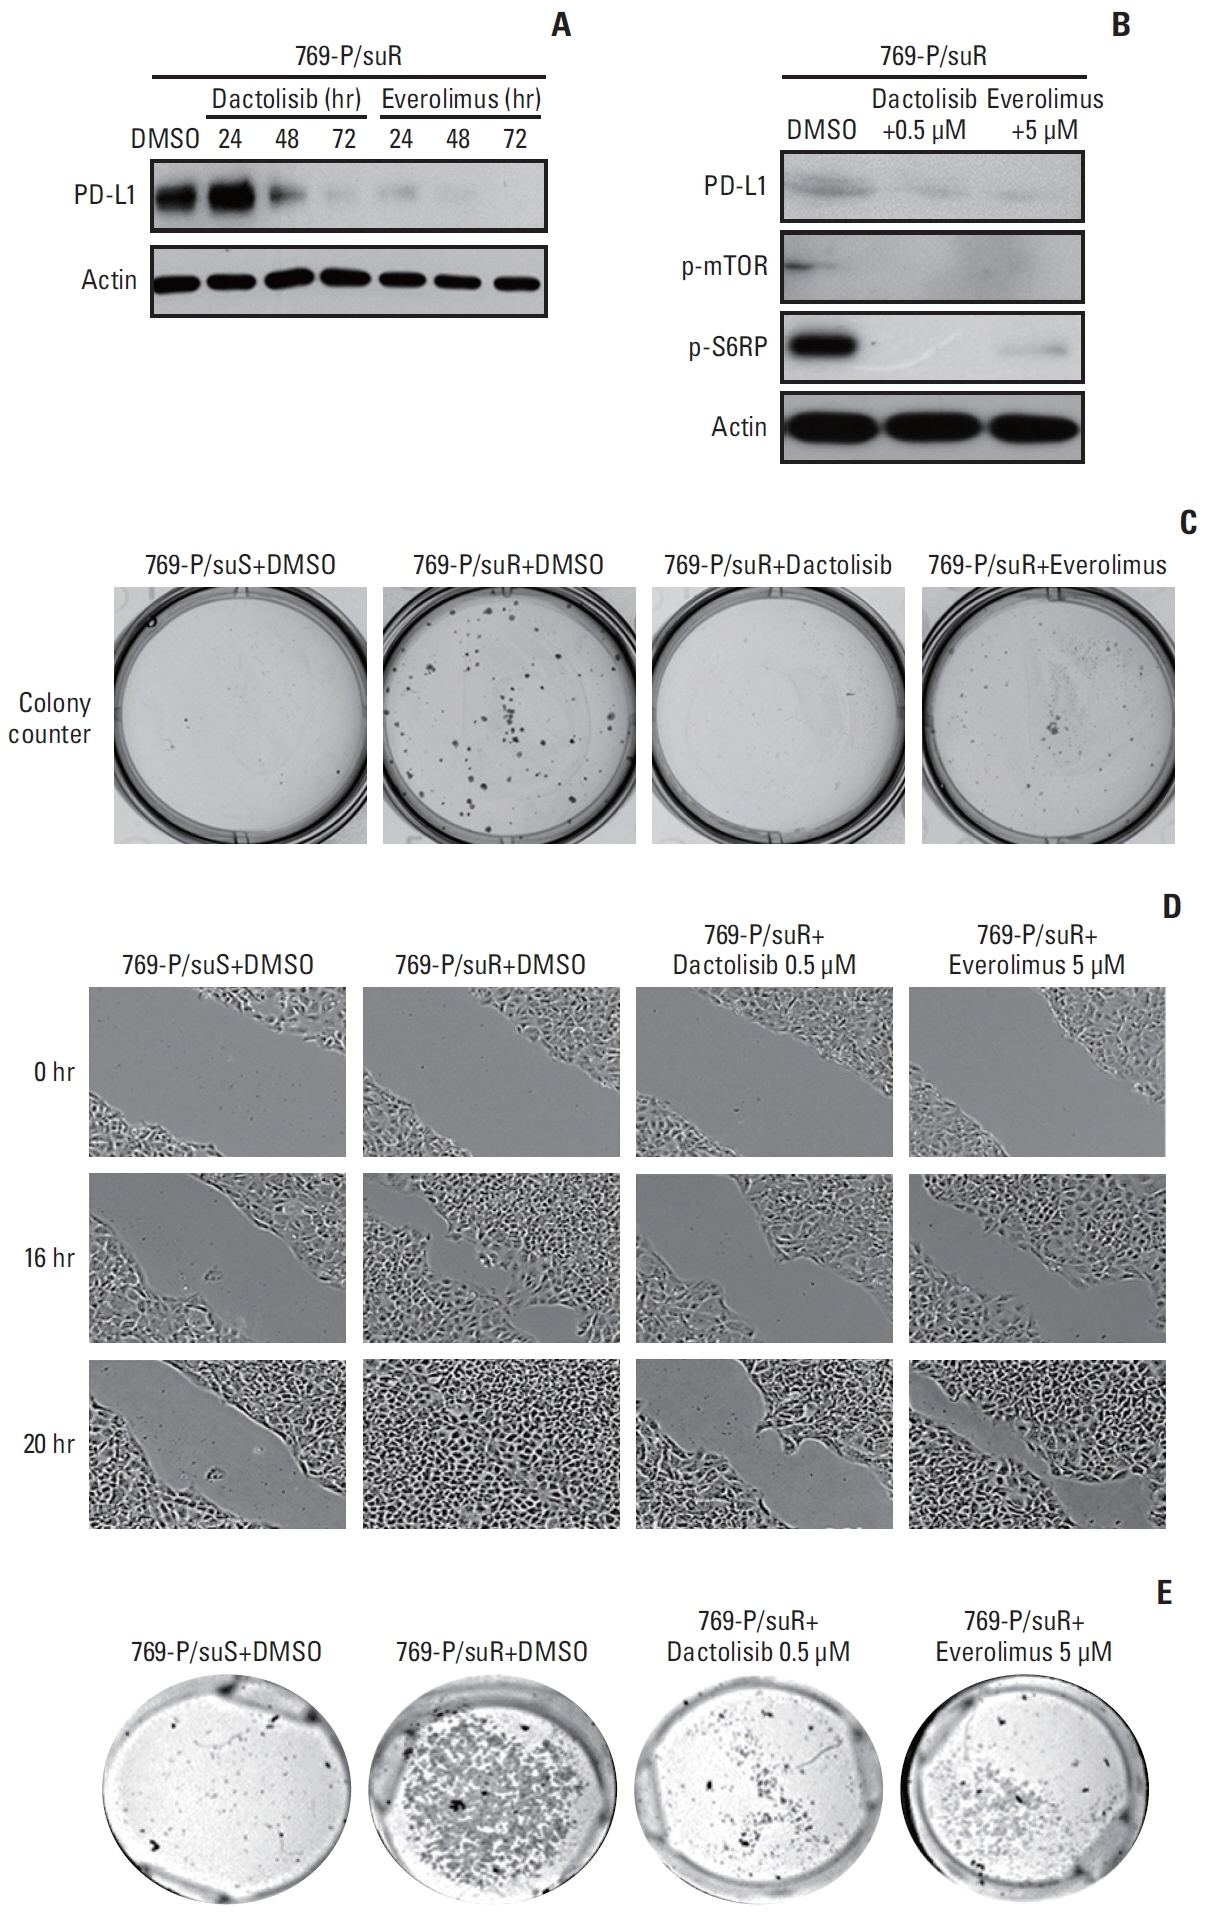
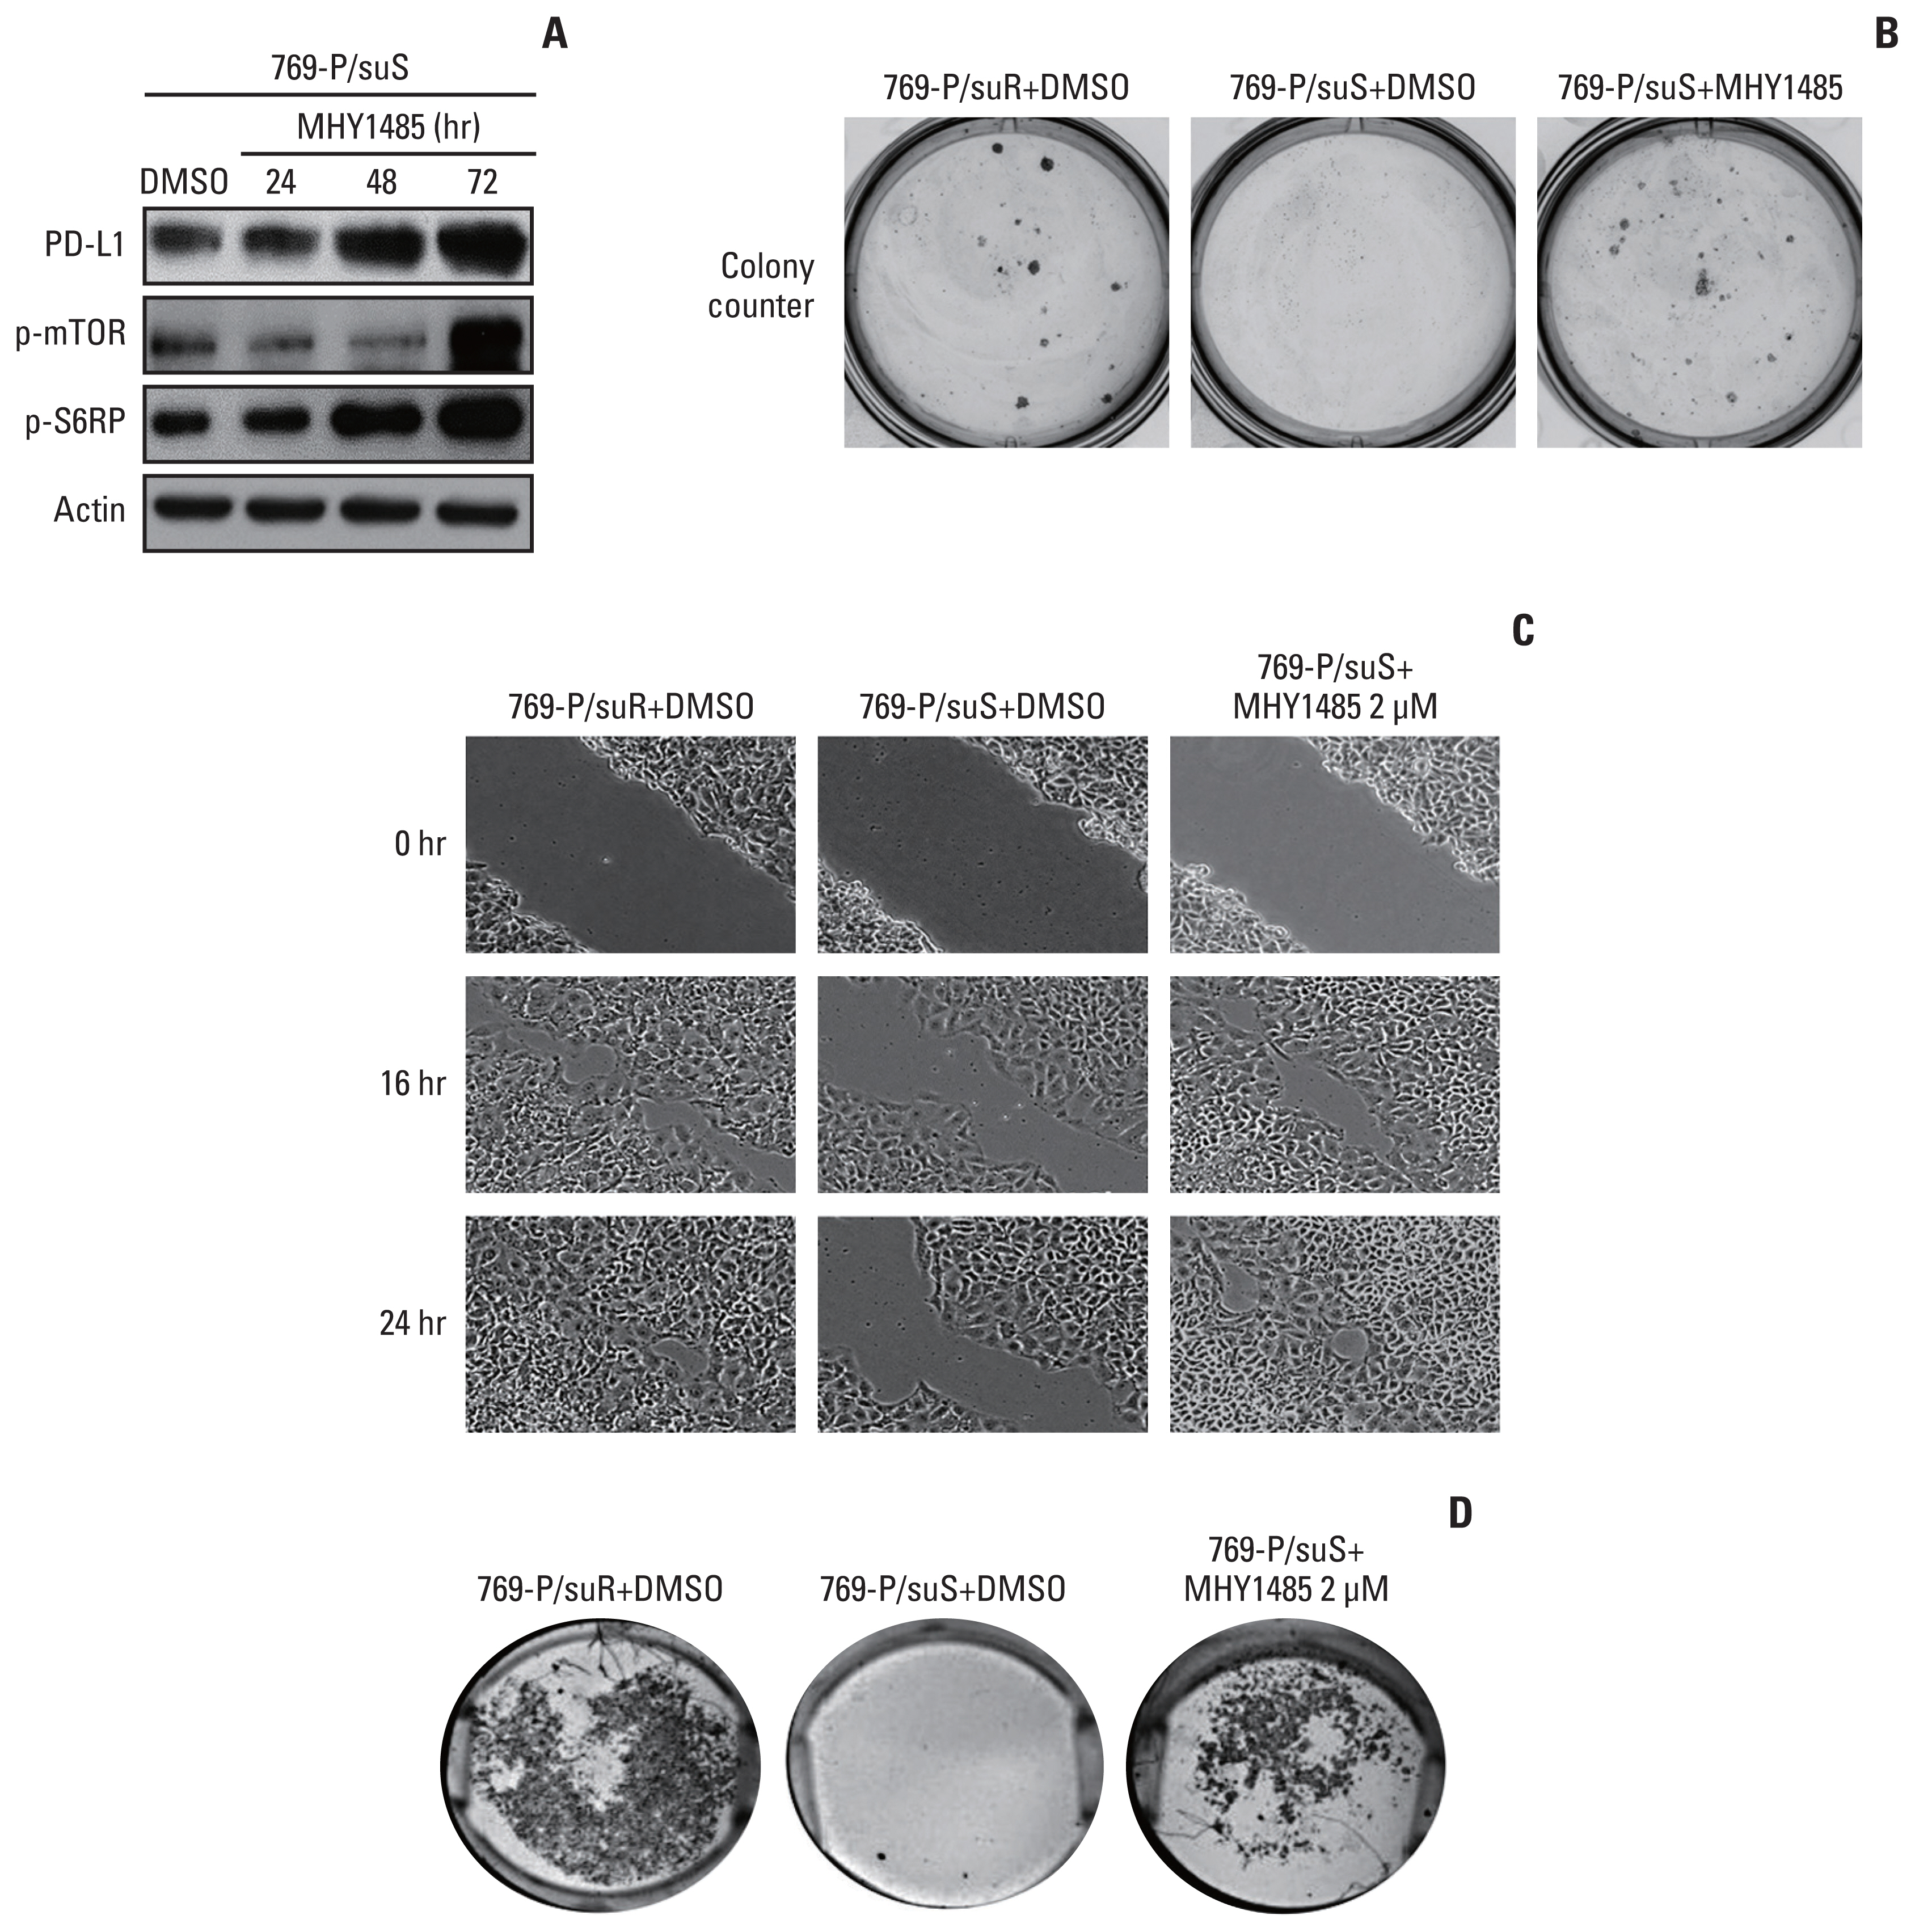
Among differentially expressed genes in the discovery cohort, increased PD-L1 expression in post-treatment tissues was noted in four patients. Pathway analysis showed that PD-L1 expression was positively correlated with the mammalian target of rapamycin (mTOR) signaling pathway. The TKI-resistant renal cancer cells showed increased expression of PD-L1 and mTOR signaling proteins and demonstrated aggressive tumoral behaviour. Treatment with mTOR inhibitors down-regulated PD-L1 expression and suppressed aggressive tumoral behaviour, which was reversed with stimulation of the mTOR pathway.
Conclusion
These results showed that PD-L1 expression may be increased in a subset of VEGFR-TKI–resistant mCCRCC patients via the mTOR pathway.
Keyword
Figure
Reference
-
References
1. Moch H, Cubilla AL, Humphrey PA, Reuter VE, Ulbright TM. The 2016 WHO classification of tumours of the urinary system and male genital organs-part A: renal, penile, and testicular tumours. Eur Urol. 2016; 70:93–105.2. Morais C. Sunitinib resistance in renal cell carcinoma. J Kidney Cancer VHL. 2014; 1:1–11.3. Motzer RJ, Hutson TE, Tomczak P, Michaelson MD, Bukowski RM, Rixe O, et al. Sunitinib versus interferon alfa in metastatic renal-cell carcinoma. N Engl J Med. 2007; 356:115–24.4. Liu Y, Cheng G, Huang Z, Bao L, Liu J, Wang C, et al. Long noncoding RNA SNHG12 promotes tumour progression and sunitinib resistance by upregulating CDCA3 in renal cell carcinoma. Cell Death Dis. 2020; 11:515.5. Hayashi H, Nakagawa K. Combination therapy with PD-1 or PD-L1 inhibitors for cancer. Int J Clin Oncol. 2020; 25:818–30.6. Keir ME, Butte MJ, Freeman GJ, Sharpe AH. PD-1 and its ligands in tolerance and immunity. Annu Rev Immunol. 2008; 26:677–704.7. McDermott DF, Lee JL, Ziobro M, Suarez C, Langiewicz P, Matveev VB, et al. Open-label, single-arm, phase II study of pembrolizumab monotherapy as first-line therapy in patients with advanced non-clear cell renal cell carcinoma. J Clin Oncol. 2021; 39:1029–39.8. Aggen DH, Drake CG, Rini BI. Targeting PD-1 or PD-L1 in metastatic kidney cancer: combination therapy in the first-line setting. Clin Cancer Res. 2020; 26:2087–95.9. Bedke J, Albiges L, Capitanio U, Giles RH, Hora M, Lam TB, et al. The 2021 updated European Association of Urology guidelines on renal cell carcinoma: immune checkpoint inhibitor-based combination therapies for treatment-naive metastatic clear-cell renal cell carcinoma are standard of care. Eur Urol. 2021; 80:393–7.10. Smyth GK. Limma: linear models for microarray data. Gentleman R, Carey VJ, Huber W, Irizarry RA, Dudoit S, editors. Bioinformatics and computational biology solutions using R and bioconductor. New York, NY: Springer;2005. p. 397–420.11. Lee KS, Choe G, Yun S, Lee K, Moon S, Lee S, et al. Comparative analysis of programmed cell death ligand 1 assays in renal cell carcinoma. Histopathology. 2020; 77:67–78.12. Juengel E, Kim D, Makarevic J, Reiter M, Tsaur I, Bartsch G, et al. Molecular analysis of sunitinib resistant renal cell carcinoma cells after sequential treatment with RAD001 (everolimus) or sorafenib. J Cell Mol Med. 2015; 19:430–41.13. Juengel E, Dauselt A, Makarevic J, Wiesner C, Tsaur I, Bartsch G, et al. Acetylation of histone H3 prevents resistance development caused by chronic mTOR inhibition in renal cell carcinoma cells. Cancer Lett. 2012; 324:83–90.14. Roulin D, Waselle L, Dormond-Meuwly A, Dufour M, Demartines N, Dormond O. Targeting renal cell carcinoma with NVP-BEZ235, a dual PI3K/mTOR inhibitor, in combination with sorafenib. Mol Cancer. 2011; 10:90.15. Choi YJ, Park YJ, Park JY, Jeong HO, Kim DH, Ha YM, et al. Inhibitory effect of mTOR activator MHY1485 on autophagy: suppression of lysosomal fusion. PLoS One. 2012; 7:e43418.16. Hermann RM, Wolff HA, Jarry H, Thelen P, Gruendker C, Rave-Fraenk M, et al. In vitro studies on the modification of low-dose hyper-radiosensitivity in prostate cancer cells by incubation with genistein and estradiol. Radiat Oncol. 2008; 3:19.17. Kumar V, Wollner C, Kurth T, Bukowy JD, Cowley AW Jr. Inhibition of mammalian target of rapamycin complex 1 attenuates salt-induced hypertension and kidney injury in Dahl salt-sensitive rats. Hypertension. 2017; 70:813–21.18. Leung DW, Cachianes G, Kuang WJ, Goeddel DV, Ferrara N. Vascular endothelial growth factor is a secreted angiogenic mitogen. Science. 1989; 246:1306–9.19. Ellis LM, Hicklin DJ. VEGF-targeted therapy: mechanisms of anti-tumour activity. Nat Rev Cancer. 2008; 8:579–91.20. Barr MP, Bouchier-Hayes DJ, Harmey JJ. Vascular endothelial growth factor is an autocrine survival factor for breast tumour cells under hypoxia. Int J Oncol. 2008; 32:41–8.21. Lichtenberger BM, Tan PK, Niederleithner H, Ferrara N, Petzelbauer P, Sibilia M. Autocrine VEGF signaling synergizes with EGFR in tumor cells to promote epithelial cancer development. Cell. 2010; 140:268–79.22. Hamerlik P, Lathia JD, Rasmussen R, Wu Q, Bartkova J, Lee M, et al. Autocrine VEGF-VEGFR2-Neuropilin-1 signaling promotes glioma stem-like cell viability and tumor growth. J Exp Med. 2012; 209:507–20.23. Liu XD, Hoang A, Zhou L, Kalra S, Yetil A, Sun M, et al. Resistance to antiangiogenic therapy is associated with an immunosuppressive tumor microenvironment in metastatic renal cell carcinoma. Cancer Immunol Res. 2015; 3:1017–29.24. Iwenofu OH, Lackman RD, Staddon AP, Goodwin DG, Haupt HM, Brooks JS. Phospho-S6 ribosomal protein: a potential new predictive sarcoma marker for targeted mTOR therapy. Mod Pathol. 2008; 21:231–7.25. Voss MH, Molina AM, Motzer RJ. mTOR inhibitors in advanced renal cell carcinoma. Hematol Oncol Clin North Am. 2011; 25:835–52.26. Lastwika KJ, Wilson W 3rd, Li QK, Norris J, Xu H, Ghazarian SR, et al. Control of PD-L1 expression by oncogenic activation of the AKT-mTOR pathway in non-small cell lung cancer. Cancer Res. 2016; 76:227–38.27. Motzer RJ, Hutson TE, Glen H, Michaelson MD, Molina A, Eisen T, et al. Lenvatinib, everolimus, and the combination in patients with metastatic renal cell carcinoma: a randomised, phase 2, open-label, multicentre trial. Lancet Oncol. 2015; 16:1473–82.28. Carlsson J, Sundqvist P, Kosuta V, Falt A, Giunchi F, Fiorentino M, et al. PD-L1 expression is associated with poor prognosis in renal cell carcinoma. Appl Immunohistochem Mol Morphol. 2020; 28:213–20.29. Lavacchi D, Pellegrini E, Palmieri VE, Doni L, Mela MM, Di Maida F, et al. Immune checkpoint inhibitors in the treatment of renal cancer: current state and future perspective. Int J Mol Sci. 2020; 21:4691.30. Thompson RH, Gillett MD, Cheville JC, Lohse CM, Dong H, Webster WS, et al. Costimulatory B7-H1 in renal cell carcinoma patients: indicator of tumor aggressiveness and potential therapeutic target. Proc Natl Acad Sci U S A. 2004; 101:17174–9.31. Thompson RH, Dong H, Lohse CM, Leibovich BC, Blute ML, Cheville JC, et al. PD-1 is expressed by tumor-infiltrating immune cells and is associated with poor outcome for patients with renal cell carcinoma. Clin Cancer Res. 2007; 13:1757–61.32. Motzer RJ, Escudier B, McDermott DF, George S, Hammers HJ, Srinivas S, et al. Nivolumab versus everolimus in advanced renal-cell carcinoma. N Engl J Med. 2015; 373:1803–13.
- Full Text Links
- Actions
-
Cited
- CITED
-
- Close
- Share
- Similar articles
-
- A Case of Metastatic Renal Cell Carcinoma to the Gallbladder
- IFITM3-mediated activation of TRAF6/MAPK/AP-1 pathways induces acquired TKI resistance in clear cell renal cell carcinoma
- A Case of Renal Cell Carcinoma Metastatic to the Right Zygoma
- A Case of Renal Cell Carcinoma Metastatic to the Scalp
- Perineal Metastatic Clear Cell Renal Cell Carcinoma: A Case Report


