Clin Exp Otorhinolaryngol.
2021 Nov;14(4):382-389. 10.21053/ceo.2020.00563.
Korean Modification of the Nasal Provocation Test With House Dust Mite Antigen Following the EAACI Guidelines
- Affiliations
-
- 1Department of Otorhinolaryngology-Head and Neck Surgery, Inha University School of Medicine, Incheon, Korea
- KMID: 2522429
- DOI: http://doi.org/10.21053/ceo.2020.00563
Abstract
Objectives
. We evaluated the usefulness of the standardized nasal provocation test (NPT) protocol recently published by the European Academy of Allergy and Clinical Immunology (EAACI) and compared the utility of several parameters for diagnosing allergic rhinitis (AR) caused by house dust mites (HDM). Subjective parameters were nasal and ocular symptoms measured using a visual analog scale (VAS), and objective parameters were peak nasal inspiratory flow (PNIF), minimal cross-sectional area (MCA), and total nasal volume (TNV).
Methods
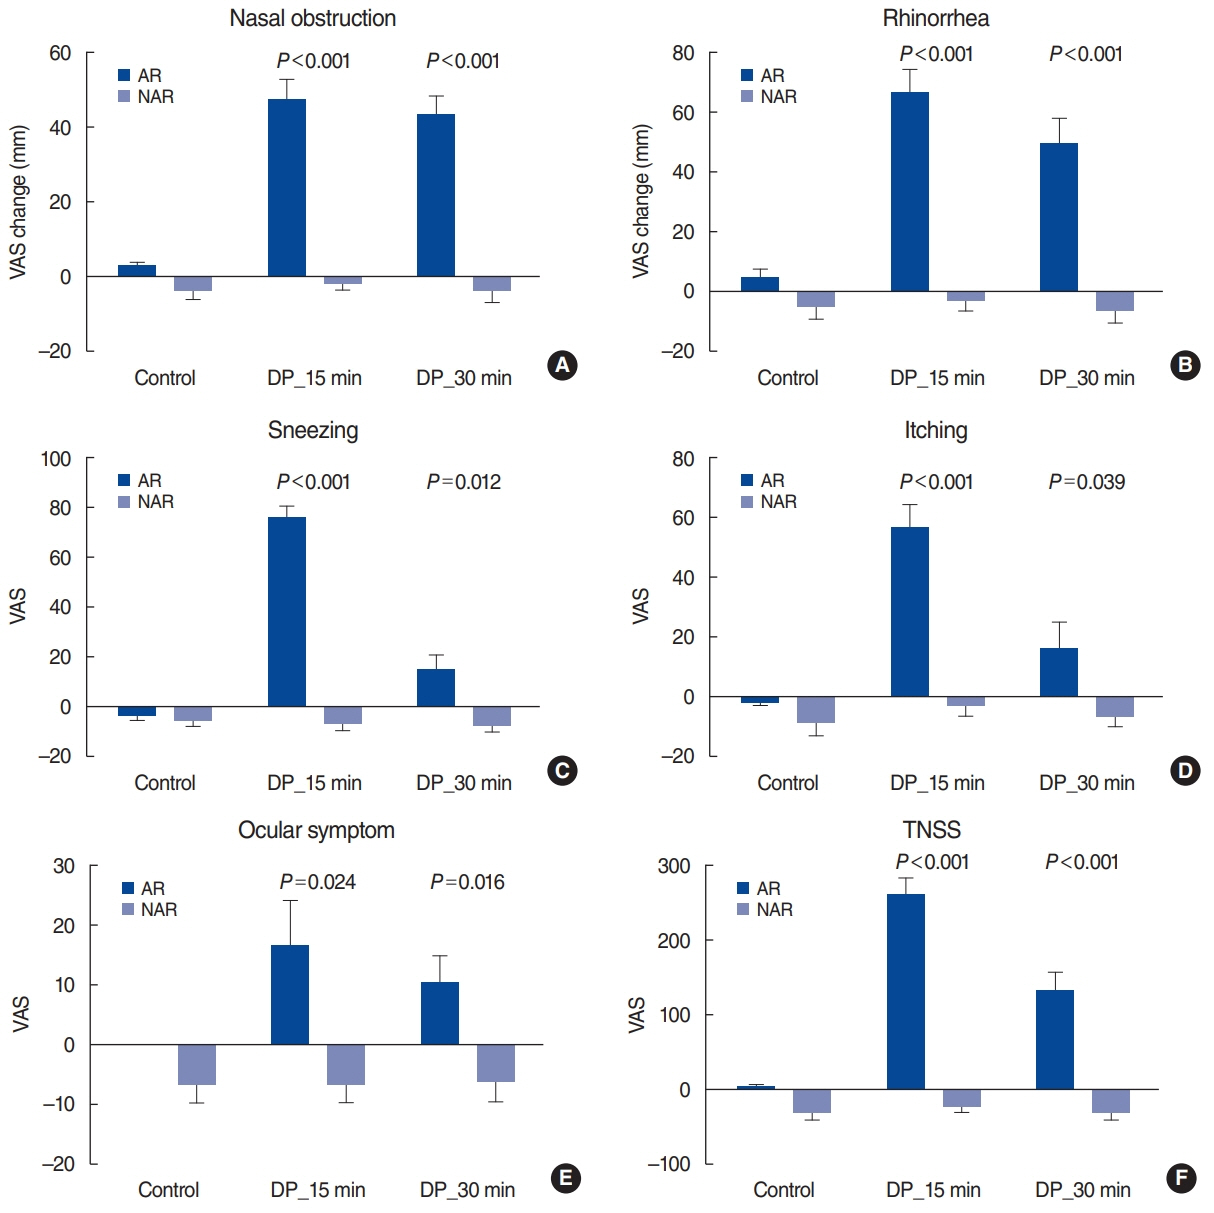
. Before and after spraying Dermatophagoides pteronyssinus (DP) allergen (1,000 AU/mL, 100 μL) into both nostrils of 13 patients with AR (AR group) and 22 patients with non-AR (NAR group), we used VAS scores to measure nasal symptoms (nasal obstruction, rhinorrhea, sneezing, and itching) and ocular symptoms and assessed PNIF, MCA, and TNV.
Results
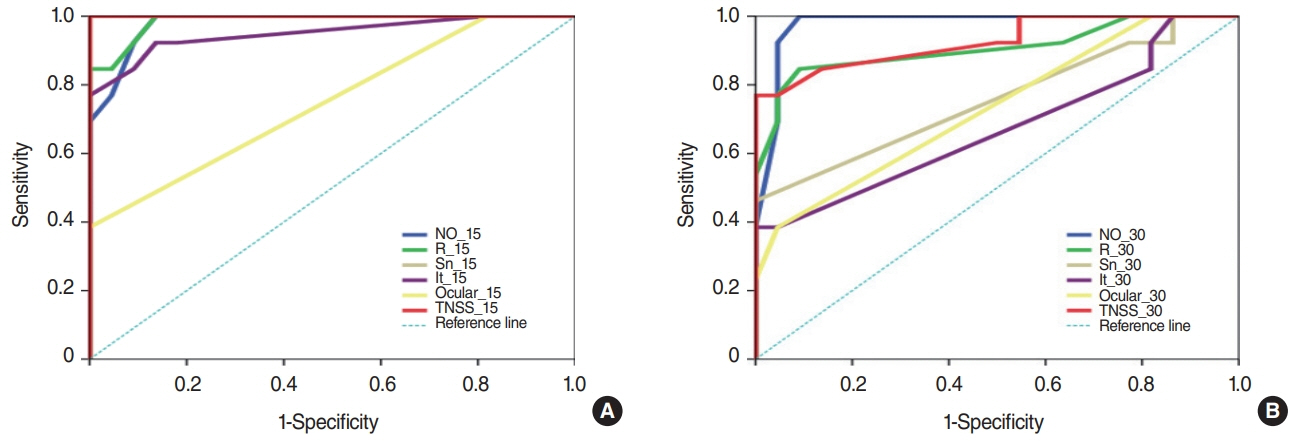
. The AR group had significantly worse symptoms than the NAR group 15 minutes after DP challenge (P<0.001). After 30 minutes, nasal obstruction and rhinorrhea remained worse in the AR group (P<0.001); a similar but less marked difference was seen for sneezing (P=0.012) and itching (P=0.039). Ocular symptoms, PNIF, MCA, and TNV differed between groups after both 15 and 30 minutes (P<0.05). The area under the receiver operating characteristic curve was higher for nasal obstruction (0.977), rhinorrhea (0.906), and TNV (0.979) than for sneezing (0.755), itching (0.673), and MCA (0.836).
Conclusion
. NPT performed according to the EAACI guidelines could help diagnose AR caused by HDM. TNV and VAS changes in nasal obstruction and rhinorrhea had higher diagnostic accuracy than other parameters.
Figure
Cited by 1 articles
-
Chronic Rhinosinusitis With Nasal Polyps Does Not Affect the Association Between the Nasal Provocation Test and Serum Allergen-Specific Immunoglobulin E Levels
HyoungSun Yoon, Il-Youp Kwak, KyungSoo Kim, Hyun Jin Min
J Rhinol. 2024;31(1):29-36. doi: 10.18787/jr.2024.00004.
Reference
-
1. Agache I, Bilo M, Braunstahl GJ, Delgado L, Demoly P, Eigenmann P, et al. In vivo diagnosis of allergic diseases--allergen provocation tests. Allergy. 2015; Apr. 70(4):355–65.2. Jang TY, Kim YH. Nasal provocation test is useful for discriminating allergic, nonallergic, and local allergic rhinitis. Am J Rhinol Allergy. 2015; Jul-Aug. 29(4):e100–4.
Article3. Rondon C, Campo P, Herrera R, Blanca-Lopez N, Melendez L, Canto G, et al. Nasal allergen provocation test with multiple aeroallergens detects polysensitization in local allergic rhinitis. J Allergy Clin Immunol. 2011; Dec. 128(6):1192–7.4. Auge J, Vent J, Agache I, Airaksinen L, Campo Mozo P, Chaker A, et al. EAACI Position paper on the standardization of nasal allergen challenges. Allergy. 2018; Aug. 73(8):1597–1608.
Article5. Kim KS, Jang TY, Kim YH. Usefulness of Allerkin house dust mite extract for nasal provocation testing. Clin Exp Otorhinolaryngol. 2017; Sep. 10(3):254–8.
Article6. Kim YH, Jang TY. Proposed diagnostic standard using visual analogue scale and acoustic rhinometry in nasal provocation test in allergic patients. Auris Nasus Larynx. 2011; Jun. 38(3):340–6.
Article7. Tomljenovic D, Baudoin T, Megla ZB, Vagic D, Hellings P, Kalogjera L. Nasal and ocular responses after specific and nonspecific nasal challenges in seasonal allergic rhinitis. Ann Allergy Asthma Immunol. 2016; Mar. 116(3):199–205.
Article8. Park KI, Jang TY, Yang SC, Hong HS, Kim YH. Correlation of nasal eosinophilia and response after nasal provocation test in patients with nonallergic rhinitis. Otolaryngol Head Neck Surg. 2018; Aug. 159(2):231–7.
Article9. Chang GU, Jang TY, Kim KS, Choi H, Kim YH. Nonspecific hyperreactivity and localized allergy: cause of discrepancy between skin prick and nasal provocation test. Otolaryngol Head Neck Surg. 2014; Feb. 150(2):194–200.10. Kim YH, Jang TY. Nasal provocation test using allergen extract versus cold dry air provocation test: which and when. Am J Rhinol Allergy. 2013; Mar-Apr. 27(2):113–7.
Article11. Kim YH, Yang TY, Lee DY, Ko KJ, Shin SH, Jang TY. Evaluation of acoustic rhinometry in a nasal provocation test with allergic rhinitis. Otolaryngol Head Neck Surg. 2008; Jul. 139(1):120–3.
Article12. Wandalsen GF, Mendes AI, Matsumoto F, Sole D. Acoustic rhinometry in nasal provocation tests in children and adolescents. J Investig Allergol Clin Immunol. 2016; 26(3):156–60.
Article13. Boelke G, Berger U, Bergmann KC, Bindslev-Jensen C, Bousquet J, Gildemeister J, et al. Peak nasal inspiratory flow as outcome for provocation studies in allergen exposure chambers: a GA2 LEN study. Clin Transl Allergy. 2017; Sep. 7:33.
Article
- Full Text Links
- Actions
-
Cited
- CITED
-
- Close
- Share
- Similar articles
-
- Patch test and Specific IgE Concentration with House Dust Mite Antigens in Atopic Dermatitis Patients
- Correlation of Appearance of Nasal Eosinophils with Levels of Total Eosinophil Counts, Total IgE, and House Dust Mite Specific IgE in Children with Symptoms of Rhinitis
- Usefulness of House Dust Mite Nasal Provocation Test in Asthma
- A Comparative Study of Atopy Patch Test Using House Dust Mite Antigens with Skin Prick Test and Specific Serum IgE Level in Atopic Dermatitis
- Type I Allergy to House Dust Mite and Familial BACKGROUND of Respiratory Atopy in Patients with Atopic Dermatitis


