Plasma Targeted Metabolomics Analysis for Amino Acids and Acylcarnitines in Patients with Prediabetes, Type 2 Diabetes Mellitus, and Diabetic Vascular Complications
- Affiliations
-
- 1School of Pharmaceutical Sciences, Liaoning University, Shenyang, China
- 2Department of Biostatistics, College of Public Health and Health Professions & College of Medicine, University of Florida, Gainesville, FL, USA
- 3Natural Products Pharmaceutical Engineering Technology Research Center of Liaoning Province, Shenyang, China
- KMID: 2514196
- DOI: http://doi.org/10.4093/dmj.2019.0209
Abstract
- Background
We hypothesized that specific amino acids or acylcarnitines would have benefits for the differential diagnosis of diabetes. Thus, a targeted metabolomics for amino acids and acylcarnitines in patients with diabetes and its complications was carried out.
Methods
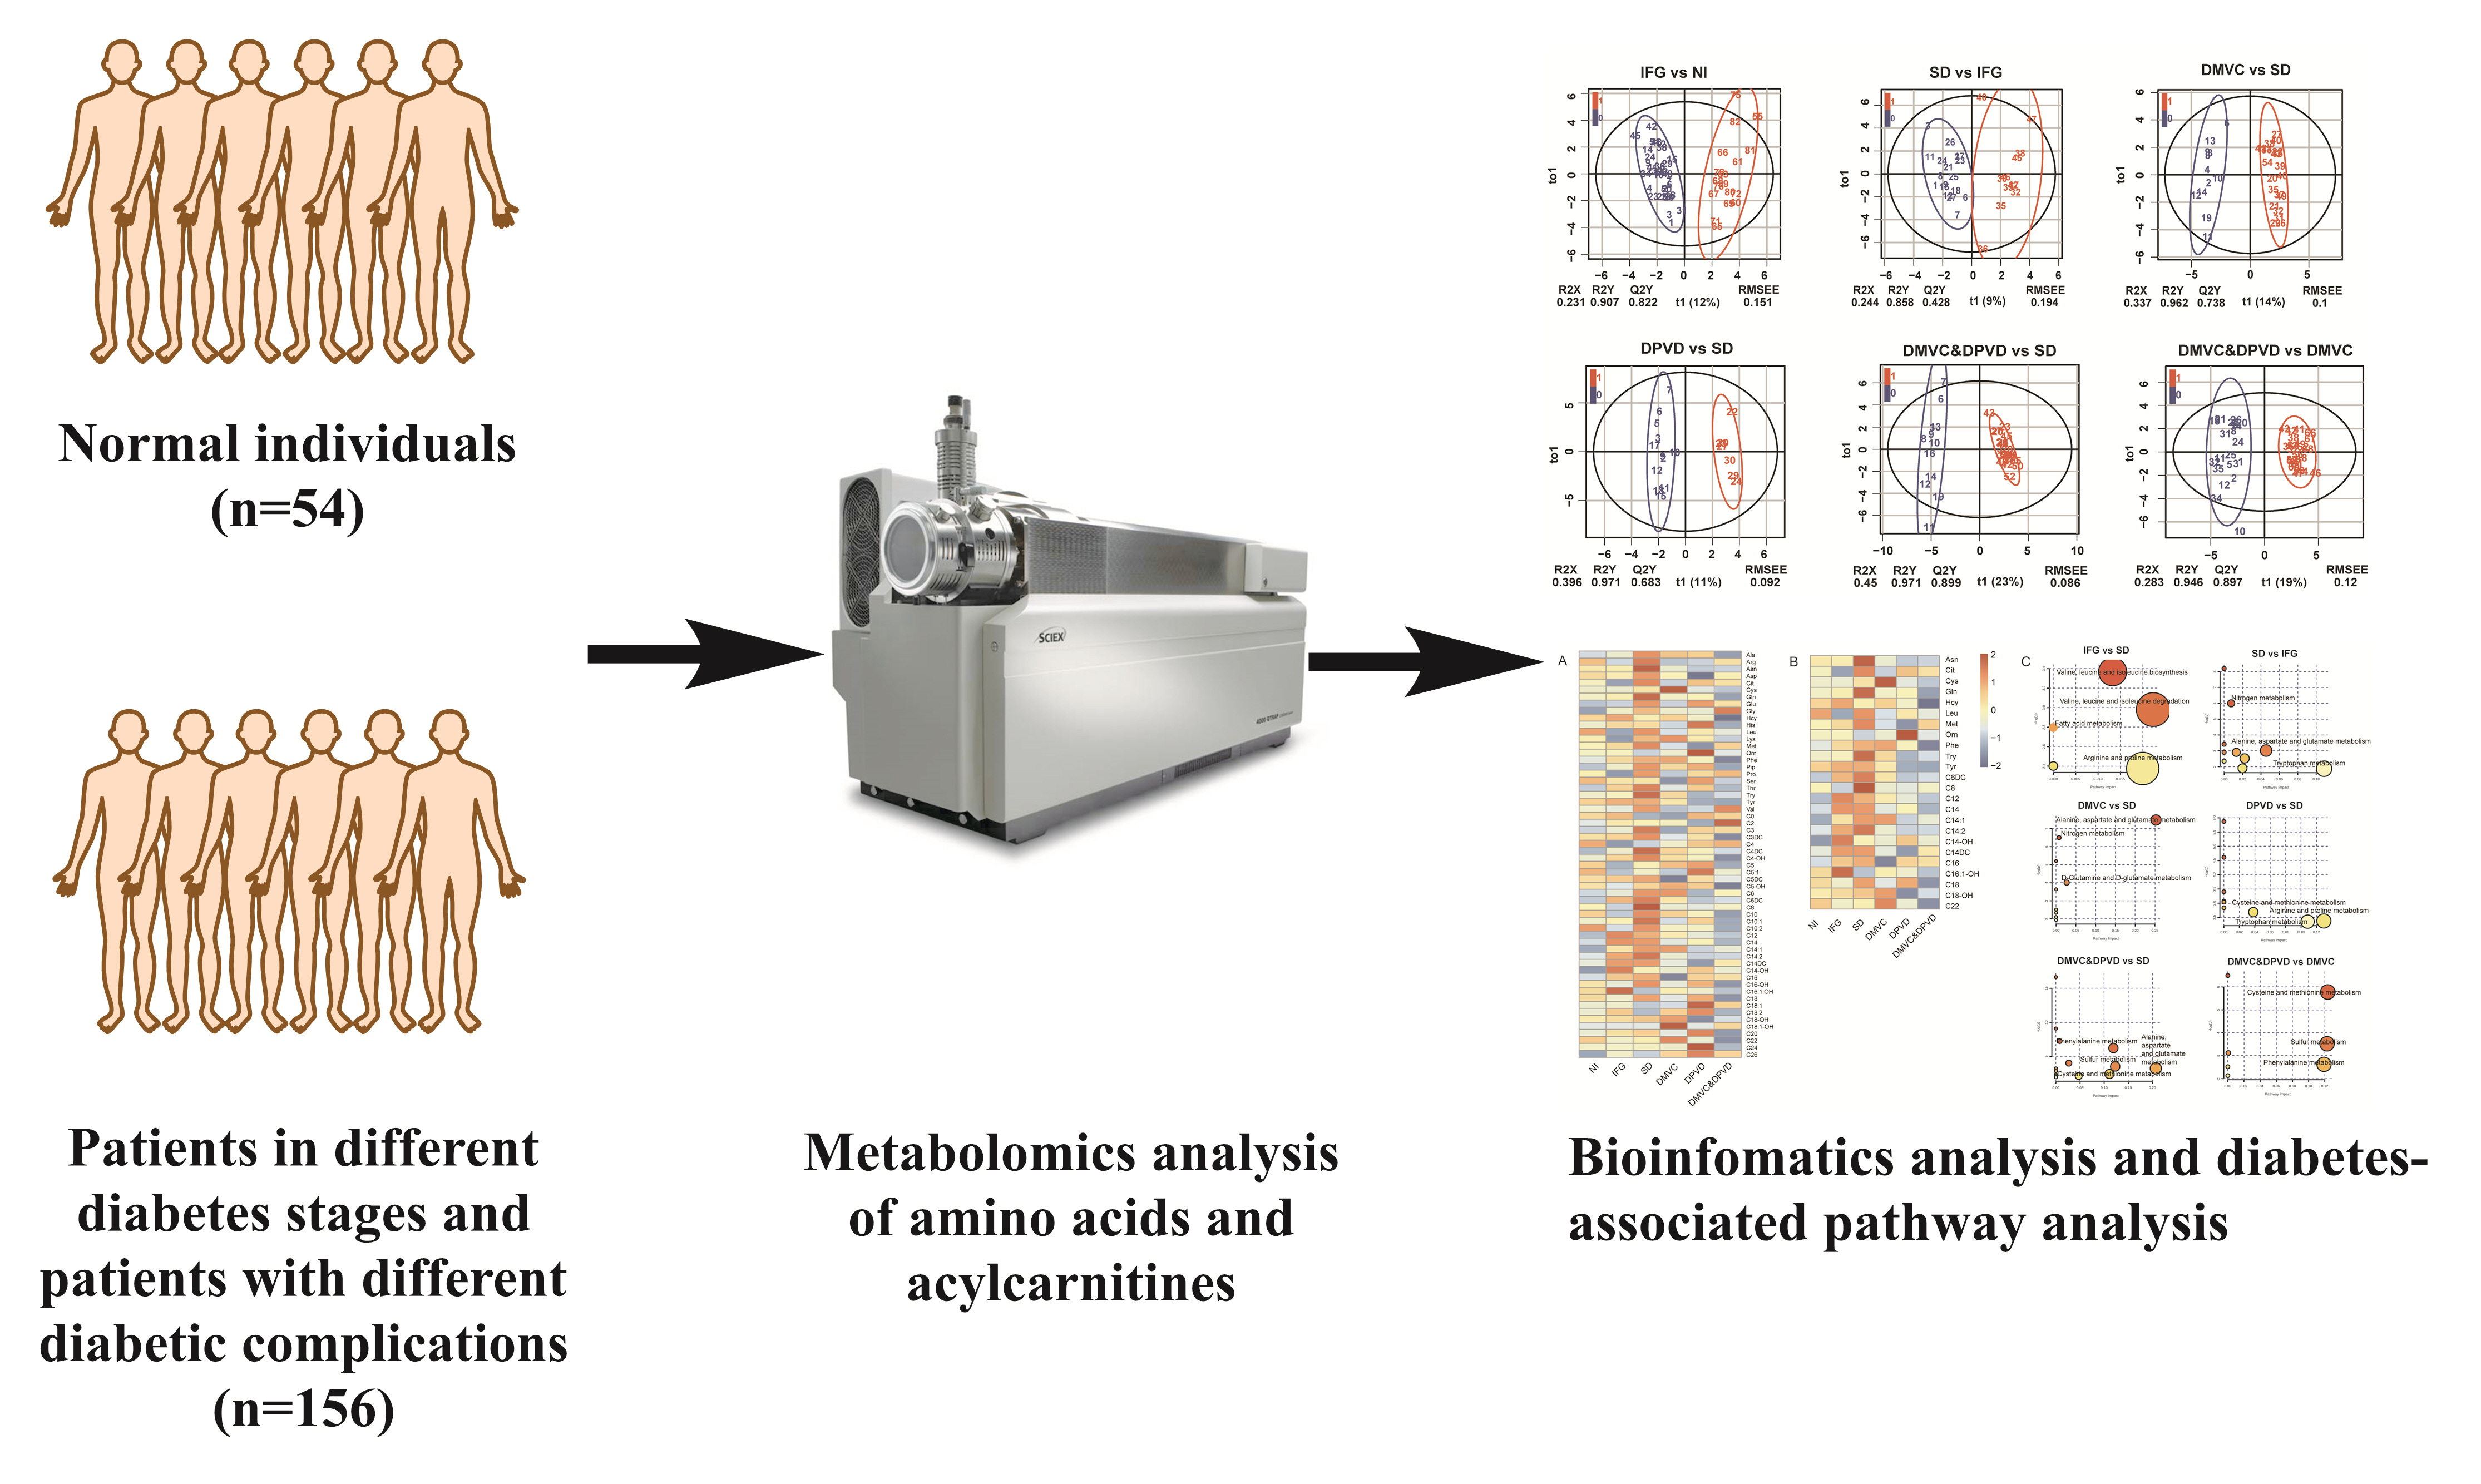
A cohort of 54 normal individuals and 156 patients with type 2 diabetes mellitus and/or diabetic complications enrolled from the First Affiliated Hospital of Jinzhou Medical University was studied. The subjects were divided into five main groups: normal individuals, impaired fasting glucose, overt diabetes, diabetic microvascular complications, and diabetic peripheral vascular disease. The technique of tandem mass spectrometry was applied to obtain the plasma metabolite profiles. Metabolomics multivariate statistics were applied for the metabolic data analysis and the differential metabolites determination.
Results
A total of 10 cross-comparisons within diabetes and its complications were designed to explore the differential metabolites. The results demonstrated that eight comparisons existed and yielded significant metabolic differences. A total number of 24 differential metabolites were determined from six selected comparisons, including up-regulated amino acids, down-regulated medium-chain and long-chain acylcarnitines. Altered differential metabolites provided six panels of biomarkers, which were helpful in distinguishing diabetic patients.
Conclusion
Our results demonstrated that the biomarker panels consisted of specific amino acids and acylcarnitines which could reflect the metabolic variations among the different stages of diabetes and might be useful for the differential diagnosis of prediabetes, overt diabetes and diabetic complications.
Figure
-
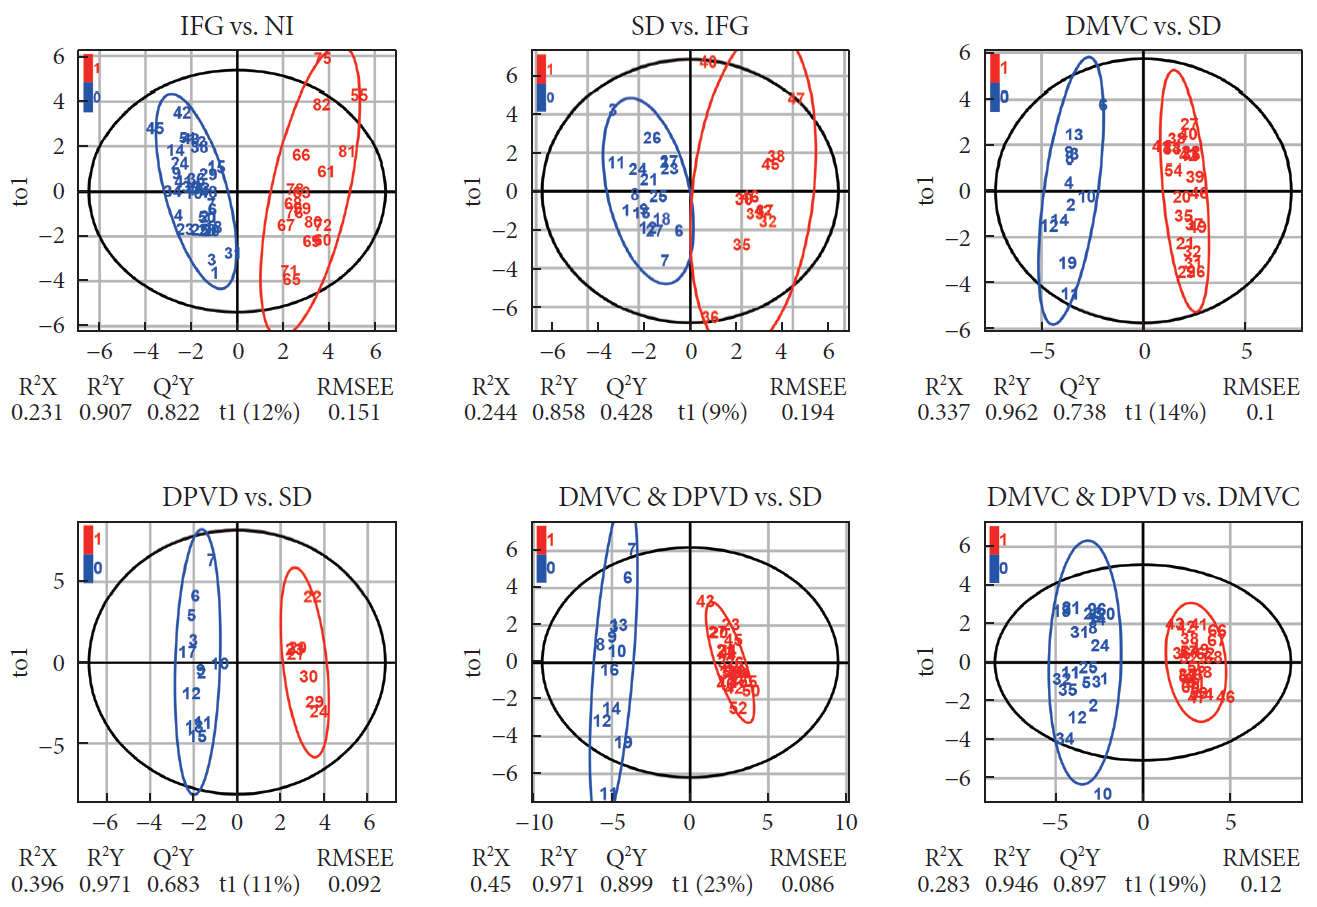
Fig. 1. The orthogonal partial least squares discriminant analysis (OPLS-DA) score plots were generated from six comparisons. In these score plots, individuals from control groups and comparable disease groups were represented by different colors (“blue” for control groups, “red” for case groups). The parameters of OPLS-DA models (including R2X, R2Y, Q2Y, and RMSEE) were also plotted to represent the quality of these established models. t1 and to1 were the first principal component and the first orthogonal component of OPLS-DA models, respectively. IFG, impaired fasting glucose; NI, normal individual; SD, simple diabetes; DMVC, diabetic microvascular complication; DPVD, diabetic peripheral vascular disease.
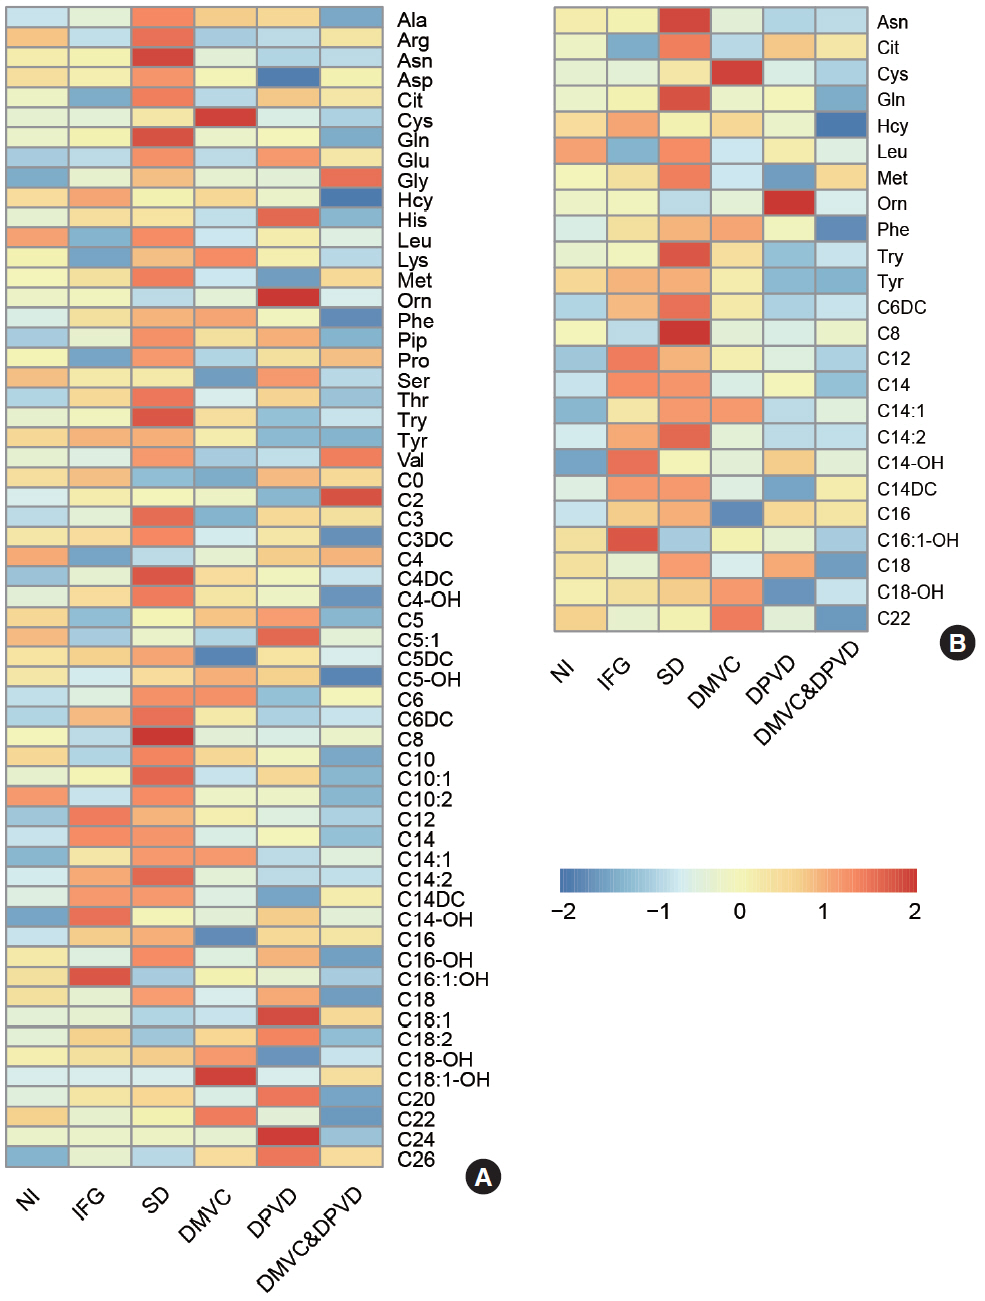
Fig. 2. Differential metabolites were determined by six comparisons. (A) The heatmap represented the levels of all 58 metabolites in six groups and (B) the heatmap represented the level of 24 differential metabolites in six groups. NI, normal individual; IFG, impaired fasting glucose; SD, simple diabetes; DMVC, diabetic microvascular complication; DPVD, diabetic peripheral vascular disease.

Fig. 3. The enrichment pathways of each biomarker were provided by Metaboanalysis 4.0 platform. IFG, impaired fasting glucose; NI, normal individual; SD, simple diabetes; DMVC, diabetic microvascular complication; DPVD, diabetic peripheral vascular disease.

Fig. 4. The receiver operating characteristic (ROC) curves and prediction plots using the model were established by the six biomarker panels. These plots were plotted to represent the sensitivity, specify and predictive capacity of the partial least square (PLS) regression models established by each biomarker panel. In the ROC curves, the area under curve (AUC) and confidence interval (CI) were also given in the plots. In the prediction plots, individuals from control group and case group were also represented by different colors (blue and red). IFG, impaired fasting glucose; NI, normal individual; SD, simple diabetes; DMVC, diabetic microvascular complication; DPVD, diabetic peripheral vascular disease.

Fig. 5. The metabolic pathways of differential biomarkers from six comparison were plotted based on Kyoto Encyclopedia of Genes and Genomes (KEGG) database. In this plot, differential metabolites selected form six comparisons were mapped into several pathways, including tricarboxylic acid (TCA) cycle, urea cycle, fatty acid oxidation and etc. The levels of differential metabolites from six groups were represented in boxplot. Analysis of variance (ANOVA) was carried out to determine the significance of each differential metabolite among six groups. NI, normal individual; IFG, impaired fasting glucose; SD, simple diabetes; DMVC, diabetic microvascular complication; DPVD, diabetic peripheral vascular disease. aP<0.05, bP<0.01, cP<0.001, dP<0.0001.
Reference
-
1. Ogurtsova K, da Rocha Fernandes JD, Huang Y, Linnenkamp U, Guariguata L, Cho NH, et al. IDF diabetes atlas: global estimates for the prevalence of diabetes for 2015 and 2040. Diabetes Res Clin Pract. 2017; 128:40–50.2. Forbes JM, Fotheringham AK. Vascular complications in diabetes: old messages, new thoughts. Diabetologia. 2017; 60:2129–38.
Article3. Fowler MJ. Microvascular and macrovascular complications of diabetes. Clin Diabetes. 2008; 26:77–82.
Article4. American Diabetes Association. 15. Diabetes care in the hospital: standards of medical care in diabetes-2019. Diabetes Care. 2019; 42:S173–81.5. Jacob M, Lopata AL, Dasouki M, Abdel Rahman AM. Metabolomics toward personalized medicine. Mass Spectrom Rev. 2019; 38:221–38.
Article6. Guasch-Ferre M, Hruby A, Toledo E, Clish CB, Martinez-Gonzslez MA, Salas-Salvado J, et al. Metabolomics in prediabetes and diabetes: a systematic review and meta-analysis. Diabetes Care. 2016; 39:833–46.7. Klein MS, Shearer J. Metabolomics and type 2 diabetes: translating basic research into clinical application. J Diabetes Res. 2016; 2016:3898502.
Article8. Batch BC, Hyland K, Svetkey LP. Branch chain amino acids: biomarkers of health and disease. Curr Opin Clin Nutr Metab Care. 2014; 17:86–9.9. Giesbertz P, Daniel H. Branched-chain amino acids as biomarkers in diabetes. Curr Opin Clin Nutr Metab Care. 2016; 19:48–54.10. Lynch CJ, Adams SH. Branched-chain amino acids in metabolic signalling and insulin resistance. Nat Rev Endocrinol. 2014; 10:723–36.
Article11. Sun L, Liang L, Gao X, Zhang H, Yao P, Hu Y, et al. Early prediction of developing type 2 diabetes by plasma acylcarnitines: a population-based study. Diabetes Care. 2016; 39:1563–70.
Article12. Bi X, Henry CJ. Plasma-free amino acid profiles are predictors of cancer and diabetes development. Nutr Diabetes. 2017; 7:e249.
Article13. Chace DH, Kalas TA. A biochemical perspective on the use of tandem mass spectrometry for newborn screening and clinical testing. Clin Biochem. 2005; 38:296–309.
Article14. Zhao YY, Cheng XL, Vaziri ND, Liu S, Lin RC. UPLC-based metabonomic applications for discovering biomarkers of diseases in clinical chemistry. Clin Biochem. 2014; 47:16–26.
Article15. Ceglarek U, Leichtle A, Brugel M, Kortz L, Brauer R, Bresler K, et al. Challenges and developments in tandem mass spectrometry based clinical metabolomics. Mol Cell Endocrinol. 2009; 301:266–71.
Article16. Denoroy L, Zimmer L, Renaud B, Parrot S. Ultra high performance liquid chromatography as a tool for the discovery and the analysis of biomarkers of diseases: a review. J Chromatogr B Analyt Technol Biomed Life Sci. 2013; 927:37–53.
Article17. Human experimentation: code of ethics of the world medical association (Declaration of Helsinki). Can Med Assoc J. 1964; 91:619.18. World Medical Association. World Medical Association Declaration of Helsinki: ethical principles for medical research involving human subjects. JAMA. 2013; 310:2191–4.19. American Diabetes Association. 2. Classification and diagnosis of diabetes: standards of medical care in diabetes-2018. Diabetes Care. 2018; 41:S13–27.20. Chaudhary K, Poirion OB, Lu L, Garmire LX. Deep learning-based multi-omics integration robustly predicts survival in liver cancer. Clin Cancer Res. 2018; 24:1248–59.21. Chong J, Soufan O, Li C, Caraus I, Li S, Bourque G, et al. MetaboAnalyst 4.0: towards more transparent and integrative metabolomics analysis. Nucleic Acids Res. 2018; 46:W486–94.
Article22. Yip WCY, Sequeira IR, Plank LD, Poppitt SD. Prevalence of pre-diabetes across ethnicities: a review of impaired fasting glucose (IFG) and impaired glucose tolerance (IGT) for classification of dysglycaemia. Nutrients. 2017; 9:1273.
Article23. Abdul-Ghani MA, Tripathy D, DeFronzo RA. Contributions of beta-cell dysfunction and insulin resistance to the pathogenesis of impaired glucose tolerance and impaired fasting glucose. Diabetes Care. 2006; 29:1130–9.24. Yang XJ, Zou SF, Xu Y, Li Y, Yang SS. The influence of intensive lifestyle intervention on patients with isolated impaired fasting glucose: a meta-analysis. J Adv Nurs. 2016; 72:2587–97.
Article25. Chen T, Ni Y, Ma X, Bao Y, Liu J, Huang F, et al. Branched-chain and aromatic amino acid profiles and diabetes risk in Chinese populations. Sci Rep. 2016; 6:20594.26. Xu F, Tavintharan S, Sum CF, Woon K, Lim SC, Ong CN. Metabolic signature shift in type 2 diabetes mellitus revealed by mass spectrometry-based metabolomics. J Clin Endocrinol Metab. 2013; 98:E1060–5.
Article27. Ottosson F, Smith E, Melander O, Fernandez C. Altered asparagine and glutamate homeostasis precede coronary artery disease and type 2 diabetes. J Clin Endocrinol Metab. 2018; 103:3060–9.28. Owei I, Umekwe N, Stentz F, Wan J, Dagogo-Jack S. Amino acid signature predictive of incident prediabetes: a case-control study nested within the longitudinal pathobiology of prediabetes in a biracial cohort. Metabolism. 2019; 98:76–83.
Article29. Yu E, Papandreou C, Ruiz-Canela M, Guasch-Ferre M, Clish CB, Dennis C, et al. Association of tryptophan metabolites with incident type 2 diabetes in the PREDIMED trial: a case-cohort study. Clin Chem. 2018; 64:1211–20.30. Matsuoka K, Kato K, Takao T, Ogawa M, Ishii Y, Shimizu F, et al. Concentrations of various tryptophan metabolites are higher in patients with diabetes mellitus than in healthy aged male adults. Diabetol Int. 2016; 8:69–75.
Article31. McCoin CS, Knotts TA, Adams SH. Acylcarnitines: old actors auditioning for new roles in metabolic physiology. Nat Rev Endocrinol. 2015; 11:617–25.32. Batchuluun B, Al Rijjal D, Prentice KJ, Eversley JA, Burdett E, Mohan H, et al. Elevated medium-chain acylcarnitines are associated with gestational diabetes mellitus and early progression to type 2 diabetes and induce pancreatic β-cell dysfunction. Diabetes. 2018; 67:885–97.
Article33. Adams SH, Hoppel CL, Lok KH, Zhao L, Wong SW, Minkler PE, et al. Plasma acylcarnitine profiles suggest incomplete long-chain fatty acid beta-oxidation and altered tricarboxylic acid cycle activity in type 2 diabetic African-American women. J Nutr. 2009; 139:1073–81.34. Rutkowsky JM, Knotts TA, Ono-Moore KD, McCoin CS, Huang S, Schneider D, et al. Acylcarnitines activate proinflammatory signaling pathways. Am J Physiol Endocrinol Metab. 2014; 306:E1378–87.
Article35. Zheng Y, Ley SH, Hu FB. Global aetiology and epidemiology of type 2 diabetes mellitus and its complications. Nat Rev Endocrinol. 2018; 14:88–98.36. Afshinnia F, Nair V, Lin J, Rajendiran TM, Soni T, Byun J, et al. Increased lipogenesis and impaired β-oxidation predict type 2 diabetic kidney disease progression in American Indians. JCI Insight. 2019; 4:e130317.
Article
- Full Text Links
-
- Actions
-
Cited
- CITED
-
- Close
- Share
-
- Similar articles
-
- Serum Branched Chain Amino Acids Are Associated with Type 2 Diabetes Mellitus in Jordan
- Plasma Paraoxonase Activities in Type 2 Diabetes Mellitus
- A randomized study to establish the effects of spirulina in type 2 diabetes mellitus patients
- Smoking and Type 2 Diabetes Mellitus
- Recent advances in nonalcoholic fatty liver disease metabolomics
