Moving Rate of Positive Patient Results as a Quality Control Tool for High-Sensitivity Cardiac Troponin T Assays
- Affiliations
-
- 1Department of Laboratory Medicine, The Second Affiliated Hospital of Guangzhou University of Chinese Medicine, Guangzhou, China
- 2Department of Laboratory Medicine, The First Affiliated Hospital, Sun Yat-Sen University, Guangzhou, China
- KMID: 2512733
- DOI: http://doi.org/10.3343/alm.2021.41.1.51
Abstract
- Background
A small shift in high-sensitivity cardiac troponin T (hs-cTnT) assays can lead to different result interpretation and consequent patient management. We explored whether a small bias could be detected using conventional internal quality control (QC) procedures, evaluated the performance of moving average (MA)-based QC procedures, and proposed a new QC procedure based on the moving rate (MR) of positive patient results of hs-cTnT assays.
Methods
The ability of conventional QC to detect a 5 ng/L bias was examined using the 1 3s/ 22s/R4s multi-rule procedure as deviation rules.We developed MA and MR procedures for the hs-cTnT assay using eight months of patient data. The performance of different MA or MR procedures was investigated by calculating the median number of patient samples affected until a bias introduced into the dataset was detected (MNPed). After comparing the MNPed across different procedures, we selected an optimal MA or MR procedure for validation. Validation graphs were plotted using the minimum, median, and maximum number of results affected until bias detection.
Results
Our conventional QC procedures could not detect a positive bias of 5 ng/L. When a positive bias was introduced, MNPed was much higher using MA than using MR, with cut-off values of 5 ng/L and 14 ng/L, respectively. MR validation charts for optimal procedures provided insight into the MR performance.
Conclusions
The MR procedure could detect different errors with few false alarms. In the hs-cTnT assay, the MR procedure with a smaller cut-off value outperformed MA and conventional QC procedures for small bias detection.
Keyword
Figure
-

Fig. 1 Bias detection curves for hs-cTnT MA and MR procedures. Median number of patient samples affected until error detection (MNPed) needed for bias detection using (A) MA procedure, (B) MR procedure with a cut-off value of 5 ng/L, (C) MR procedure with a cut-off value of 14 ng/L, and (D) MR procedure with a cut-off value of 52 ng/L. For the MA curves, 3 and 150 ng/L were used as lower and upper truncation limits, respectively. Numbers in the keys within each panel represent the applied block size for the MA or MR calculation. The dashed line represents the average daily run size of 180 patient results. Abbreviations: hs-cTnT, high-sensitivity cardiac troponin T; MA, moving average; MR, moving rate.
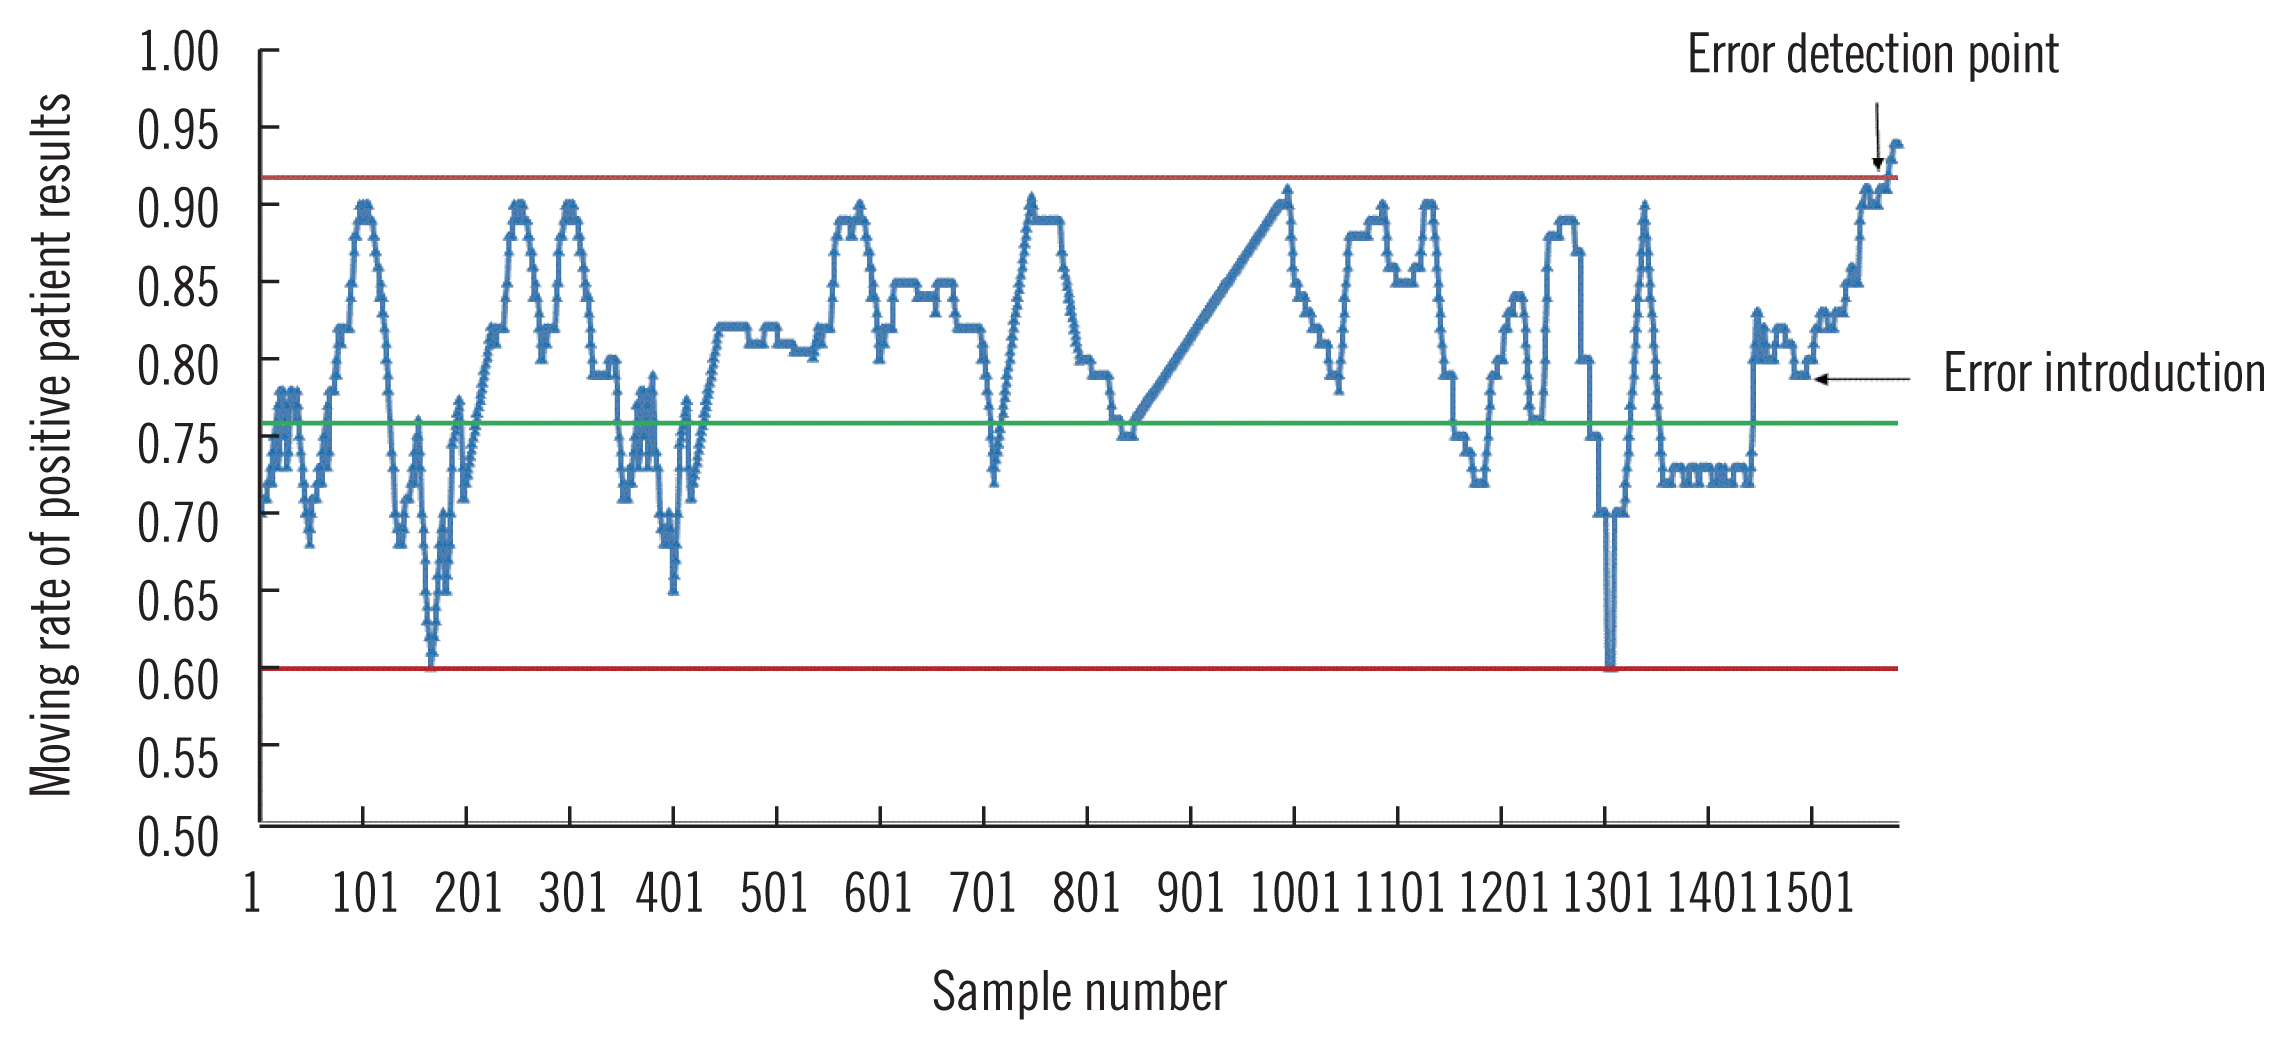
Fig. 2 Graphical illustration of how MR QC procedure detects a systematic error. The horizontal green line in the middle of the graph represents the mean of the MR of positive patient results (negative results=hs-cTnT below 5 ng/L; positive results=hs-cTnT above 5 ng/L). The horizontal red lines represent the upper or lower control limits. Abbreviations: hs-cTnT, high-sensitivity cardiac troponin T; MR, moving rate. QC, quality control.

Fig. 3 Validation charts for selected optimal patient-based QC procedures for the hs-cTnT assay. (A) MA procedure,(B) MR procedure with a cut-off value of 5 ng/L, (C) MR procedure with a cut-off value of 14 ng/L, and (D) MR procedure with a cut-off value of 52 ng/L. The graphs show the median number of assay results needed for bias detection (MNPed) as bars, and the minimum/maximum number of results needed for bias detection as error bars. The introduced bias is plotted on the X-axis and the MNPed on the Y-axis. Graphs in panels A–C used block sizes of 100, and those in D used a block size of 200. The lower and upper truncation limits for MA procedure are 3 and 150 ng/L, respectively. The dashed line represents the average daily run size of 180 patient results. Abbreviations: hs-cTnT, high-sensitivity cardiac troponin T; MA, moving average; MR, moving rate; QC, quality control.
Cited by 1 articles
-
Effect of Outlier Elimination on the 99th Percentile Upper Reference Limits of High-Sensitivity Cardiac Troponin I Assays Based on a Strictly Selected Healthy Reference Population
Sunyoung Ahn, Hyun-Ki Kim, Woochang Lee, Sail Chun, Won-Ki Min
Ann Lab Med. 2022;42(3):331-341. doi: 10.3343/alm.2022.42.3.331.
Reference
-
1. Westgard JO, Bayat H, Westgard SA. Planning risk-based SQC schedules for bracketed operation of continuous production analyzers. Clin Chem. 2018; 64:289–96.
Article2. Parvin CA. Assessing the impact of the frequency of quality control testing on the quality of reported patient results. Clin Chem. 2008; 54:2049–54.
Article3. Li T, Wang W, Zhao H, He F, Zhong K, Yuan S, et al. Quality specification and status of internal quality control of cardiac biomarkers in China from 2011 to 2016. J Clin Lab Anal. 2018; 32:e22324.
Article4. Parvin CA. Planning statistical quality control to minimize patient risk: it’s about time. Clin Chem. 2018; 64:249–50.
Article5. Amador E, His BP, Massod MF. An evaluation of the ‘average of normals’ and related methods of quality control. Am J Clin Pathol. 1968; 50:369–78.
Article6. Bull BS, Elashoff RM, Heilbron DC, Couperus J. A study of various estimators for the derivation of quality control procedures from patient erythrocyte indices. Am J Clin Pathol. 1974; 61:473–81.
Article7. Lott JA, Smith DA, Mitchell LC, Moeschberger ML. Use of medians and “average of normals” of patients’ data for assessment of long-term analytical stability. Clin Chem. 1996; 42:888–92.
Article8. Kazmierczak SC. Laboratory quality control: using patient data to assess analytical performance. Clin Chem Lab Med. 2003; 41:617–27.
Article9. van Rossum HH, Kemperman H. Optimization and validation of moving average quality control procedures using bias detection curves and moving average validation charts. Clin Chem Lab Med. 2017; 55:218–24.
Article10. van Rossum HH, Kemperman H. A method for optimization and validation of moving average as continuous analytical quality control instrument demonstrated for creatinine. Clin Chim Acta. 2016; 457:1–7.
Article11. Liu J, Tan CH, Badrick T, Loh TP. Moving standard deviation and moving sum of outliers as quality tools for monitoring analytical precision. Clin Biochem. 2018; 52:112–6.
Article12. van Rossum HH, van den Broek D. Design and implementation of quality control plans that integrate moving average and internal quality control: incorporating the best of both worlds. Clin Chem Lab Med. 2019; 57:1329–38.
Article13. Ng D, Polito FA, Cervinski MA. Optimization of a moving averages program using a simulated annealing algorithm: the goal is to monitor the process not the patients. Clin Chem. 2016; 62:1361–71.
Article14. Wilson A, Roberts WL, Pavlov I, Fontenot J, Jackson B. Patient result median monitoring for clinical laboratory quality control. Clin Chim Acta. 2011; 412:1441–6.
Article15. Fleming JK, Katayev A. Changing the paradigm of laboratory quality control through implementation of real-time test results monitoring: for patients by patients. Clin Biochem. 2015; 48:508–13.
Article16. Liu J, Tan CH, Badrick T, Loh TP. Moving sum of number of positive patient result as a quality control tool. Clin Chem Lab Med. 2017; 55:1709–14.
Article17. Roffi M, Patrono C, Collet JP, Mueller C, Valgimigli M, Andreotti E, et al. 2015 ESC Guidelines for the management of acute coronary syndromes in patients presenting without persistent ST-segment elevation: Task Force for the Management of Acute Coronary Syndromes in Patients Presenting without Persistent ST-Segment Elevation of the European Society of Cardiology (ESC). Eur Heart J. 2016; 37:267–315.18. Westgard JO. Basic quality control practices. 4th ed. Madison (WI): Westgard QC, Inc;2016. p. 45–76.19. van Rossum HH. Moving average quality control: principles, practical application and future perspectives. Clin Chem Lab Med. 2019; 57:773–82.
Article20. International Organization for Standardization. Guidance for the in-house preparation of quality control materials. ISO/Guide. 80:2014. available at: https://www.iso.org/obp/ui/#iso:std:iso:guide:80:ed-1:v1:en. Accessed: 21 October 2019.21. Bennett ST. Continuous improvement in continuous quality control. Clin Chem. 2016; 62:1299–301.
Article22. Liu J, Tan CH, Loh TP, Badrick T. Verification of out-of-control situations detected by “average of normal” approach. Clin Biochem. 2016; 49:1248–53.
Article23. Linnet K. The exponentially weighted moving average (EWMA) rule compared with traditionally used quality control rules. Clin Chem Lab Med. 2006; 44:396–9.
Article24. Jones GR. Average of delta: a new quality control tool for clinical laboratories. Ann Clin Biochem. 2016; 53:133–40.
Article25. MA Generator. Available at: www.huvaros.com. Accessed: 8 June 2020.
- Full Text Links
-
- Actions
-
Cited
- CITED
-
- Close
- Share
-
- Similar articles
-
- Analytical Characteristics of High-Sensitivity Cardiac Troponin Assays
- Troponin assay use in the emergency department for management of patients with potential acute coronary syndrome: current use and future directions
- Performance Evaluation of the Point-of-Care Cardiac Troponin T Assay
- Diagnostic Value of Cardiac STATus(TM) for Diagnosing Acute Cardiac Ischemia in Patients with Acute Chest Pain in an Emergency Settings
- Usefulness of Rapid Test for Cardiac Troponin T in Postmortem Diagnosis of Sudden Cardiac Death
