Predictions of Sampling Site Based on Microbial Compositions Using a Decision Tree-based Method
- Affiliations
-
- 1Department of Microbiology, Dongguk University College of Medicine, Gyeongju 38066, Republic of Korea
- KMID: 2512145
- DOI: http://doi.org/10.4167/jbv.2020.50.4.257
Abstract
- The nose and throat are sites commonly used to obtain swab specimens to diagnose upper respiratory tract infections, and some studies have shown differences between the diagnostic accuracies of nose and throat swabs for upper respiratory infections. However, current sampling methods for the diagnosis of upper respiratory tract infections do not differentiate between nose and throat samples. The present study was undertaken to devise a means of determining whether samples were obtained from the nose or throat. Microbiome abundance data of 576 upper respiratory swab samples were obtained from the human microbiome project website. Predictive models were generated to determine sampling sites based on microbiomes using the random forest and regression tree with recursive partitioning methods. The final prediction model showed a near-perfect prediction for sampling sites using only the abundances of Staphylococcaceae and Streptococcaceae. The devised model can be used to predict sampling sites for upper respiratory specimens.
Keyword
Figure
-
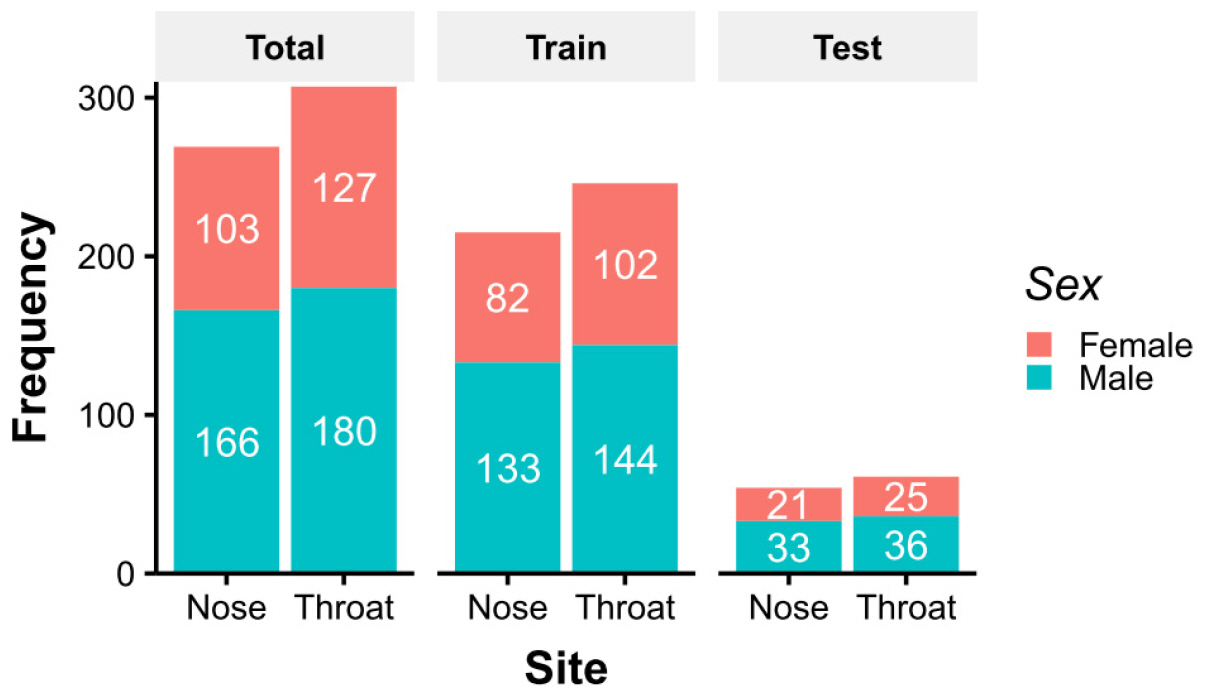
Fig. 1 Characteristics of study subjects. Nose and throat specimens from 576 healthy volunteers were included. For supervised learning and sampling site predictions, volunteers were divided into training set and test set by sex-stratified random sampling at a ratio of 4:1.
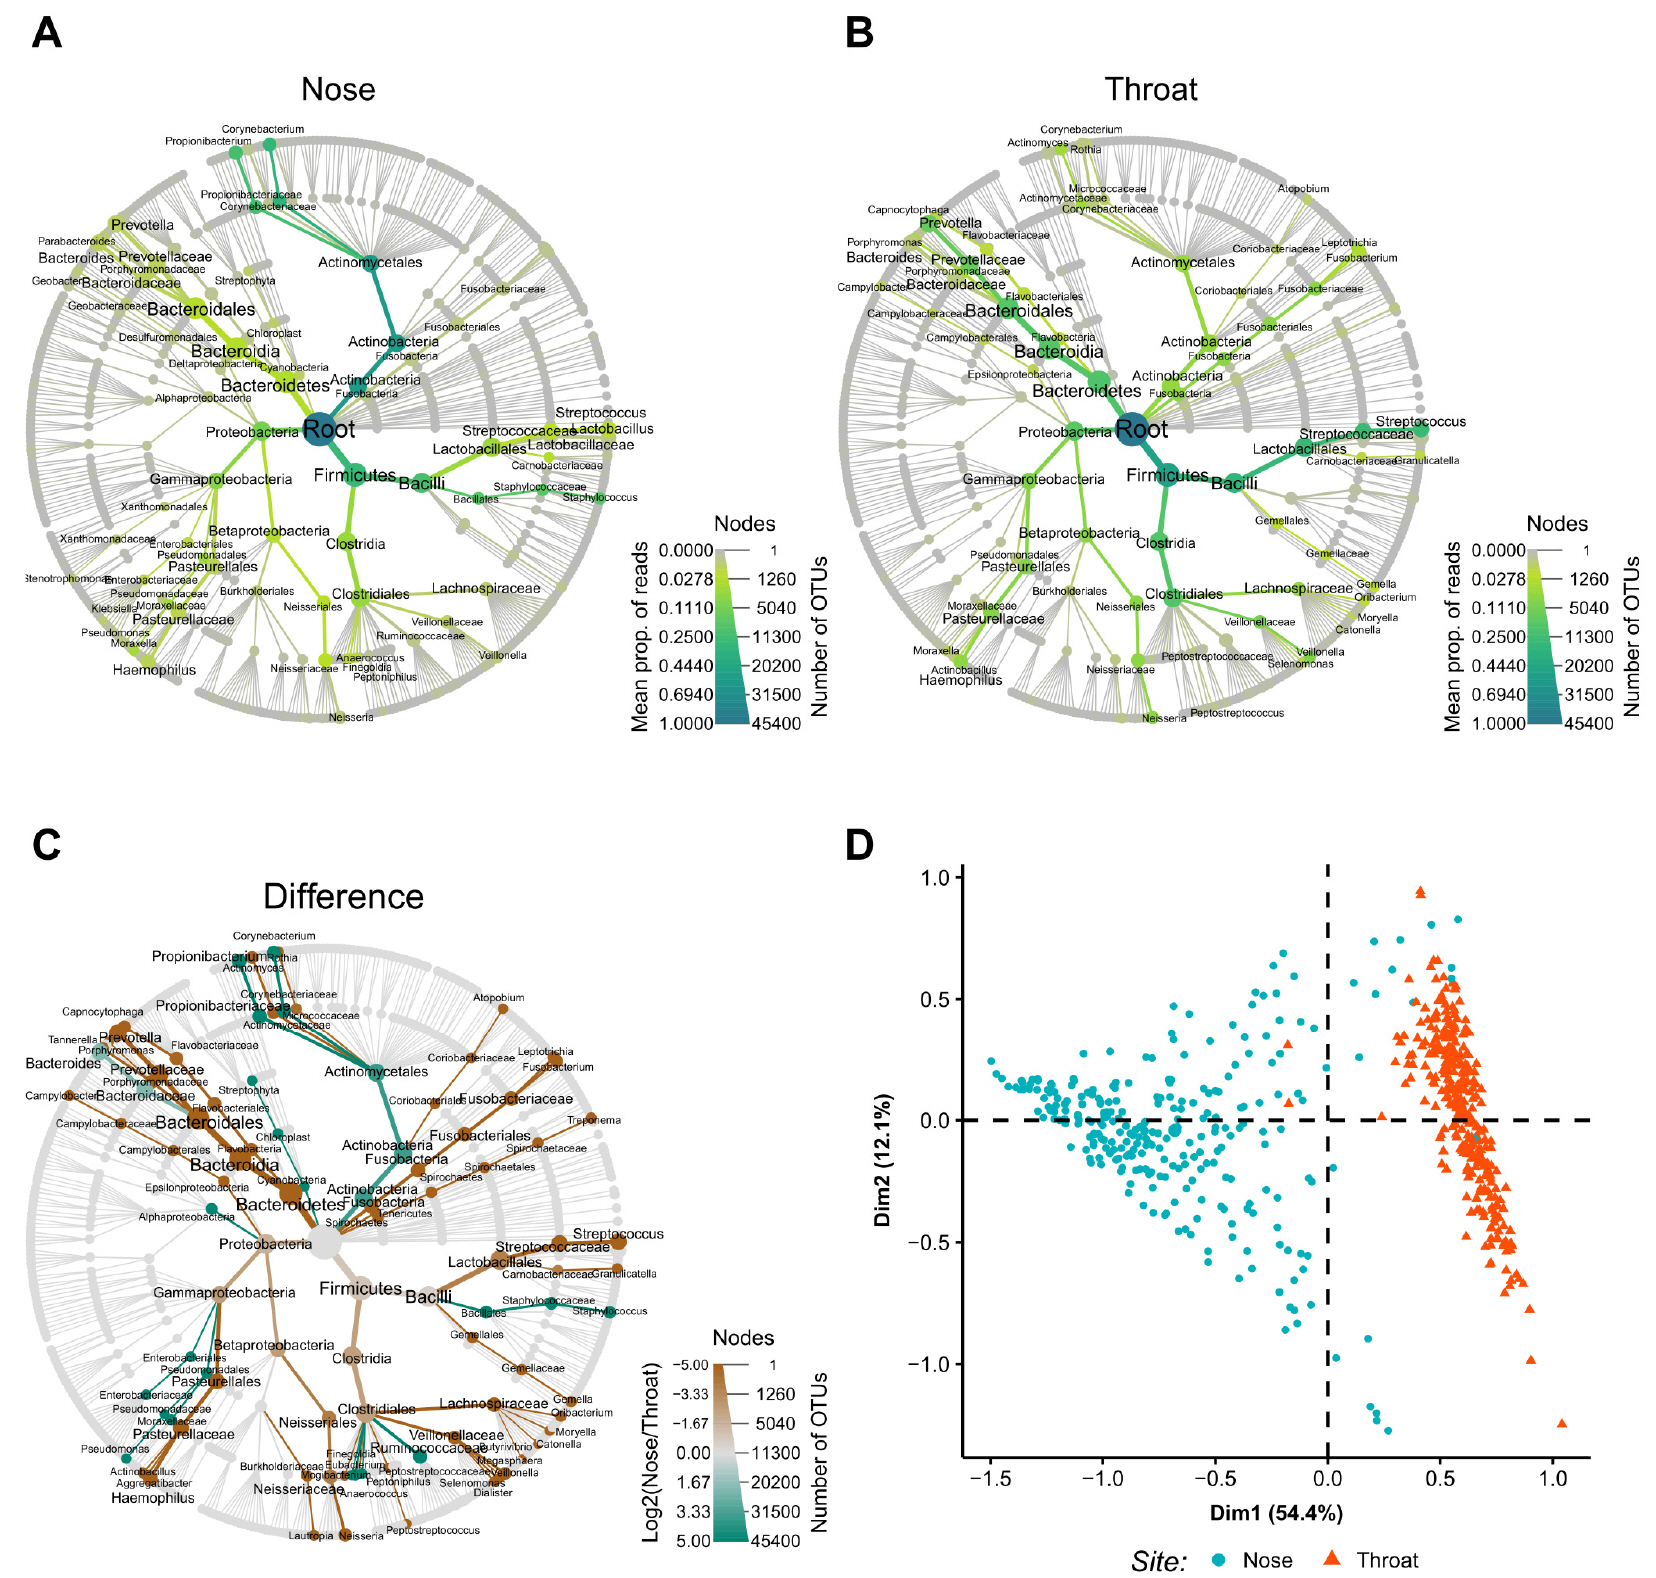
Fig. 2 Taxa abundances and differences between nose and throat samples. The relative abundances and abundance differences of taxa are shown in a tree diagram. Node and edge sizes represent numbers of OTUs and samples, respectively. Node and edge colors represent mean proportion of reads. (A) Abundant taxa in the nose. (B) Abundant taxa in the throat. (C) Differentially abundant taxa between nose and throat. Node and edge colors represent log-transformed differences between mean proportions of reads for nose and throat samples. (D) Principal component analysis plot. prop, proportion; OTU, operational taxonomic unit.
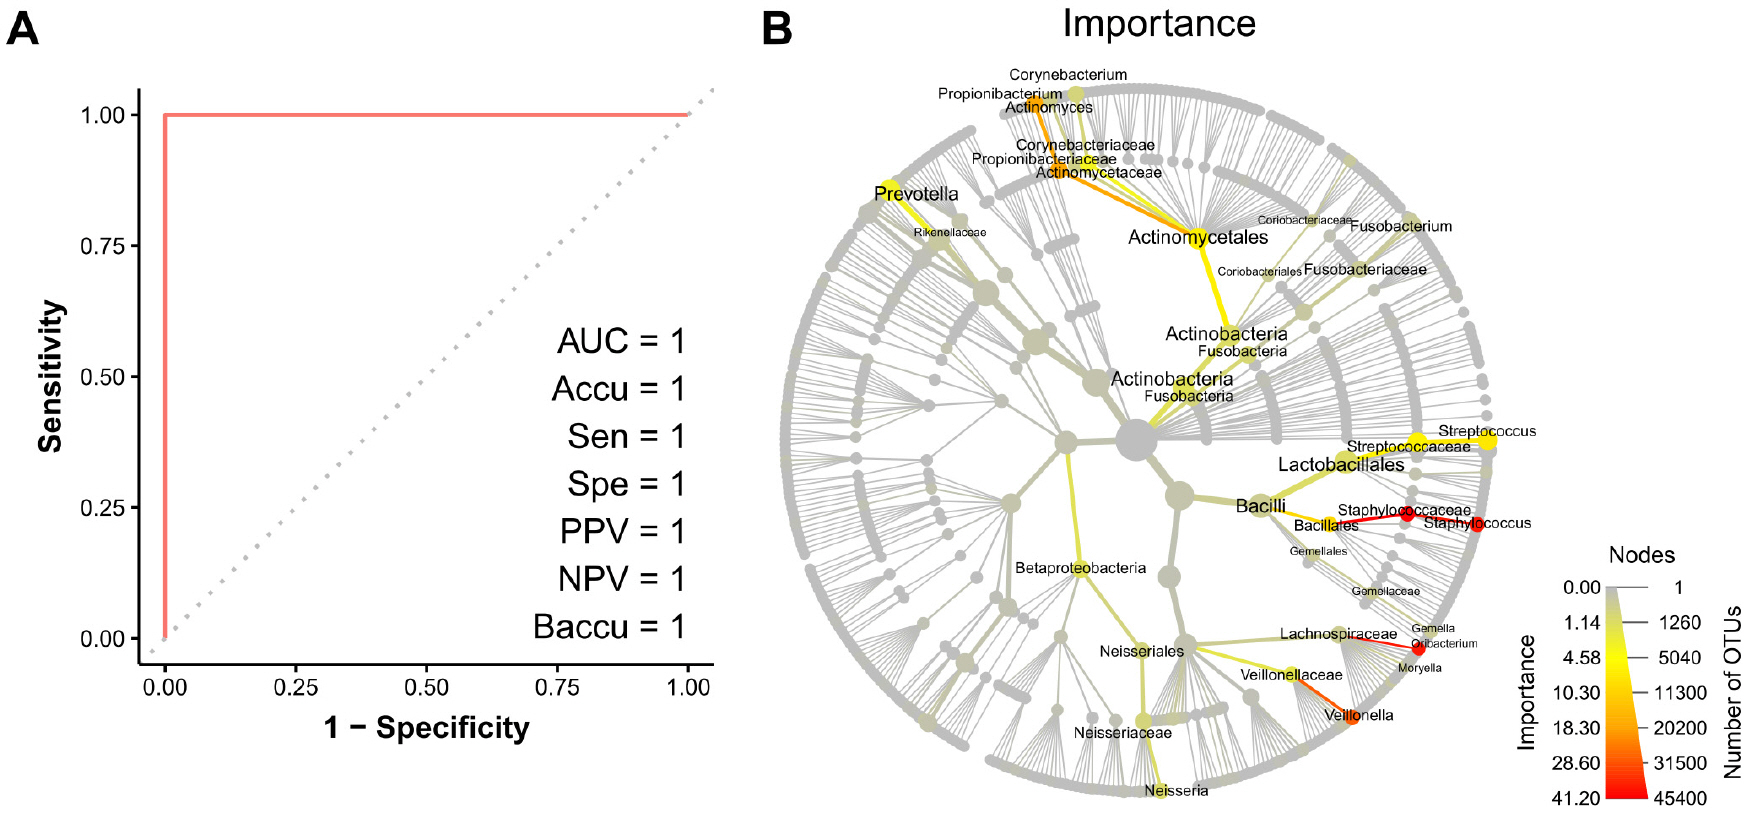
Fig. 3 Random forest prediction results. (A) Receiver Operating Characteristics curve. (B) Variable importance for the random forest prediction model. Node and edge sizes represent numbers of OTUs and samples, respectively. Node and edge colors represent variable importances. AUC, area under the curve; Accu, accuracy; Sen, sensitivity; Spe, specificity; PPV, positive predictive value; NPV, negative predictive value; Baccu, balanced accuracy; OTU, operational taxonomic unit.
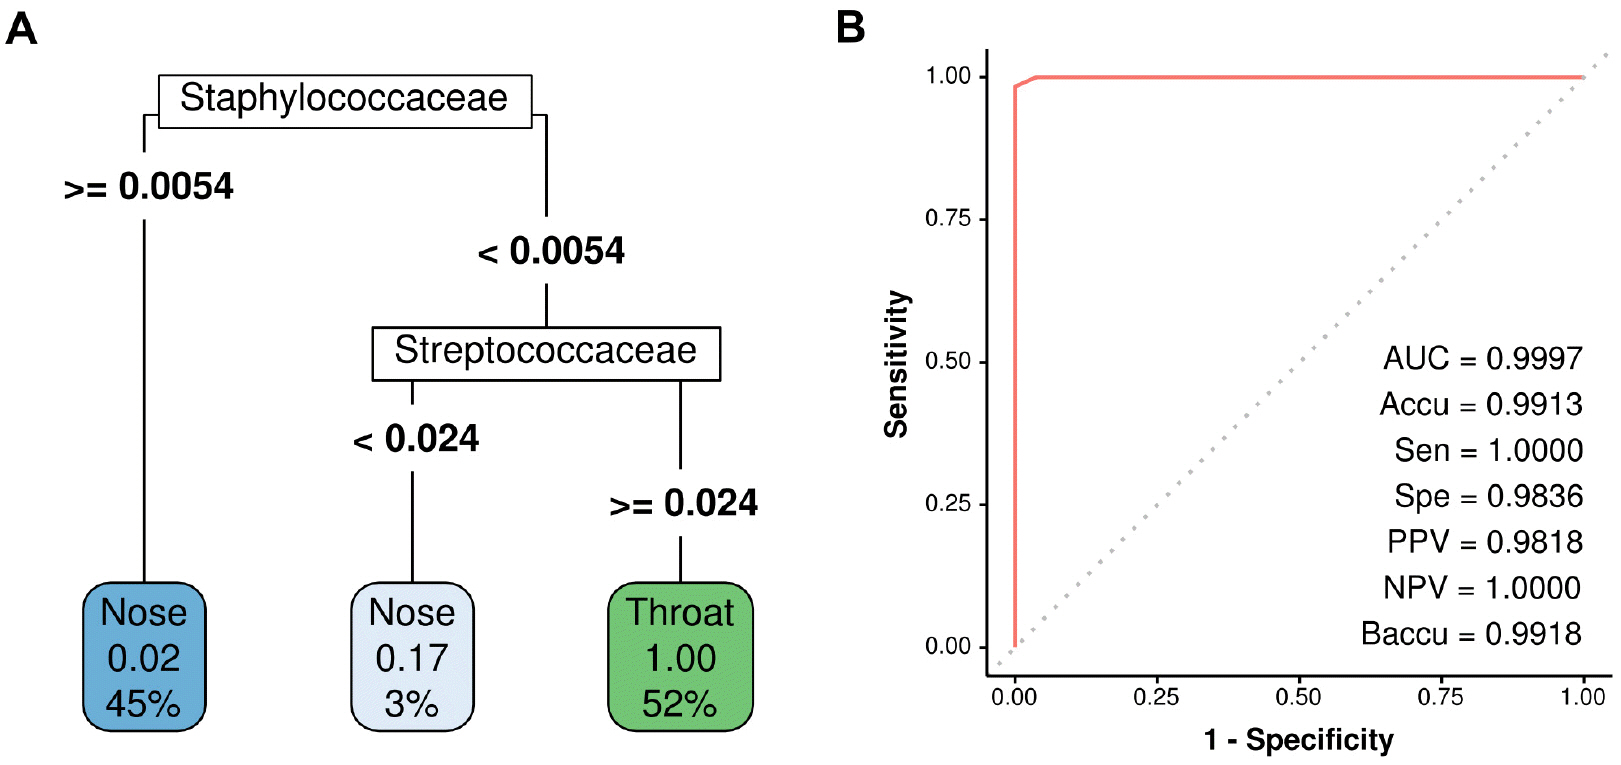
Fig. 4 Final prediction model. (A) Final decision tree (B) Receiver Operating Characteristics curve. AUC, area under the curve; Accu, accuracy; Sen, sensitivity; Spe, specificity; PPV, positive predictive value; NPV, negative predictive value; Baccu, balanced accuracy.
Reference
-
1. Centers for Disease Control and Prevention. Specimen collection and handling. 2020. https://www.cdc.gov/urdo/specimen.html.2. Korea Disease Control and Prevention Agency. Respiratory infection control guidelines. 2020. http://www.kdca.go.kr/ board/board.es?mid=a20507020000&bid=0019.3. World Health Organization. Laboratory testing for coronavirus disease (COVID-19) in suspected human cases: interim guidance. 2020. https://apps.who.int/iris/handle/10665/331501.4. Kim C, Ahmed JA, Eidex RB, Nyoka R, Waiboci LW, Erdman D, et al. Comparison of nasopharyngeal and oropharyngeal swabs for the diagnosis of eight respiratory viruses by real-time reverse transcription-PCR assays. PLoS One 2011;6:e21610.DOI: 10.1371/journal.pone.0021610. PMID: 21738731. PMCID: PMC3128075.5. Zou L, Ruan F, Huang M, Liang L, Huang H, Hong Z, et al. SARS-CoV-2 viral load in upper respiratory specimens of infected patients. N Engl J Med 2020;382:1177-9.DOI: 10.1056/NEJMc2001737. PMID: 32074444. PMCID: PMC7121626.6. Human Microbiome Project Consortium. Structure, function and diversity of the healthy human microbiome. Nature 2012;486:207-14.DOI: 10.1038/nature11234. PMID: 22699609. PMCID: PMC3564958.7. Foster ZS, Sharpton TJ, Grünwald NJ. Metacoder: an R package for visualization and manipulation of community taxonomic diversity data. PLoS Comput Biol 2017;13:e1005404.DOI: 10.1371/journal.pcbi.1005404. PMID: 28222096. PMCID: PMC5340466.8. Liaw A, Wiener M. Classification and regression by randomForest. R News 2002:18-22.9. Kuhn M. Building predictive models in R using the caret package. J Stat Softw 2008;28:1-26.DOI: 10.18637/jss.v028.i05.10. Therneau T, Atkinson B, Ripley B. Rpart: recursive partitioning and regression trees, 2015. R Package Version 4 2016.11. R Core Team. R: A language and environment for statistical computing. 2020. https://www.r-project.org/.12. Biau G, Scornet E. A random forest guided tour. Test 2016;25:197-227.DOI: 10.1007/s11749-016-0481-7.13. Mertz D, Frei R, Jaussi B, Tietz A, Stebler C, Flückiger U, et al. Throat swabs are necessary to reliably detect carriers of Staphylococcus aureus. Clin Infect Dis 2007;45:475-7.DOI: 10.1086/520016. PMID: 17638197.14. Margolis E, Yates A, Levin BR. The ecology of nasal colonization of Streptococcus pneumoniae, Haemophilus influenzae and Staphylococcus aureus: the role of competition and interactions with host’s immune response, BMC Microbiol 2010;10:59.DOI: 10.1186/1471-2180-10-59. PMID: 20178591. PMCID: PMC2844402.
- Full Text Links
-
- Actions
-
Cited
- CITED
-
- Close
- Share
-
- Similar articles
-
- The clinical decision analysis using decision tree
- Analysis and Prediction of Length of Stay in the Postanesthetia Care Unit
- Data-Mining-Based Coronary Heart Disease Risk Prediction Model Using Fuzzy Logic and Decision Tree
- A machine learning based decision tree analysis of influential factor for the number of remaining teeth in Korean adults
- What kind of medical equations and decision trees do physicians want in their daily activities? : Analysis of one-year MedCalc 3000(R) log data
