Guidelines for Cardiovascular Magnetic Resonance Imaging from the Korean Society of Cardiovascular Imaging (KOSCI) - Part 3: Perfusion, Delayed Enhancement, and T1- and T2 Mapping
- Affiliations
-
- 1Department of Radiology and Research Institute of Radiological Science, Severance Hospital, Yonsei University College of Medicine, Seoul, Korea
- 2Department of Radiology, Hanyang University Guri Hospital, Hanyang University College of Medicine, Guri, Korea
- 3Department of Radiology, Seoul National University Hospital, Seoul, Korea
- 4Department of Radiology and Research Institute of Radiology, Asan Medical Center, University of Ulsan College of Medicine, Seoul, Korea
- 5Department of Radiology, Incheon St. Mary's Hospital, College of Medicine, The Catholic University of Korea, Incheon, Korea
- 6Department of Radiology, Jeju National University Hospital, Jeju, Korea
- 7Department of Radiology and Research Institute of Radiological Science, Gangnam Severance Hospital, Yonsei University College of Medicine, Seoul, Korea
- 8Department of Radiology, Korea University Guro Hospital, Seoul, Korea
- 9Department of Radiology, Soonchunhyang University Bucheon Hospital, Bucheon, Korea
- 10Department of Radiology, Hanil General Hospital, Seoul, Korea
- 11Department of Radiology, Eunpyeong St. Mary's Hospital, College of Medicine, The Catholic University of Korea, Seoul, Korea
- KMID: 2508213
- DOI: http://doi.org/10.13104/imri.2020.24.1.1
Abstract
- This document is the third part of the guidelines for the interpretation and post-processing of cardiac magnetic resonance (CMR) studies. These consensus recommendations have been developed by a Consensus Committee of the Korean Society of Cardiovascular Imaging (KOSCI) to standardize the requirements for image interpretation and post-processing of CMR. This third part of the recommendations describes tissue characterization modules, including perfusion, late gadolinium enhancement, and T1- and T2 mapping. Additionally, this document provides guidance for visual and quantitative assessment, consisting of “What-to-See,” “How-To,” and common pitfalls for the analysis of each module. The Consensus Committee hopes that this document will contribute to the standardization of image interpretation and post-processing of CMR studies.
Figure
-
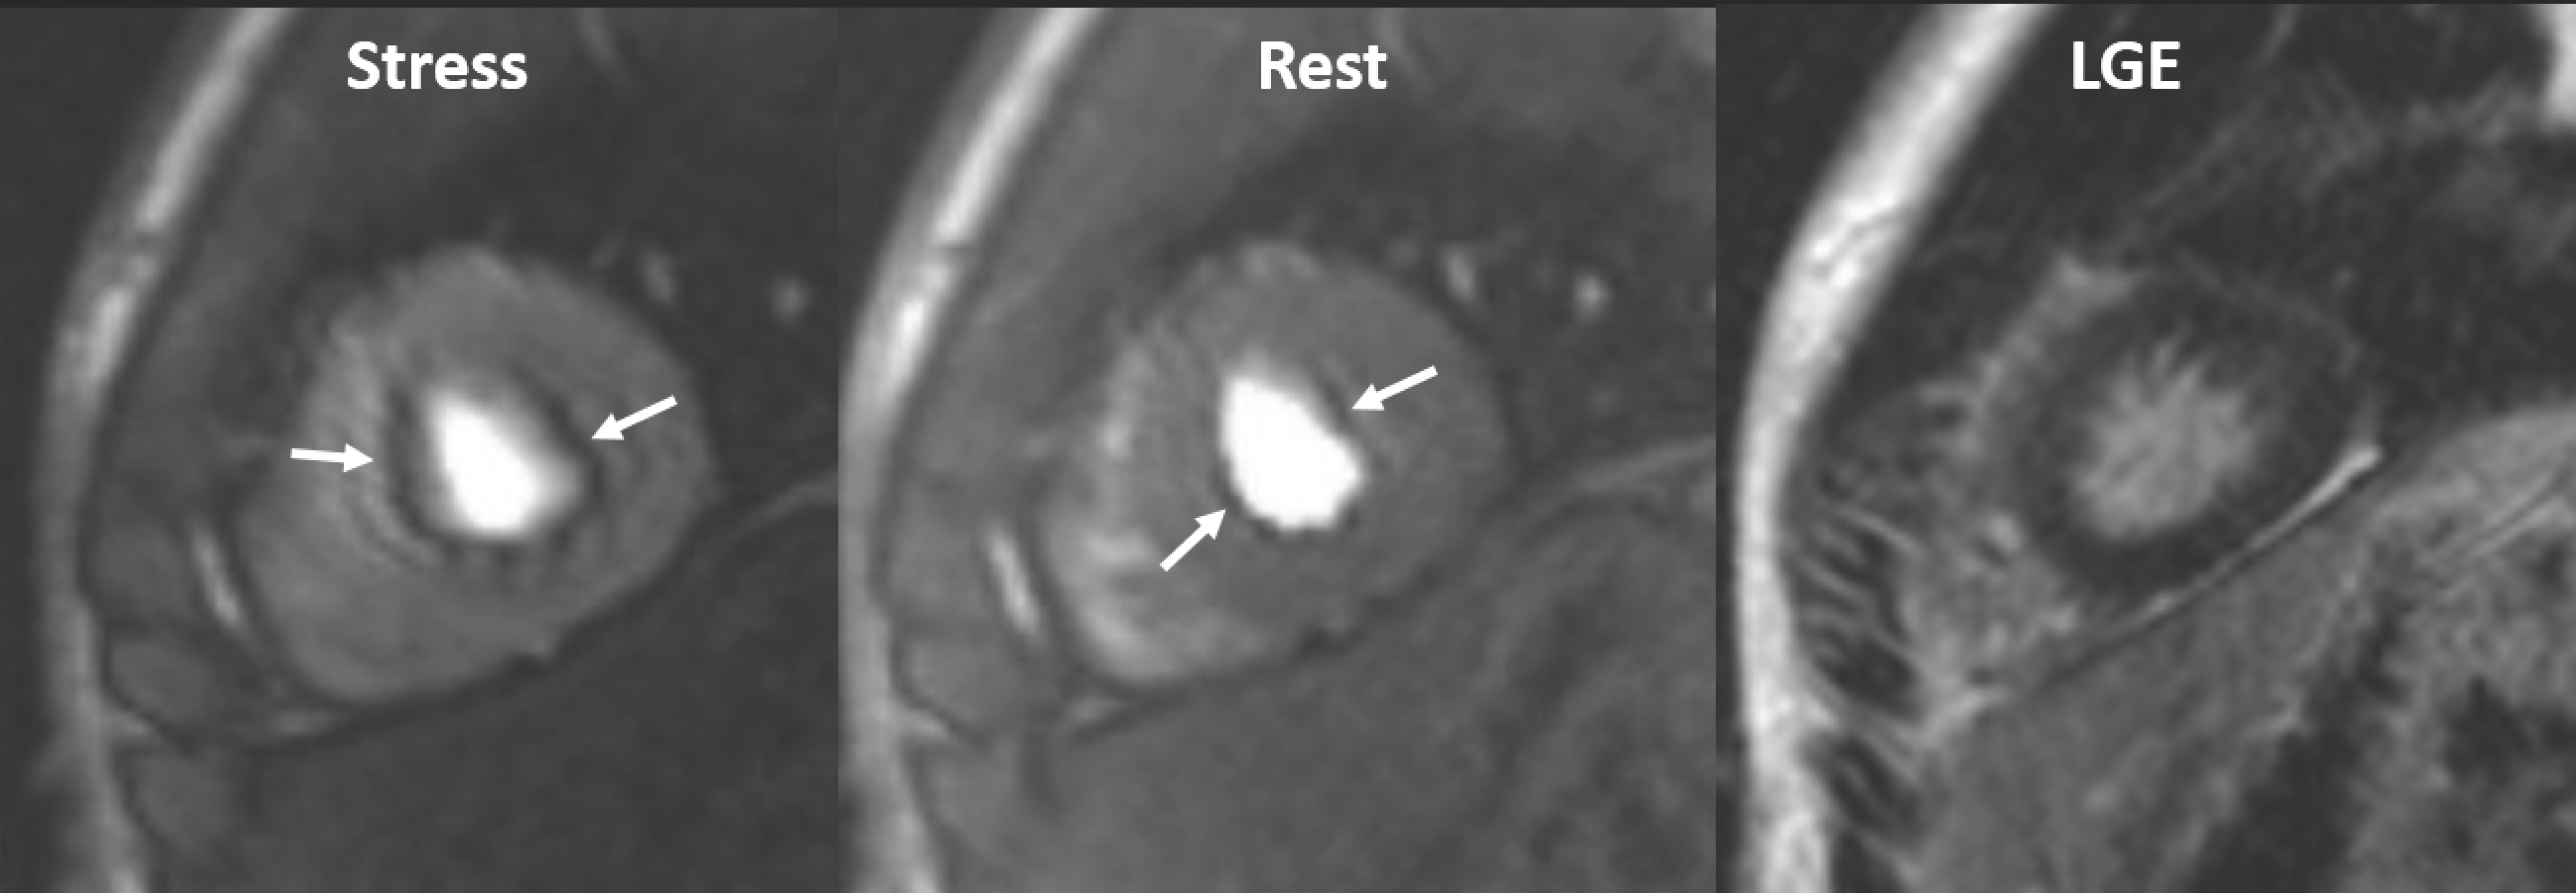
Fig. 1. Dark banding artifact in 18-year-old man. Defect (arrows) is approximately one pixel wide, prominent in phase-encoding direction (right-left in this case), and already appears before contrast reaches myocardium. Even though this defect is seen on both stress and rest perfusion images, there is no delayed enhancement in corresponding region on LGE image. LGE = late gadolinium enhancement
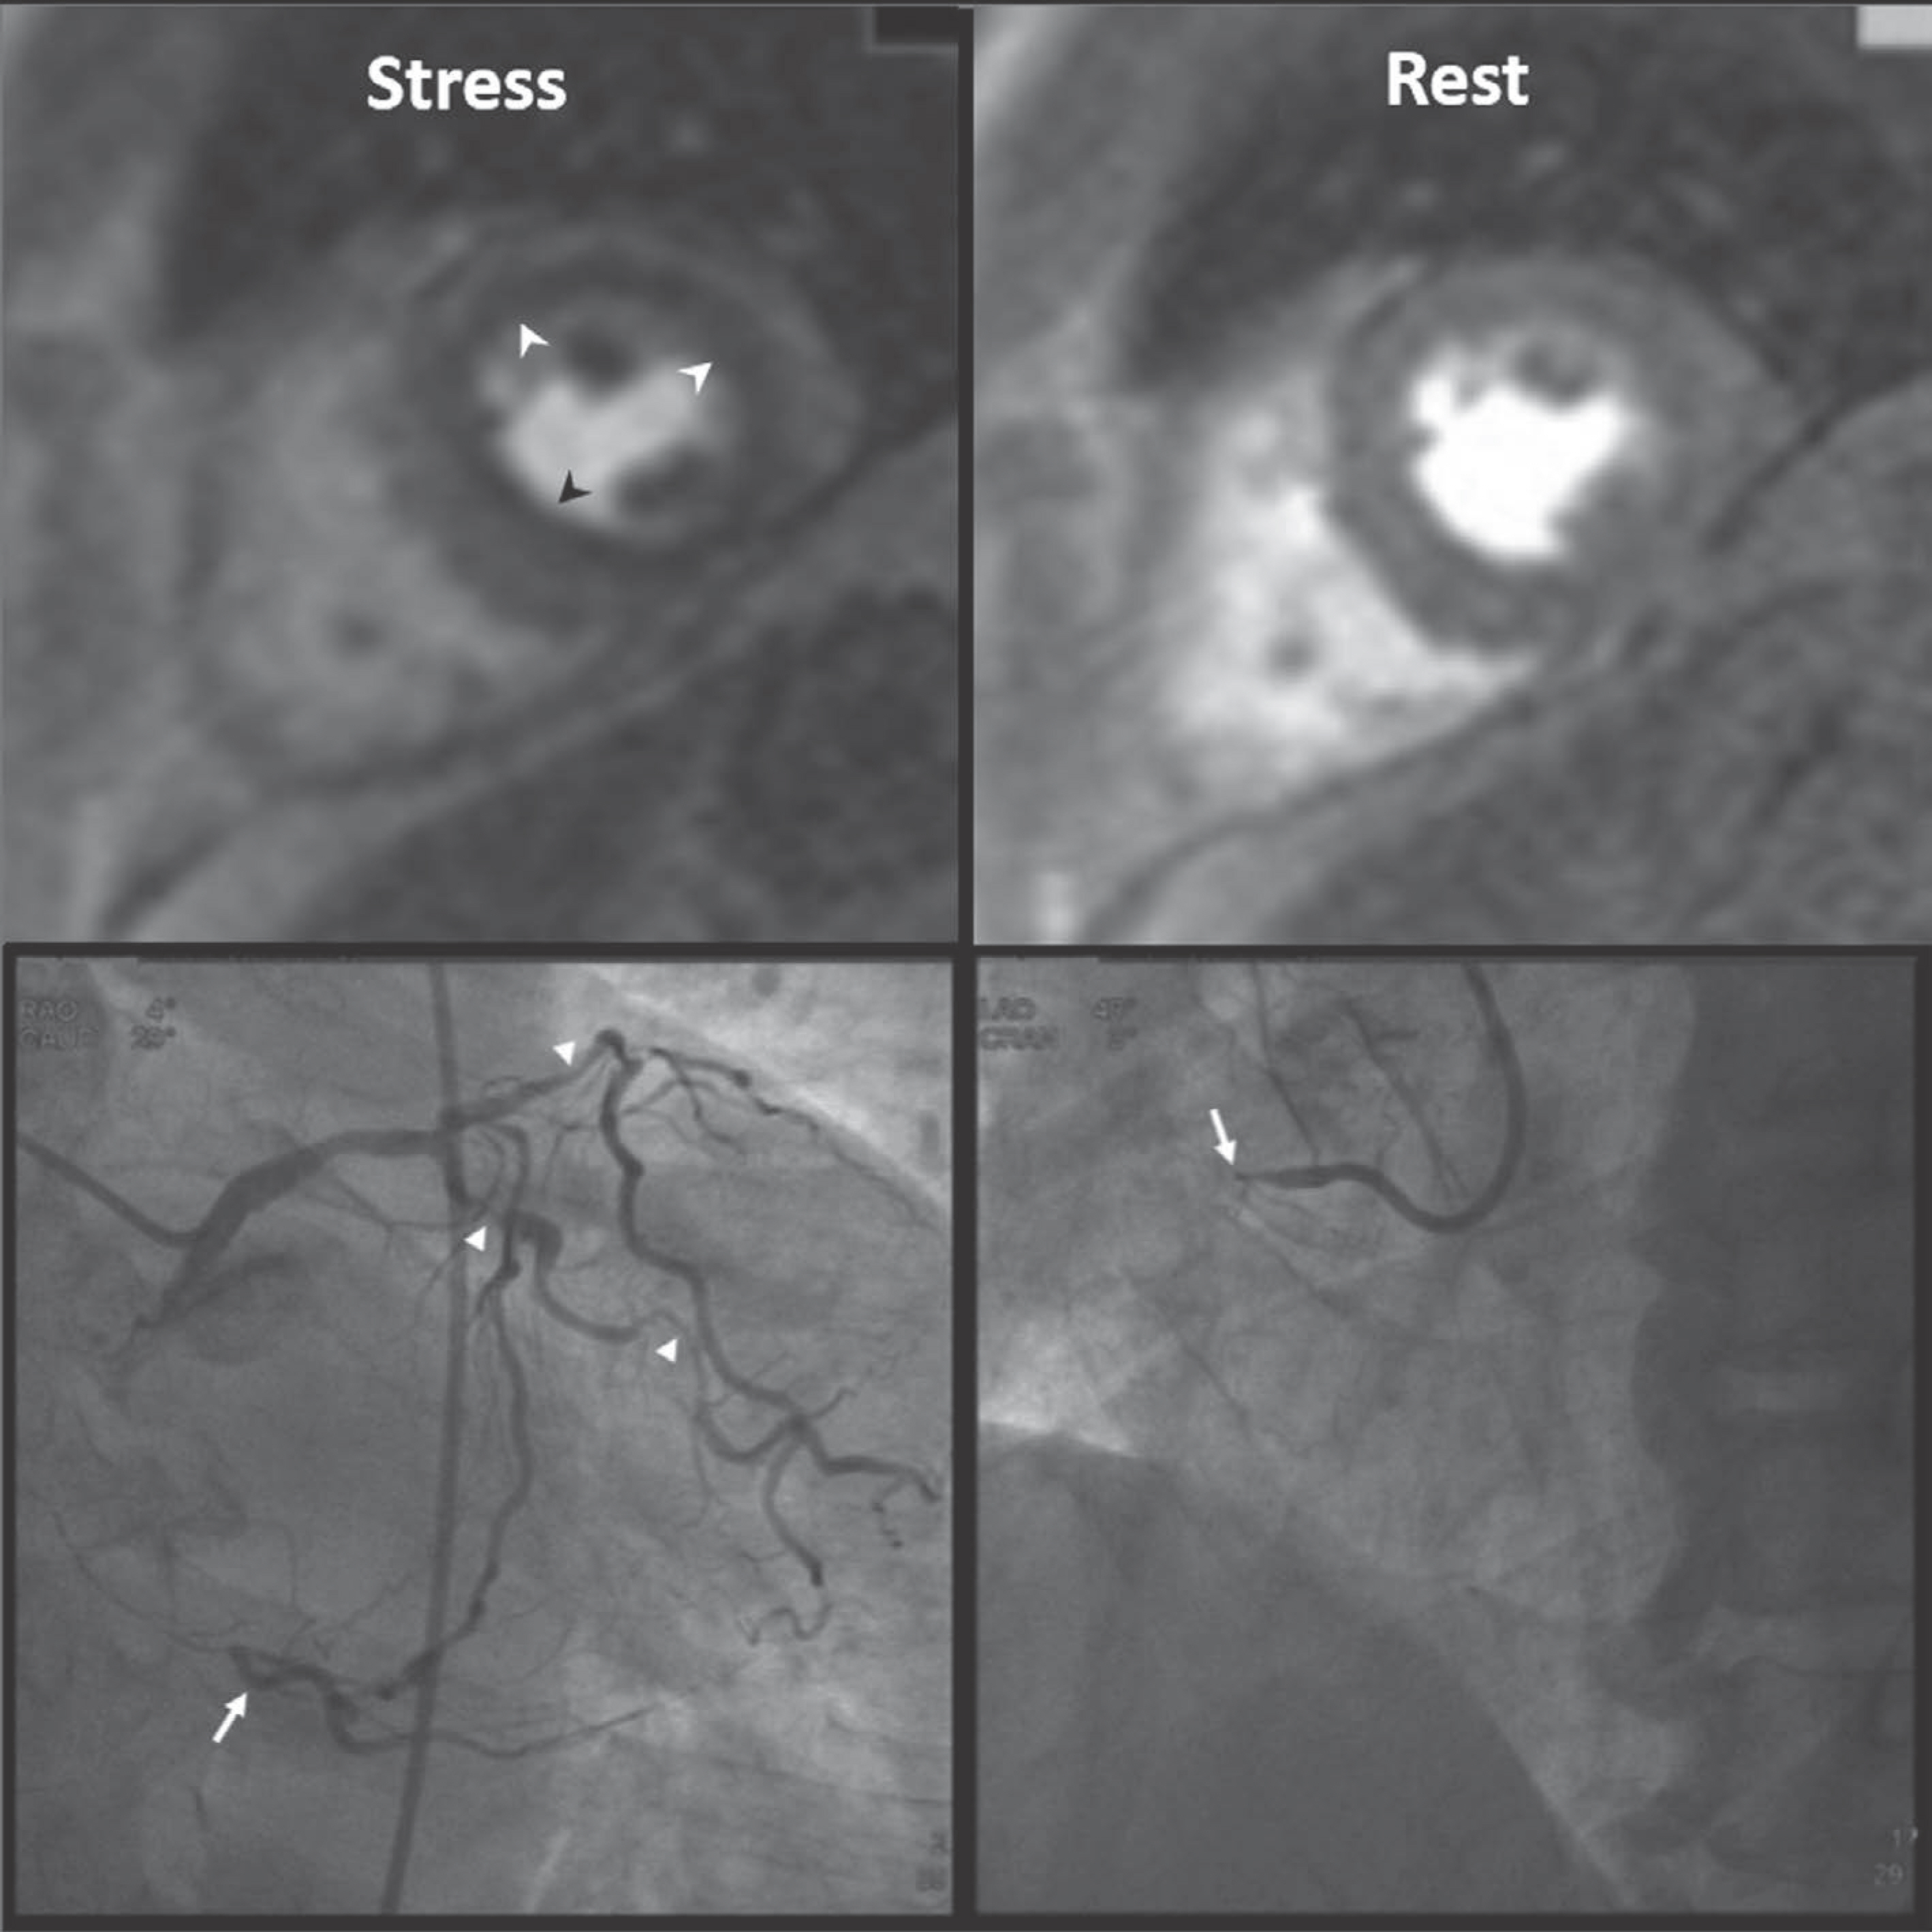
Fig. 2. Three-vessel disease in 70-year-old man. Ring-like subendocardial perfusion defect (arrowheads) is seen on stress, and disappears on rest images (upper row). Differentiation from microvascular disease may be challenging. Patient had multifocal severe stenosis (arrowheads) at left anterior descending and left circumflex coronary arteries. Right coronary artery angiogram (on right lower) shows total occlusion (arrow) at proximal segment, and distal segment (arrow) reconstituted via big septal branch is seen on left coronary angiogram (on left lower) (Courtesy of Sung-A Chang, Samsung Medical Center).
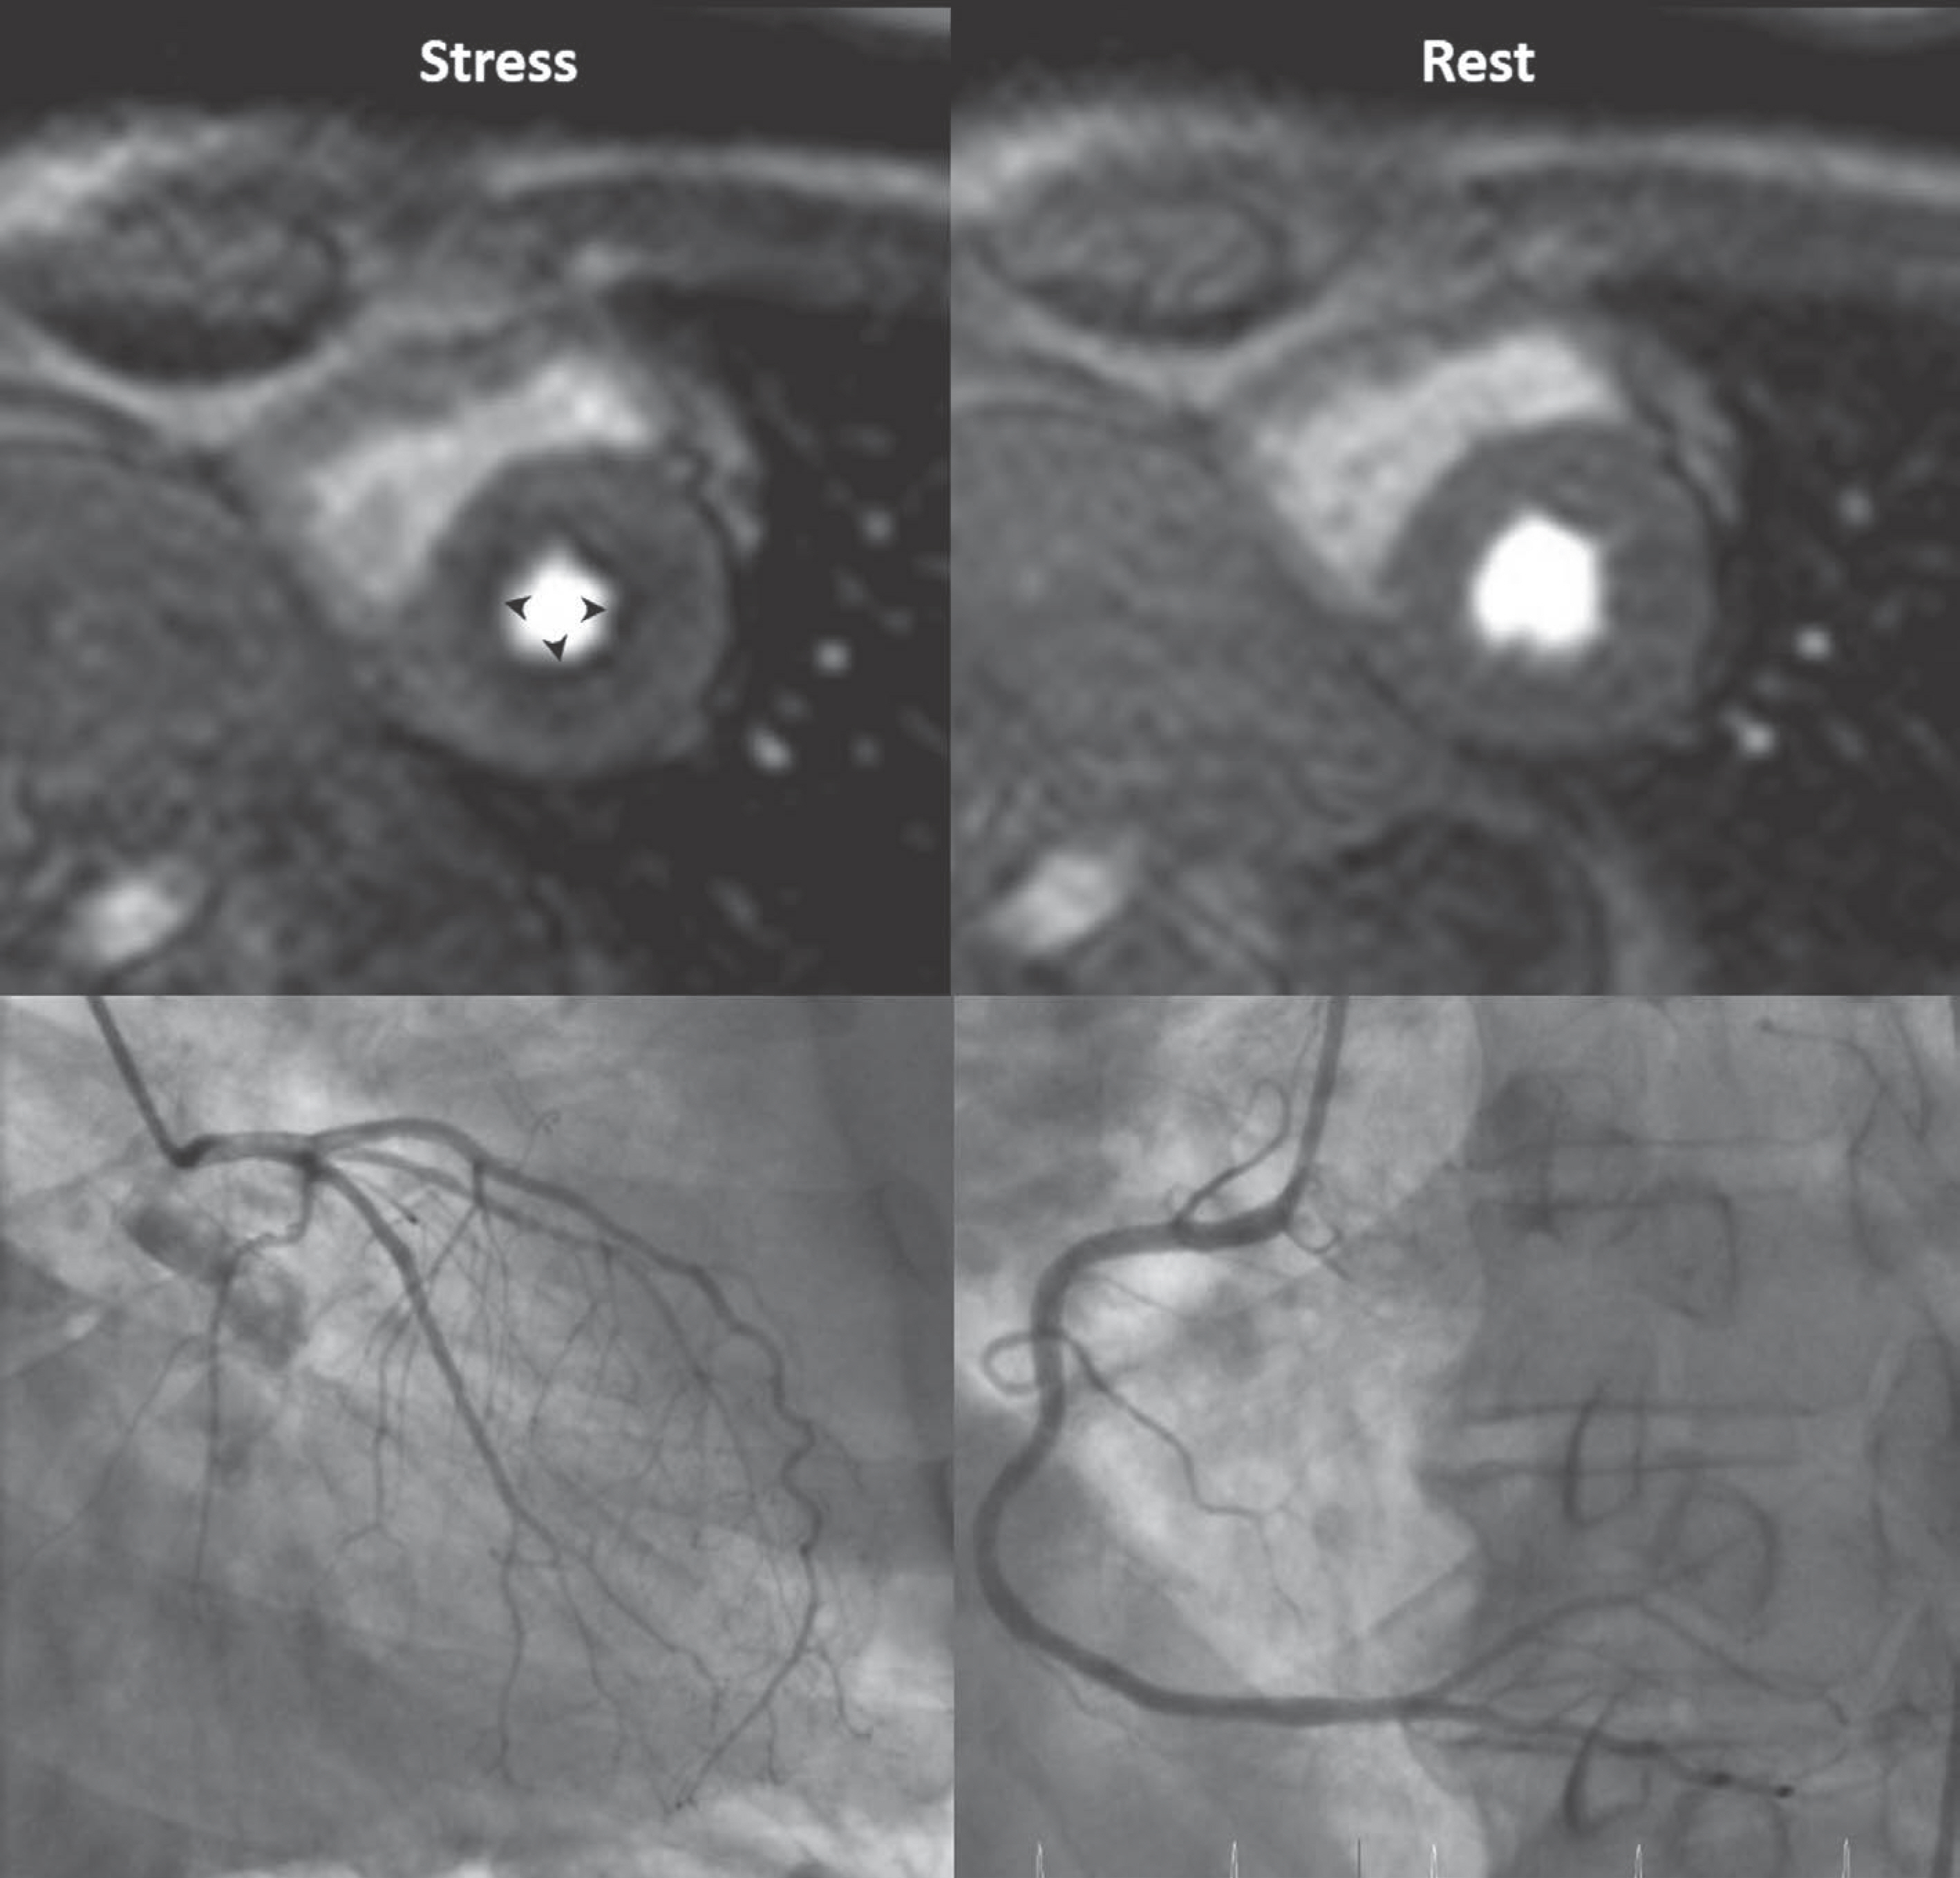
Fig. 3. Microvascular disease in 73-year-old man with 20-year history of diabetes mellitus. Patient complains of chest pain. Invasive coronary angiography shows insignificant findings. Note global subendocardial perfusion defect (arrowheads), which is more than one pixel wide on stress perfusion images.
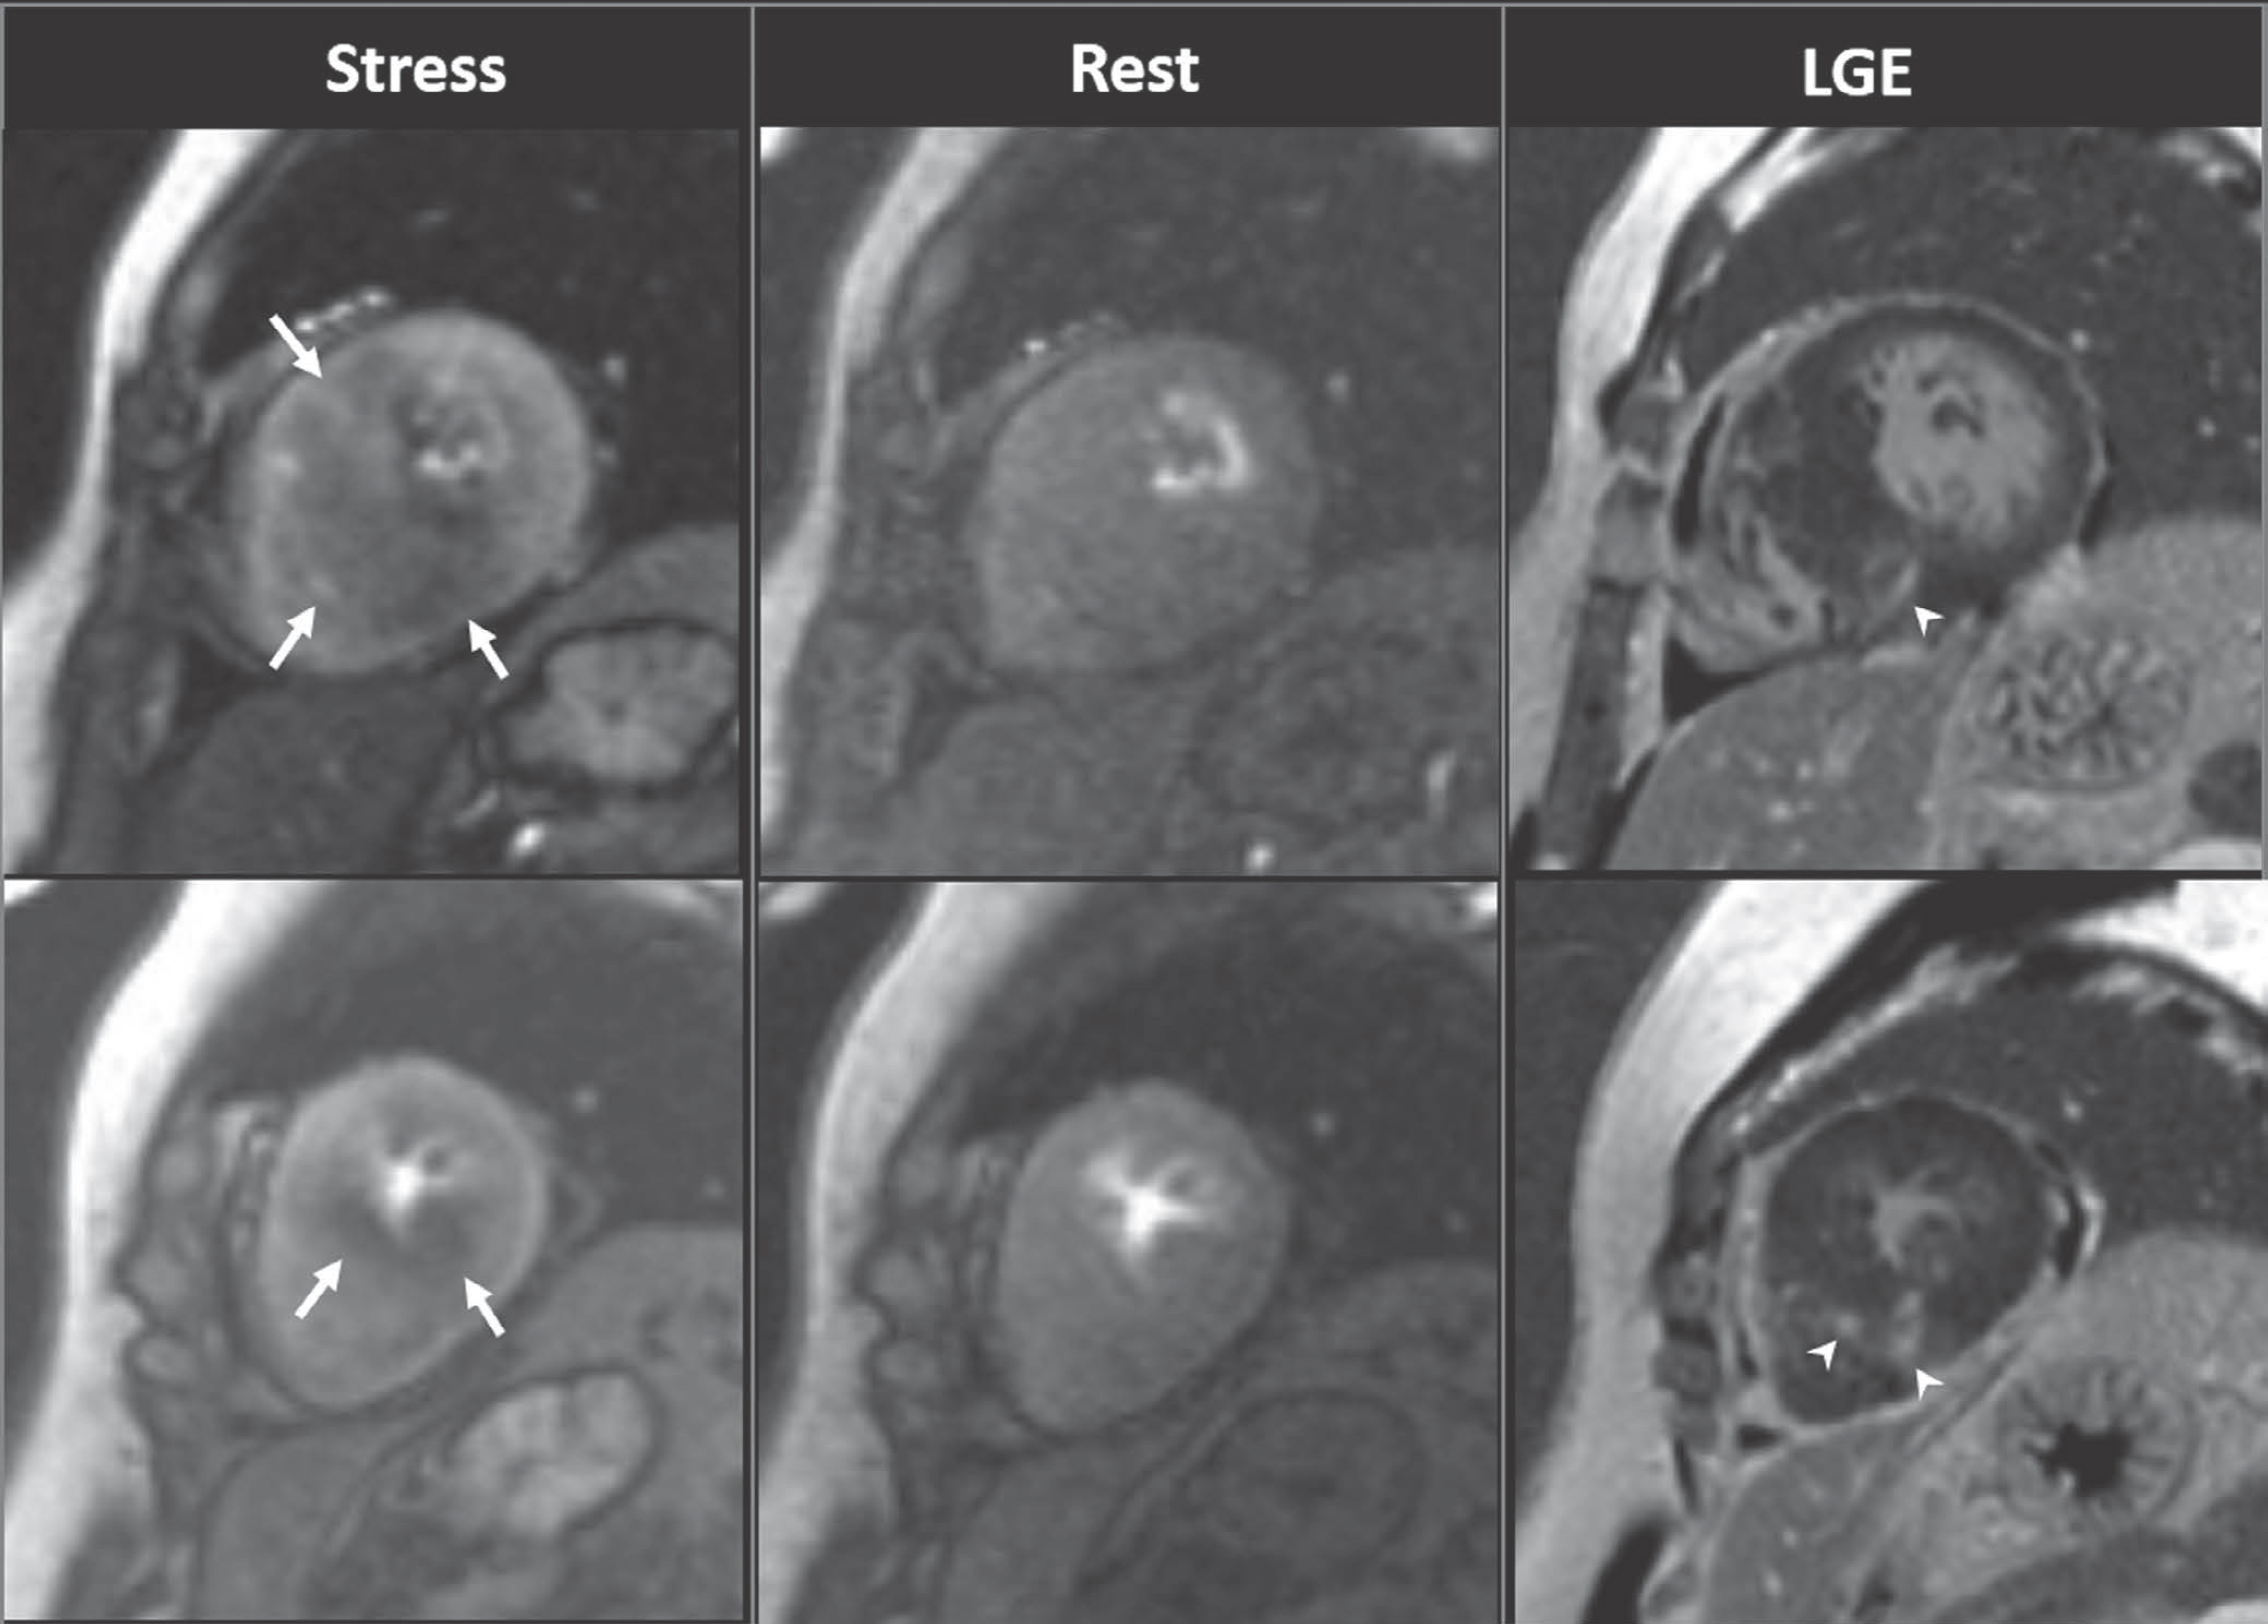
Fig. 4. Inducible ischemia in 52-year-old woman with septal-type HCM. Inducible, global, subendocardial perfusion defects (arrows) are present in mid to apical segments, and extent of defects is greater in hypertrophied septum of left ventricle on stress images. Compared to LGE images, fibrosis (arrowheads) exists within area of ischemia and is smaller than perfusion defects. HCM = hypertrophic cardiomyopathy
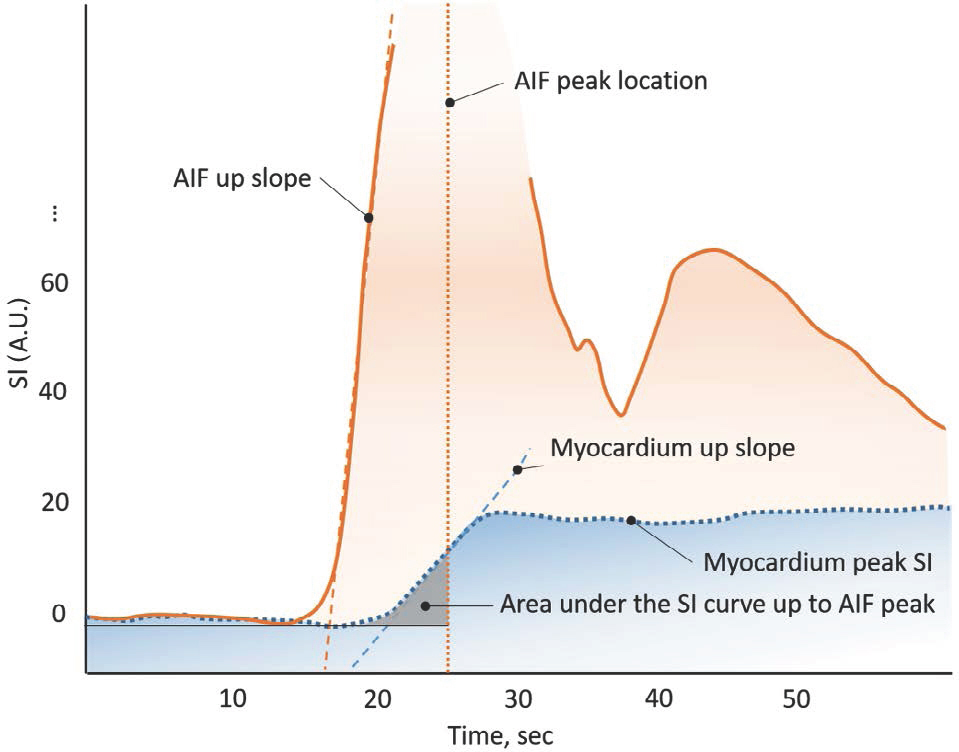
Fig. 5. Inducible ischemia and delayed perfusion in 50-year-old man who underwe saphenous venous Y graft (arrow) to posterior descending coronary artery (Adapted from Kim et al. Korean J Radiol 2014;15:188-194 (8)).
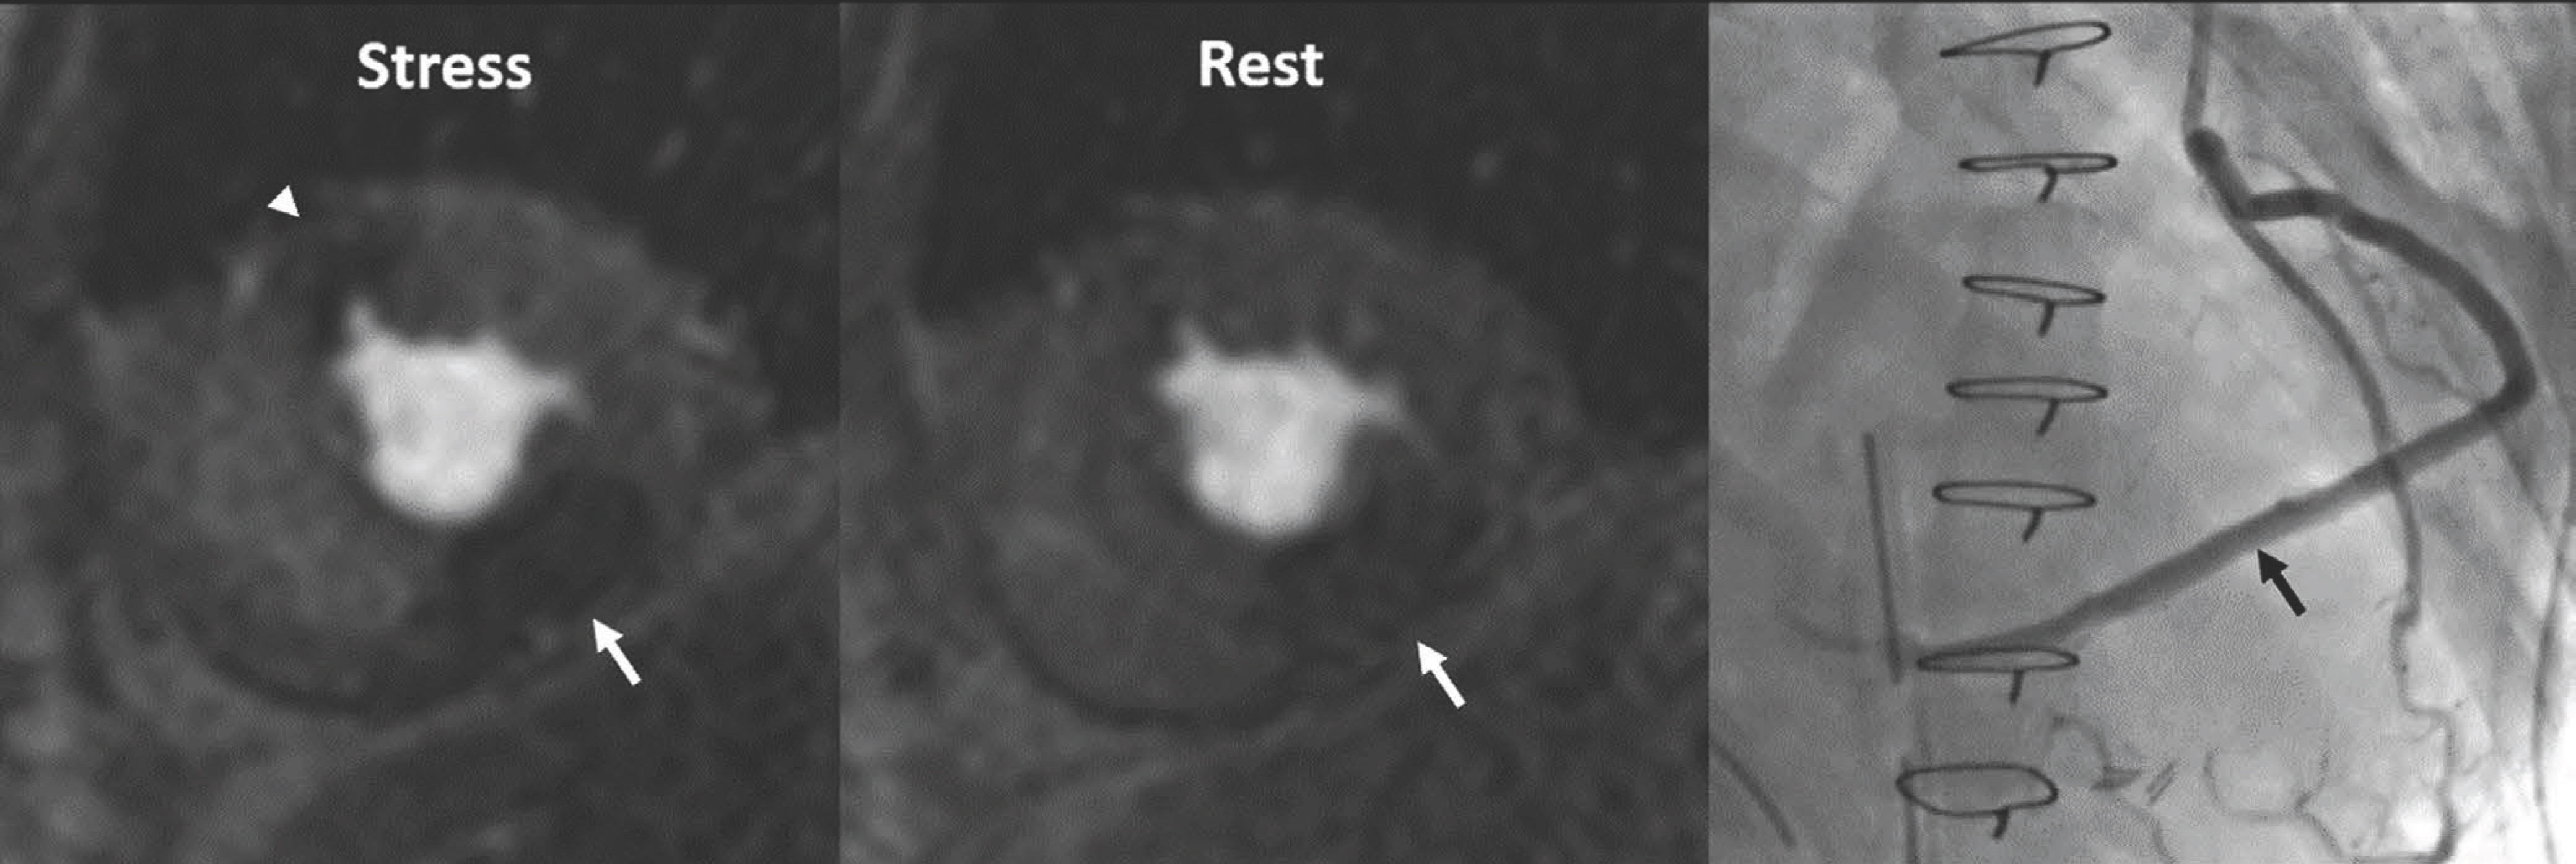
Fig. 6. Simple diagram exhibiting semi-quantitative perfusion parameters. AIF = arterial input function; SI = signal intensity
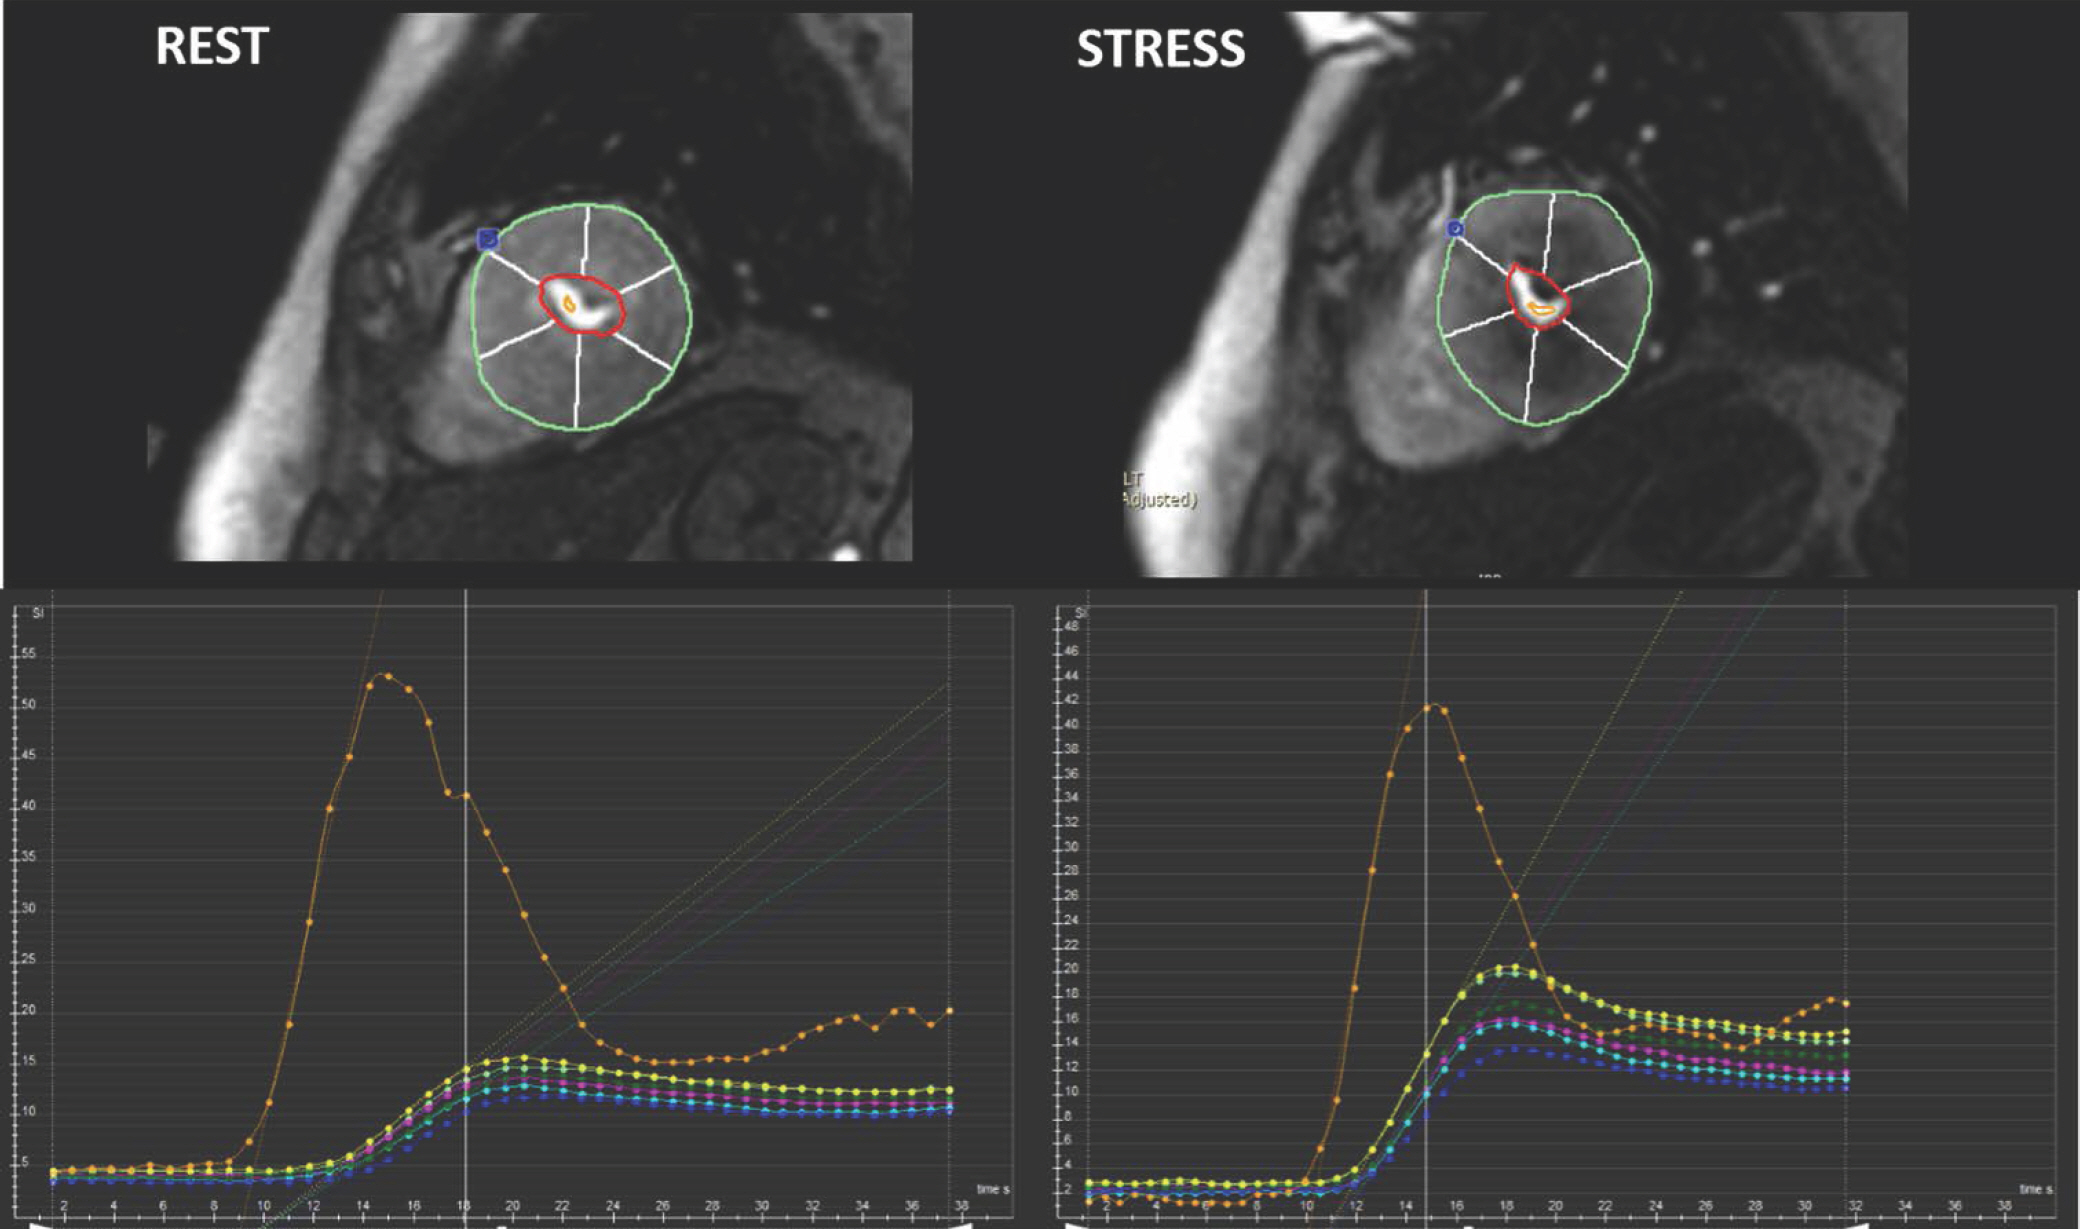
Fig. 7. Example of semi-quantitative perfusion analysis using dedicated software. Regional maximal up-slope values are demonstrated based on 17-segment model on time-SI profile. Blue dot in anterior junction of right ventricular insertion point indicates reference point in left ventricular myocardium for segmentation.
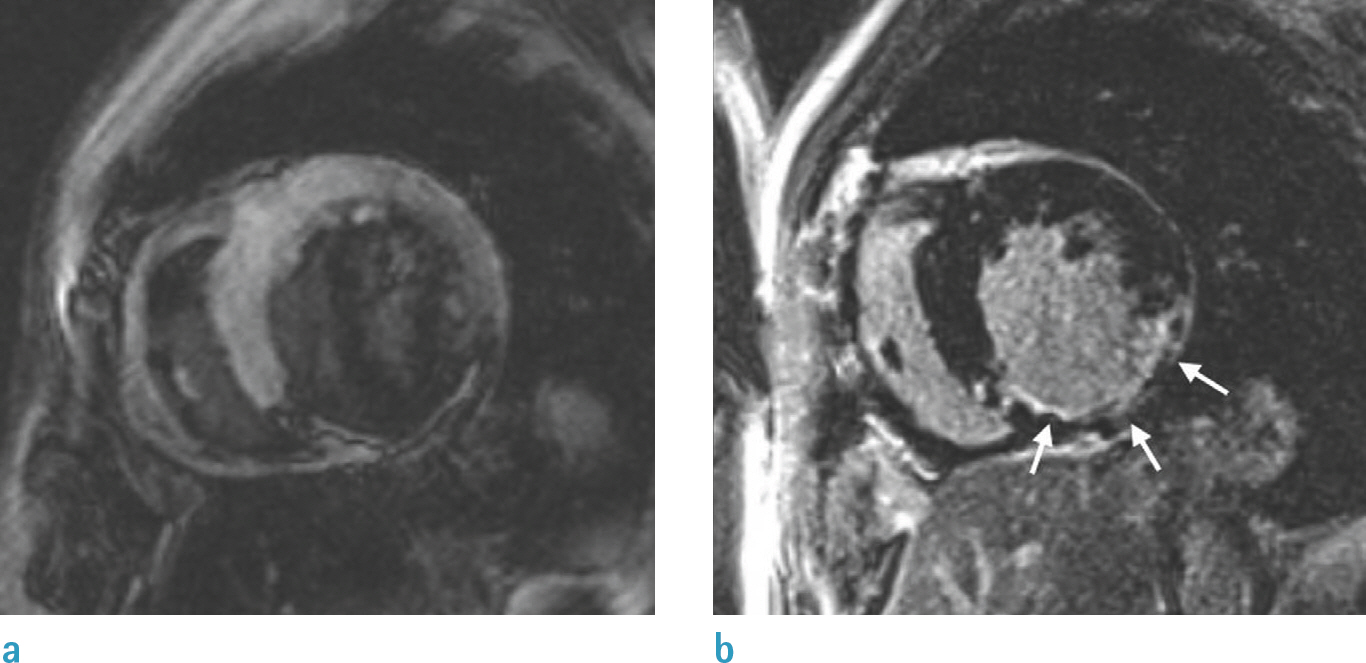
Fig. 8. Role of TI in LGE imaging. Left image (a) shows wrong nulling of normal myocardium that is shown to be darkest at border with higher SI centrally. These findings signify that degree of LGE may be underestimated if TI is too short. Right image (b) shows optimal nulling of myocardium with repeated image taken at longer TI and demonstrates larger LGE area in inferior wall (arrows). TI = inversion time
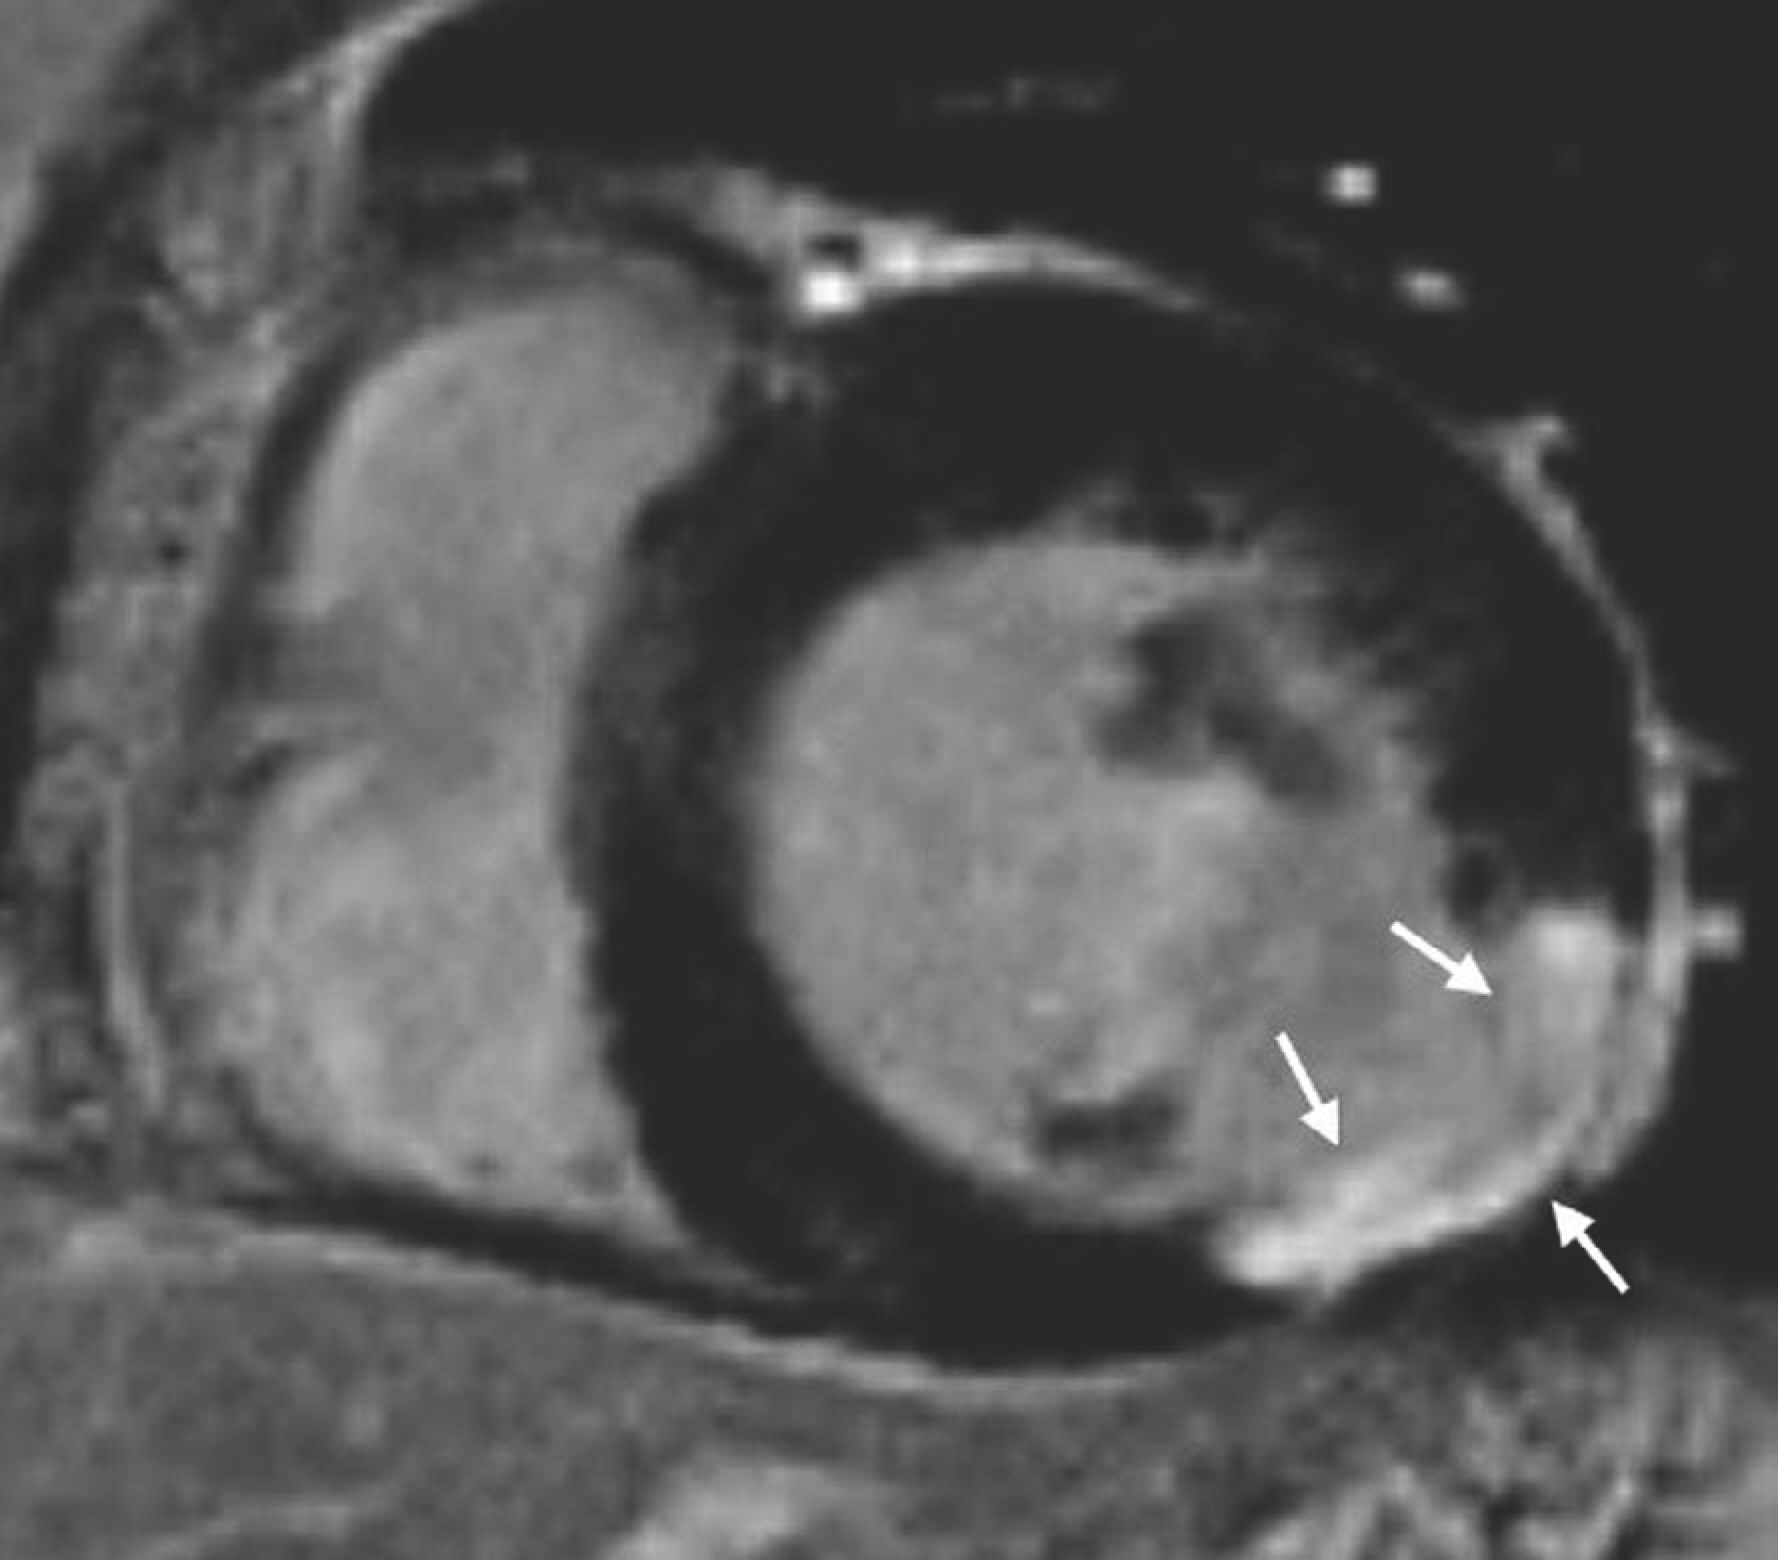
Fig. 9. Pattern assessment in LGE image in patient with coronary artery disease. Most important finding of ischemic pattern is that LGE lesion follows coronary artery distribution. This patient shows delayed enhancement (arrows) at mid inferolateral wall of left ventricular myocardium, indicating left circumflex artery territory. Lesion of ischemic pattern starts at endocardium extending toward epicardium, according to concept of wave front phenomenon of myocardial death.
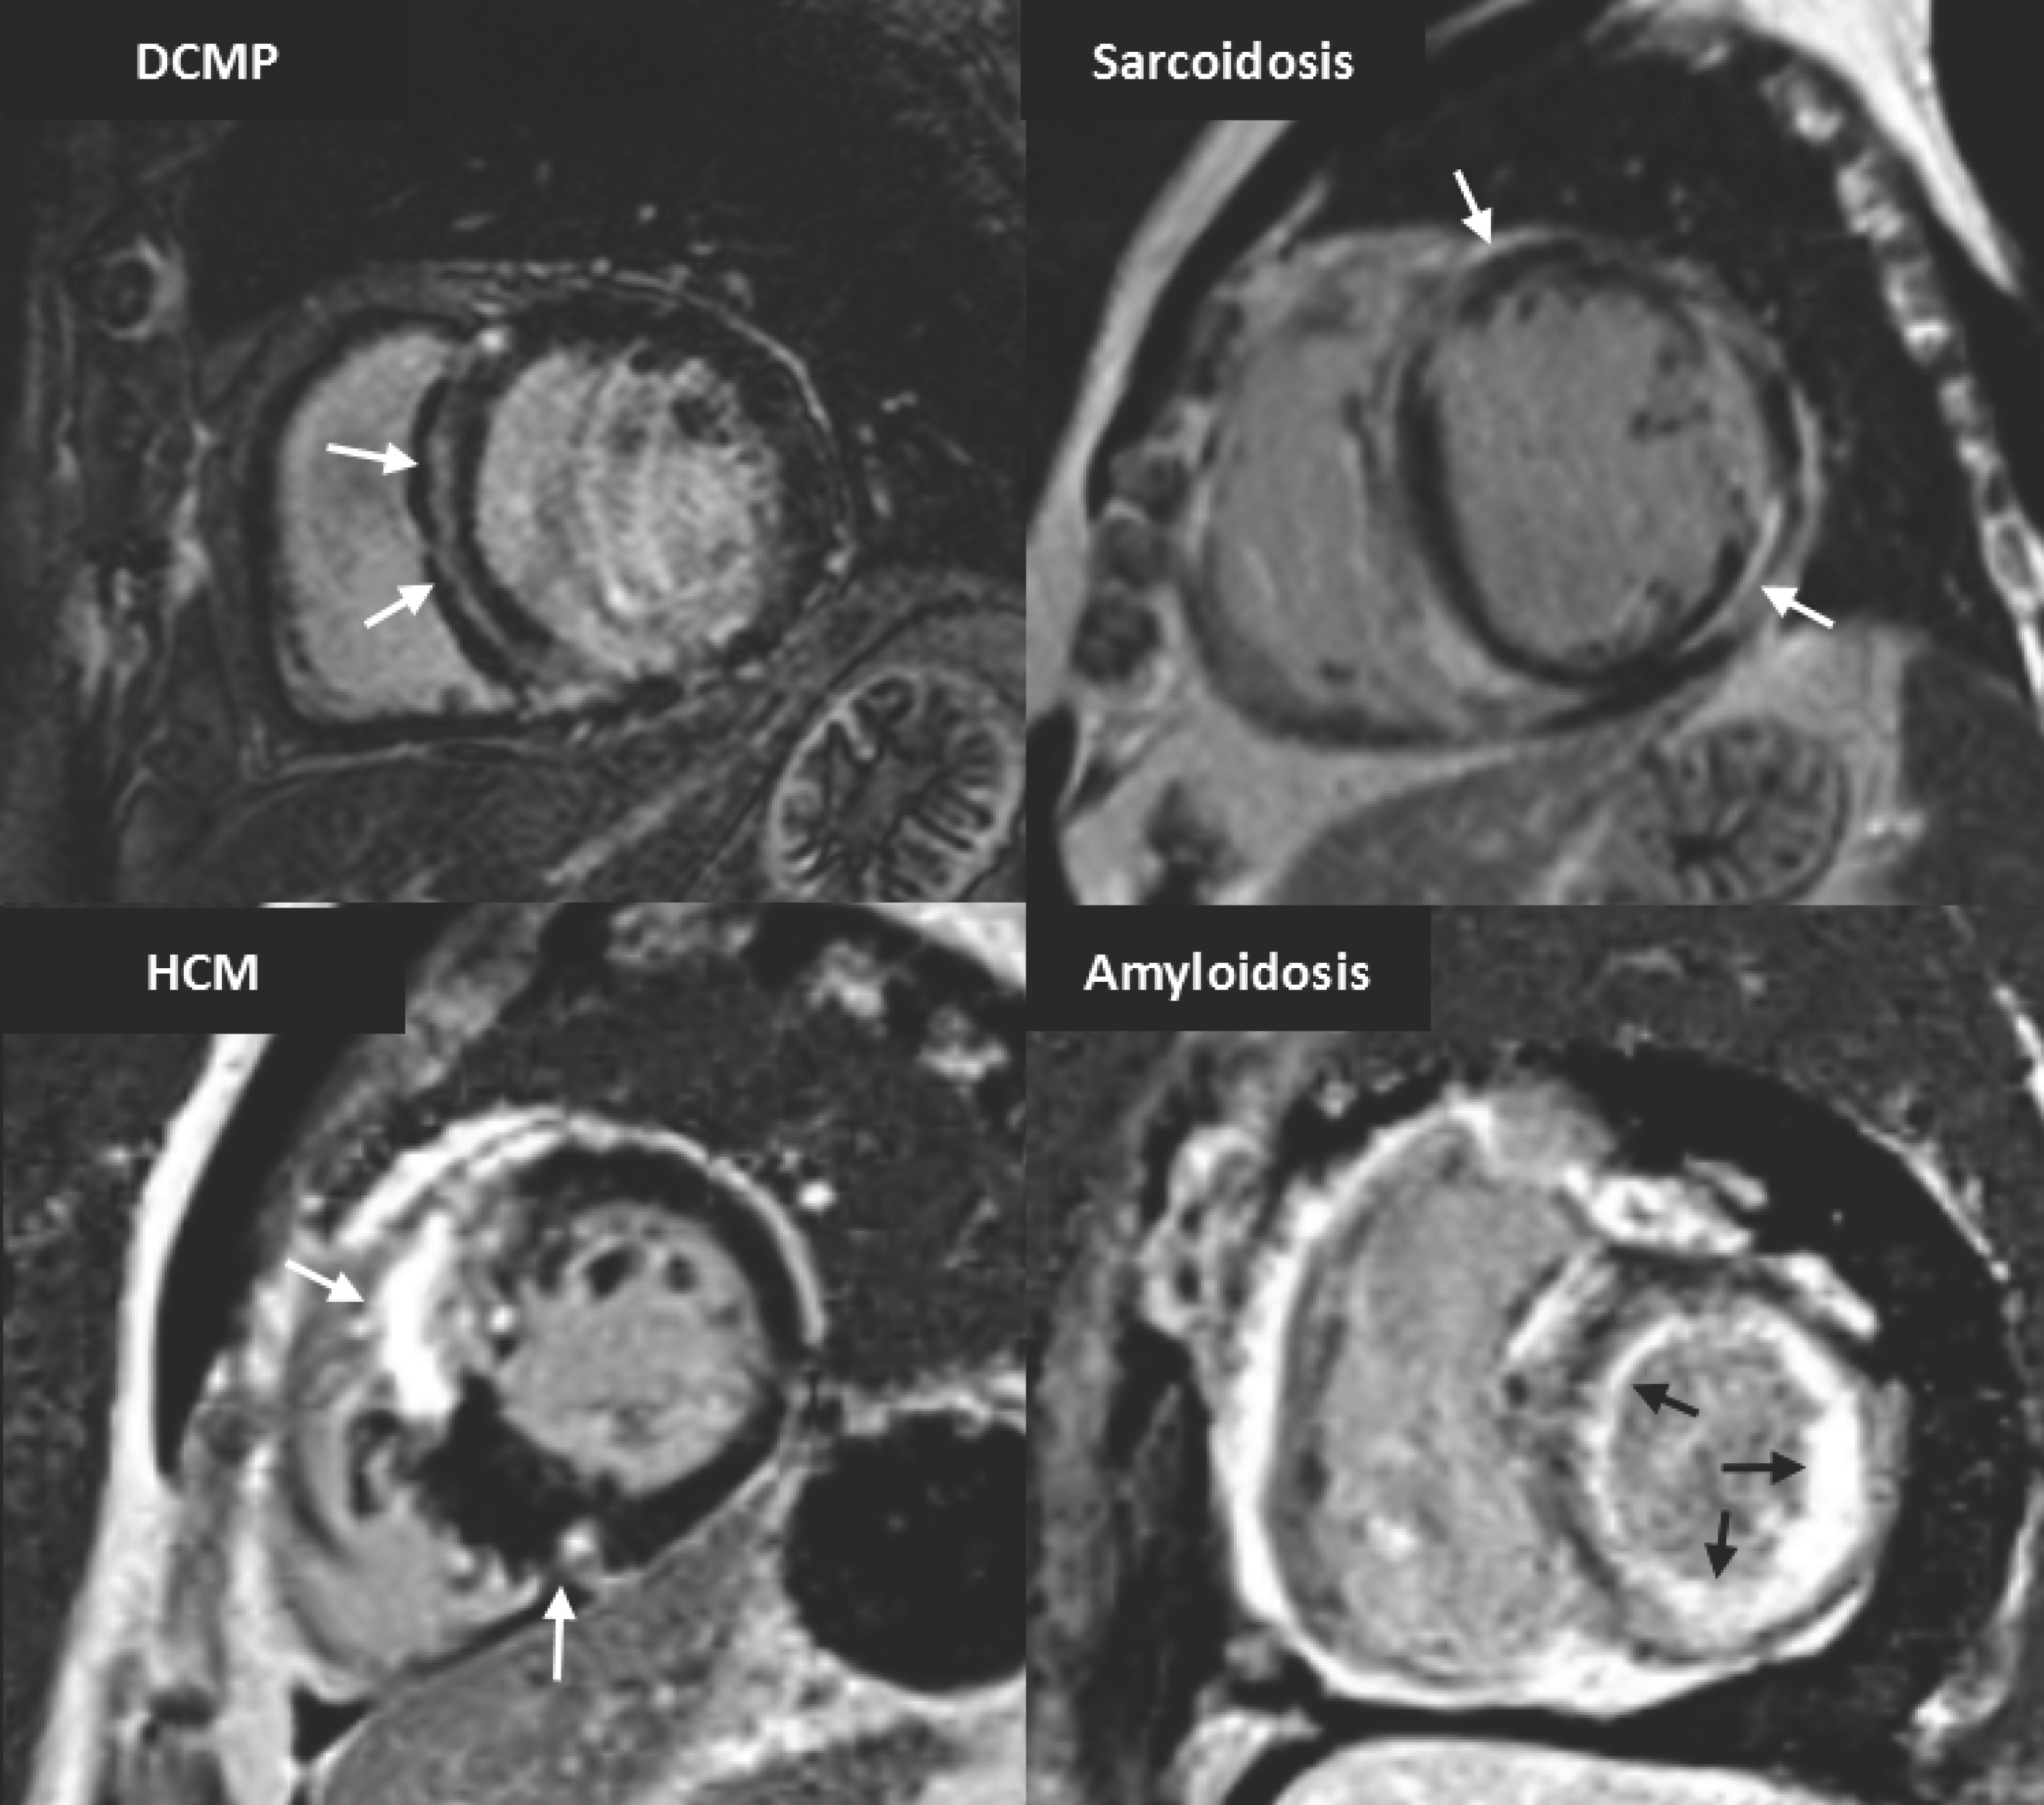
Fig. 10. Short-axis MR images demonstrate LGE pattern in various types of non-ischemic cardiomyopathy. There is mid-wall enhancement in basal, interventricular, septal wall of myocardium in patient with DCM (black arrows), epicardial enhancement in patient with sarcoidosis (white arrows), patchy enhancement at junction of both ventricles in patient with HCM (white arrows), and global subendocardial enhancement in patient with amyloidosis (white arrows). DCM = dilated cardiomyopathy
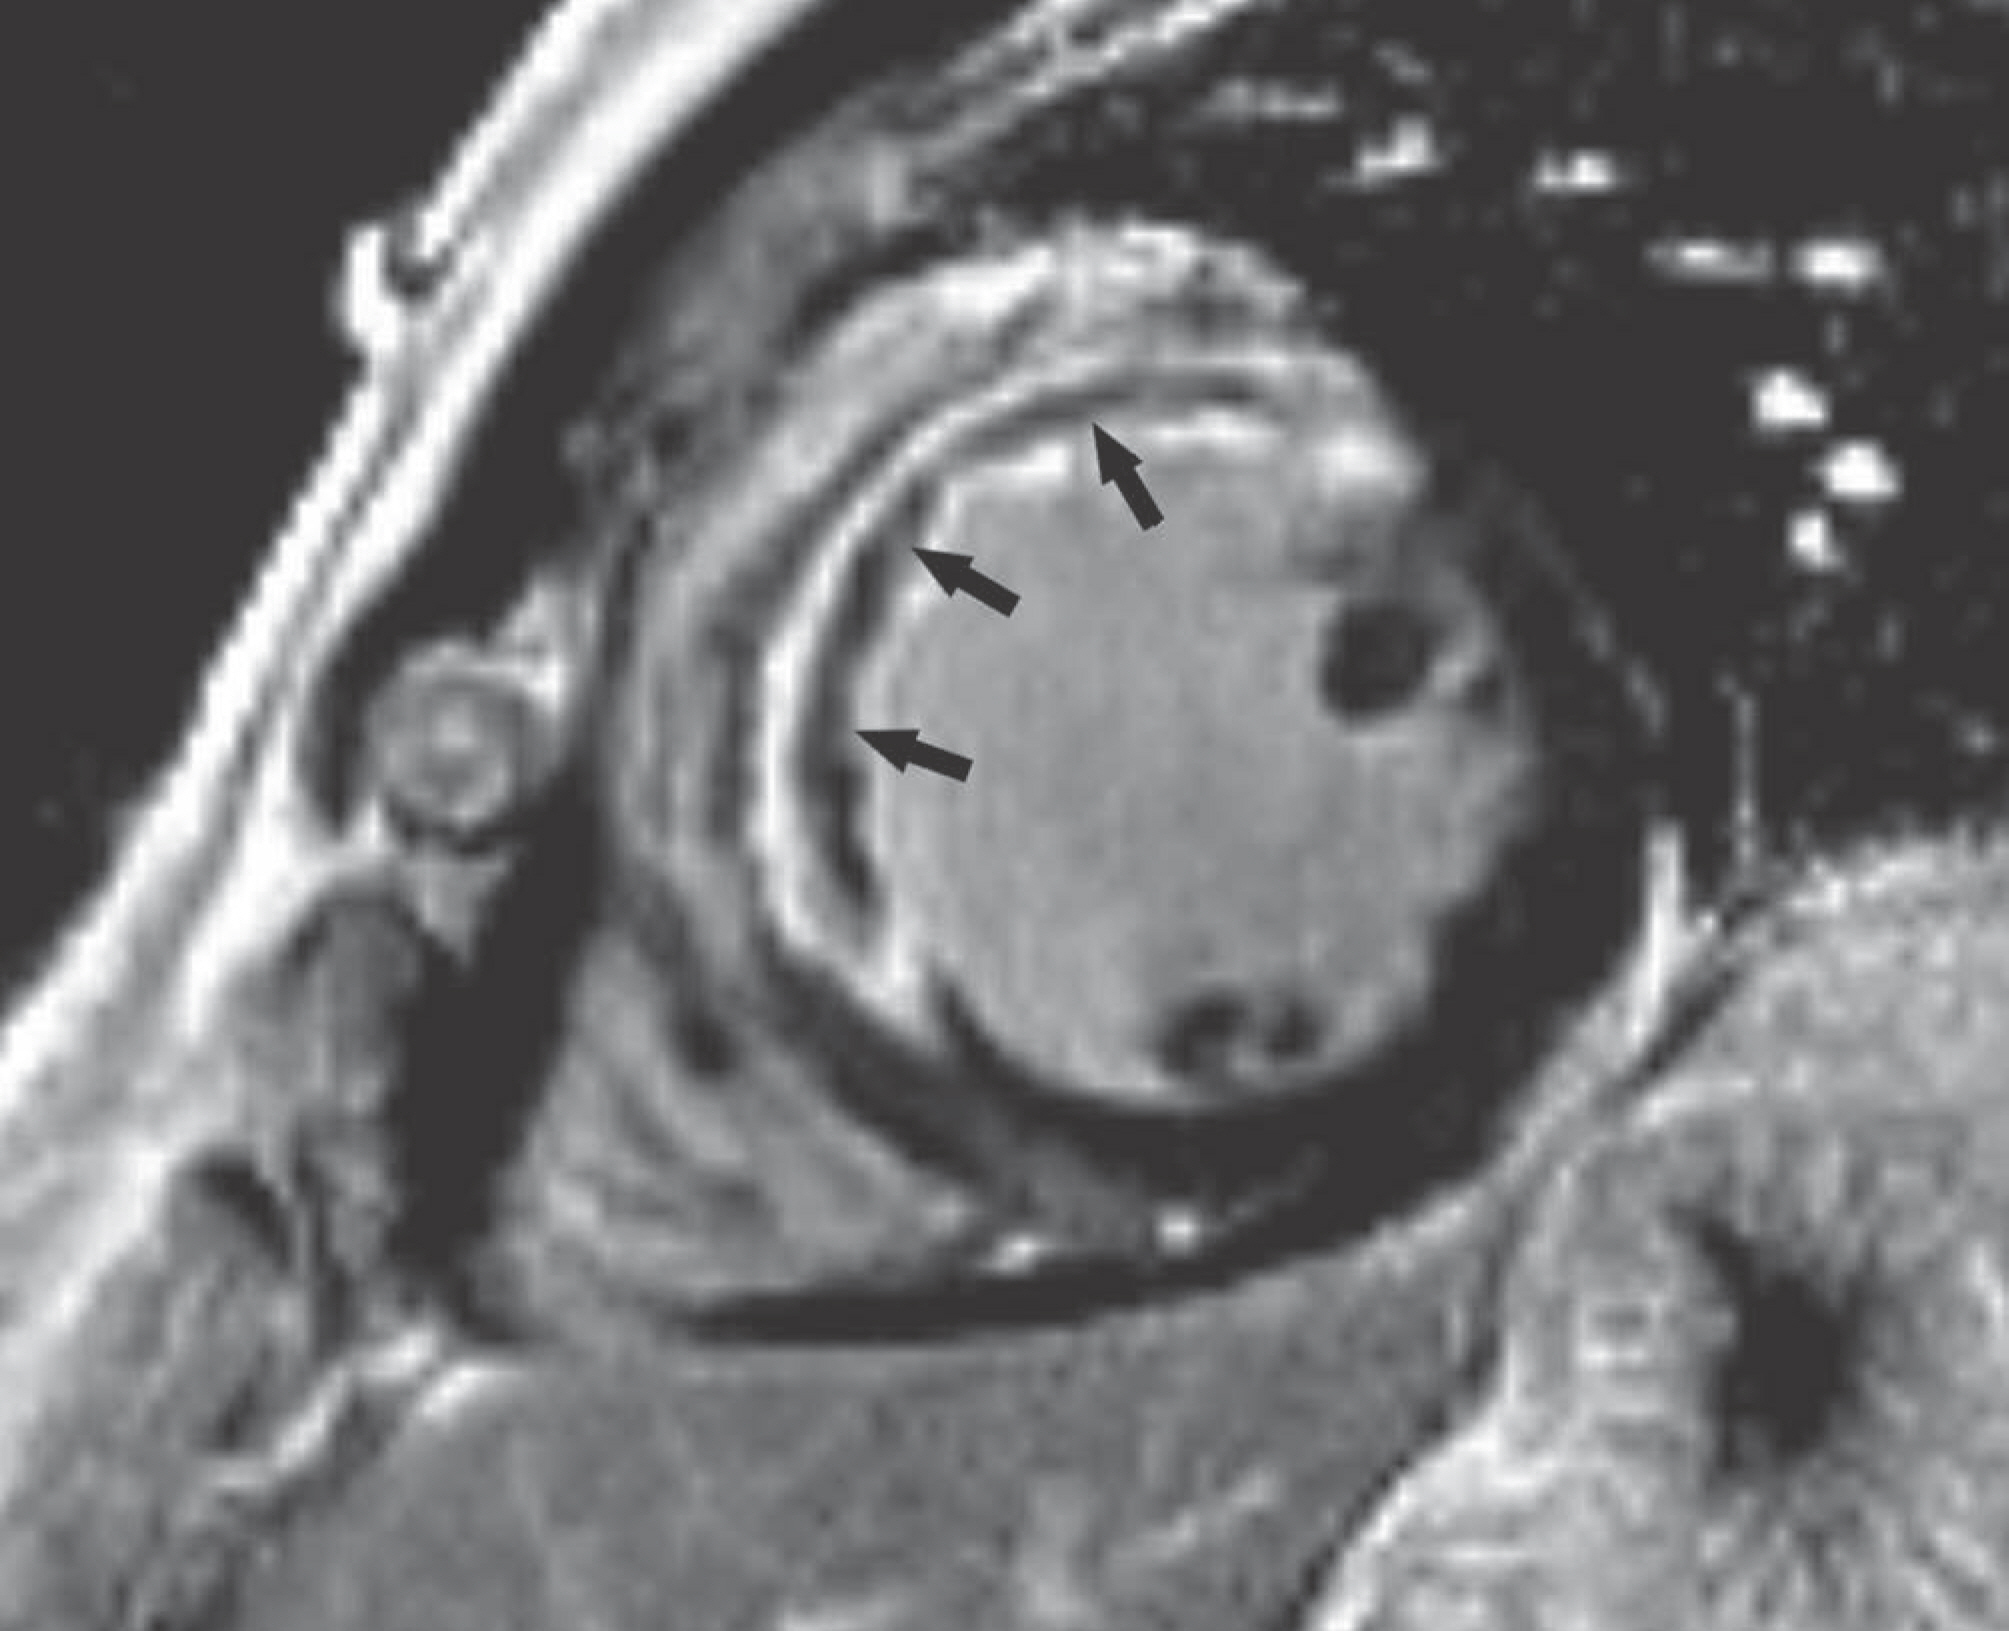
Fig. 11. Short-axis LGE image in 49-year-old man with exertional chest pain performed 5 days after primary percutaneous coronary intervention to left anterior descending artery. Full-thickness infarct within anterior and anteroseptal left ventricular mid-wall with microvascular obstruction (arrows) is shown as central hypo-enhanced region within avidly hyper-enhanced region of infarcted myocardium on LGE image.
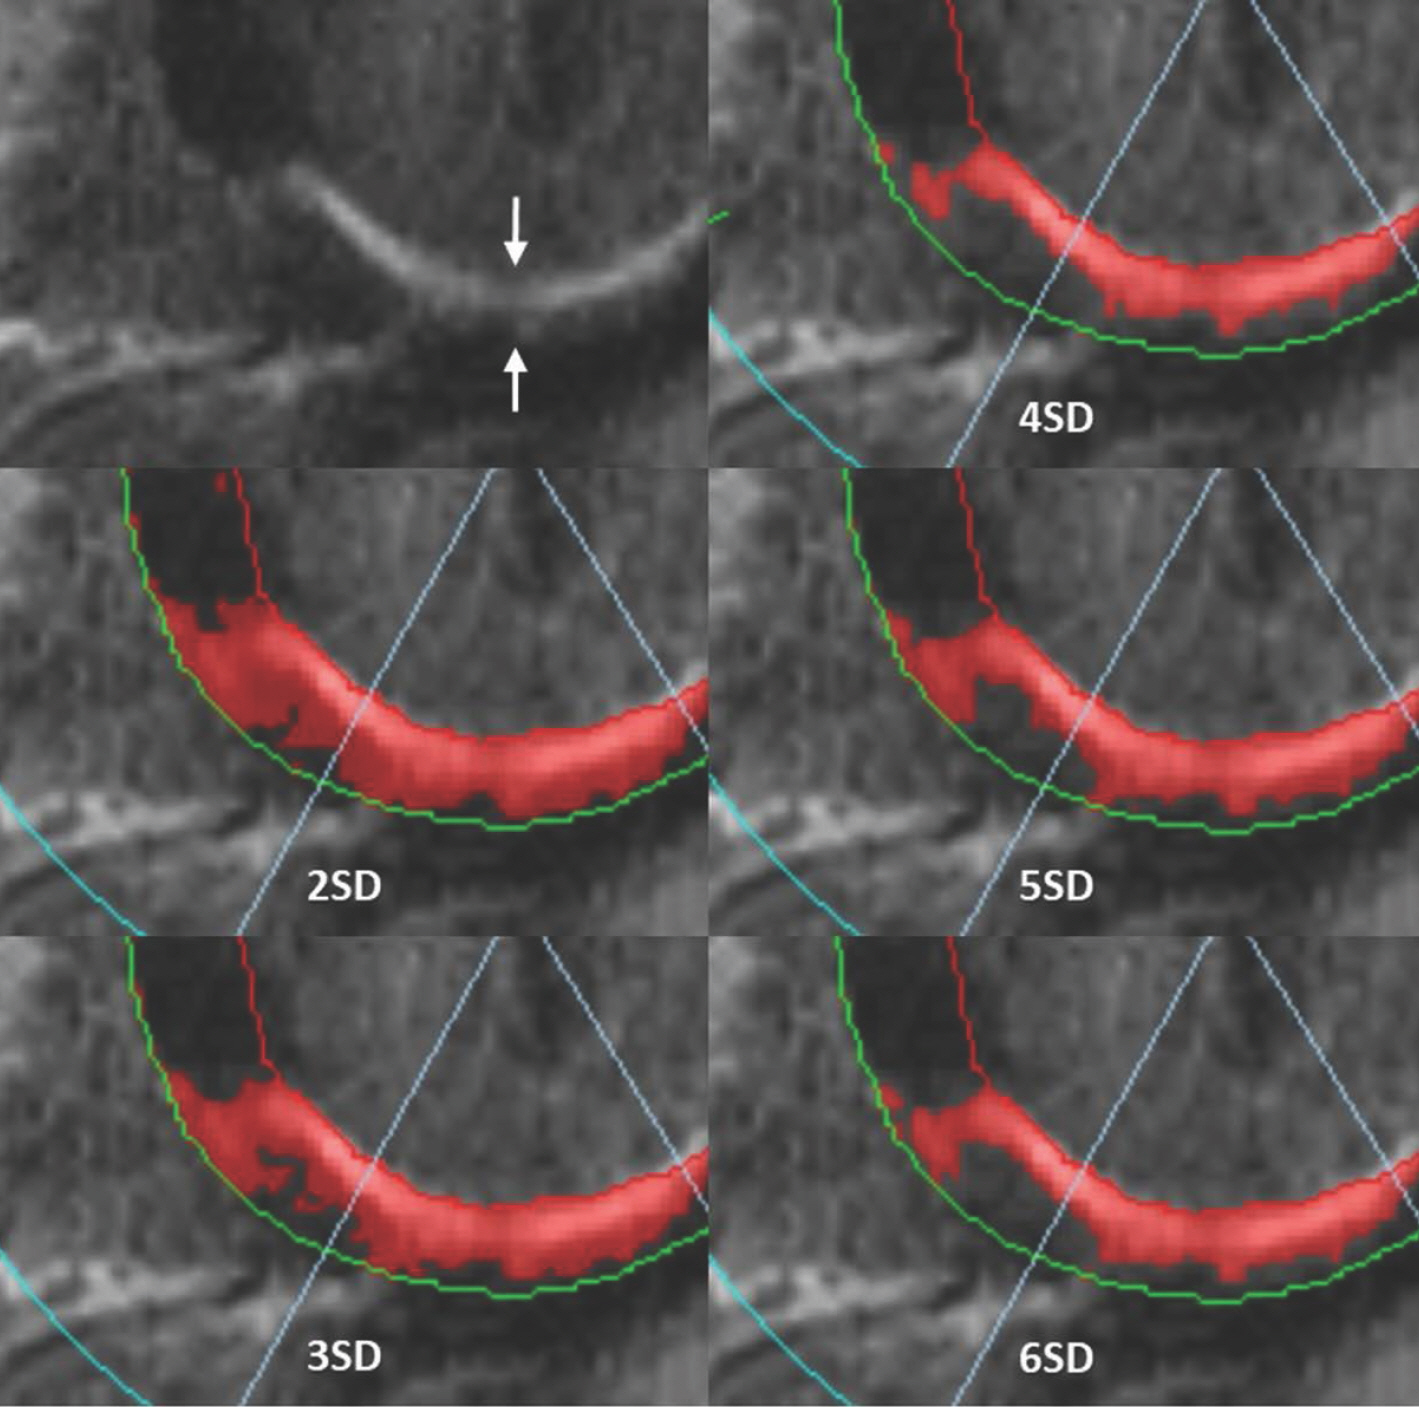
Fig. 12. “n”-SD technique for quantifying LGE extent. LGE image in 57-year-old man with chest pain shows subendocardial infarction at basal inferior wall of myocardium (arrows). Endocardial and epicardial borders are outlined and region of interest within remote dark myocardium as reference is drawn. According to threshold between enhanced and unenhanced myocardium selected, extent of LGE varies significantly as shown in these color maps. SD = standard deviation
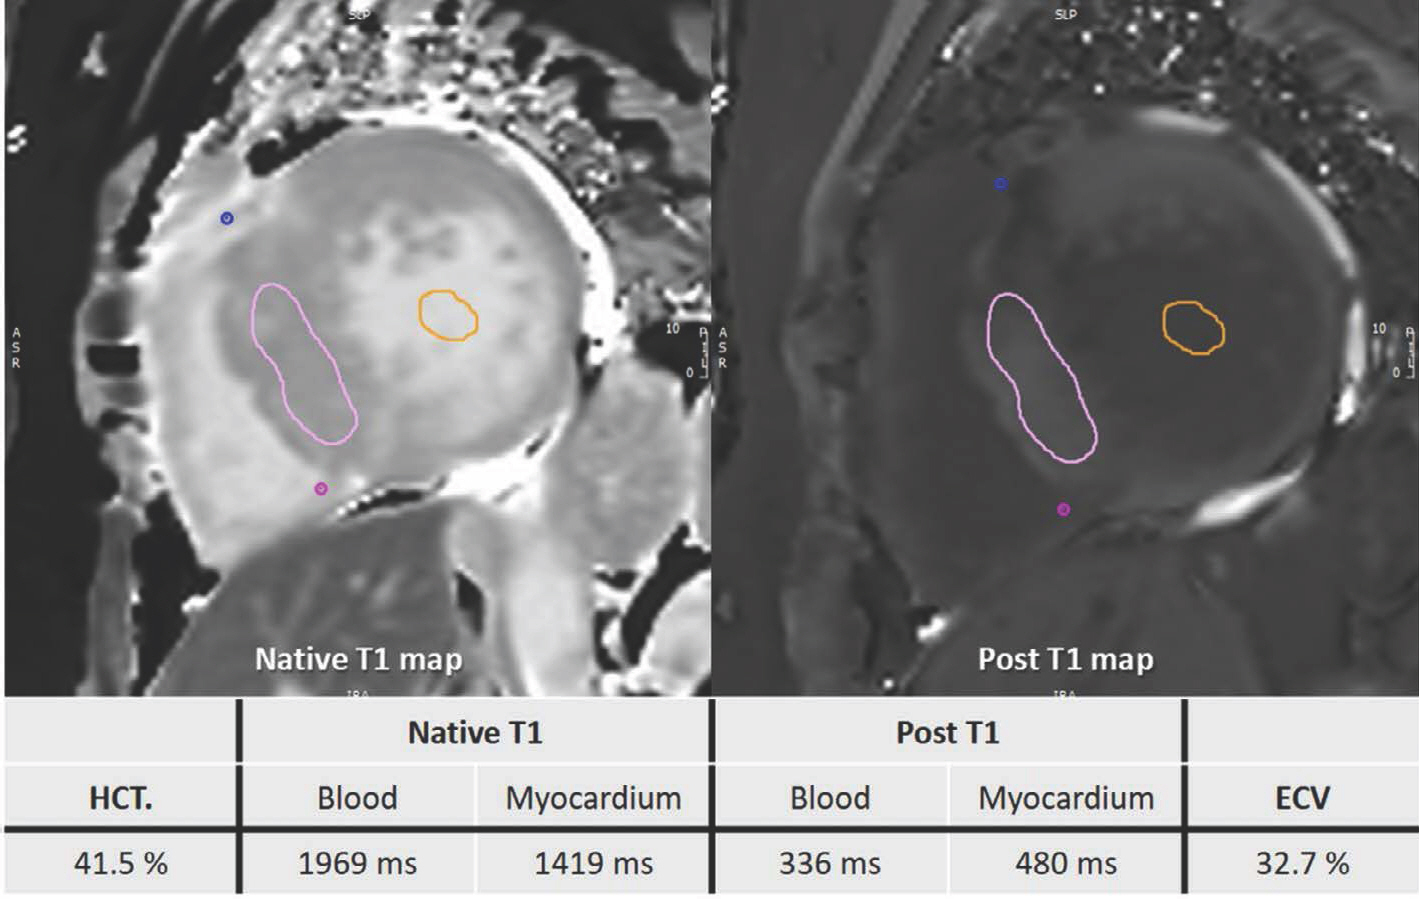
Fig. 13. T1 mapping images of 60-year-old woman with HCM. After obtaining native T1 and post-contrast T1 values in myocardium and blood, values and HCT are inserted into ECV formula. HCM is usually characterized by high T1 value and high ECV. This patient also had high T1 value of 1419 ms and high ECV value of 32.7%. ECV = extracellular volume; HCT = hematocrit
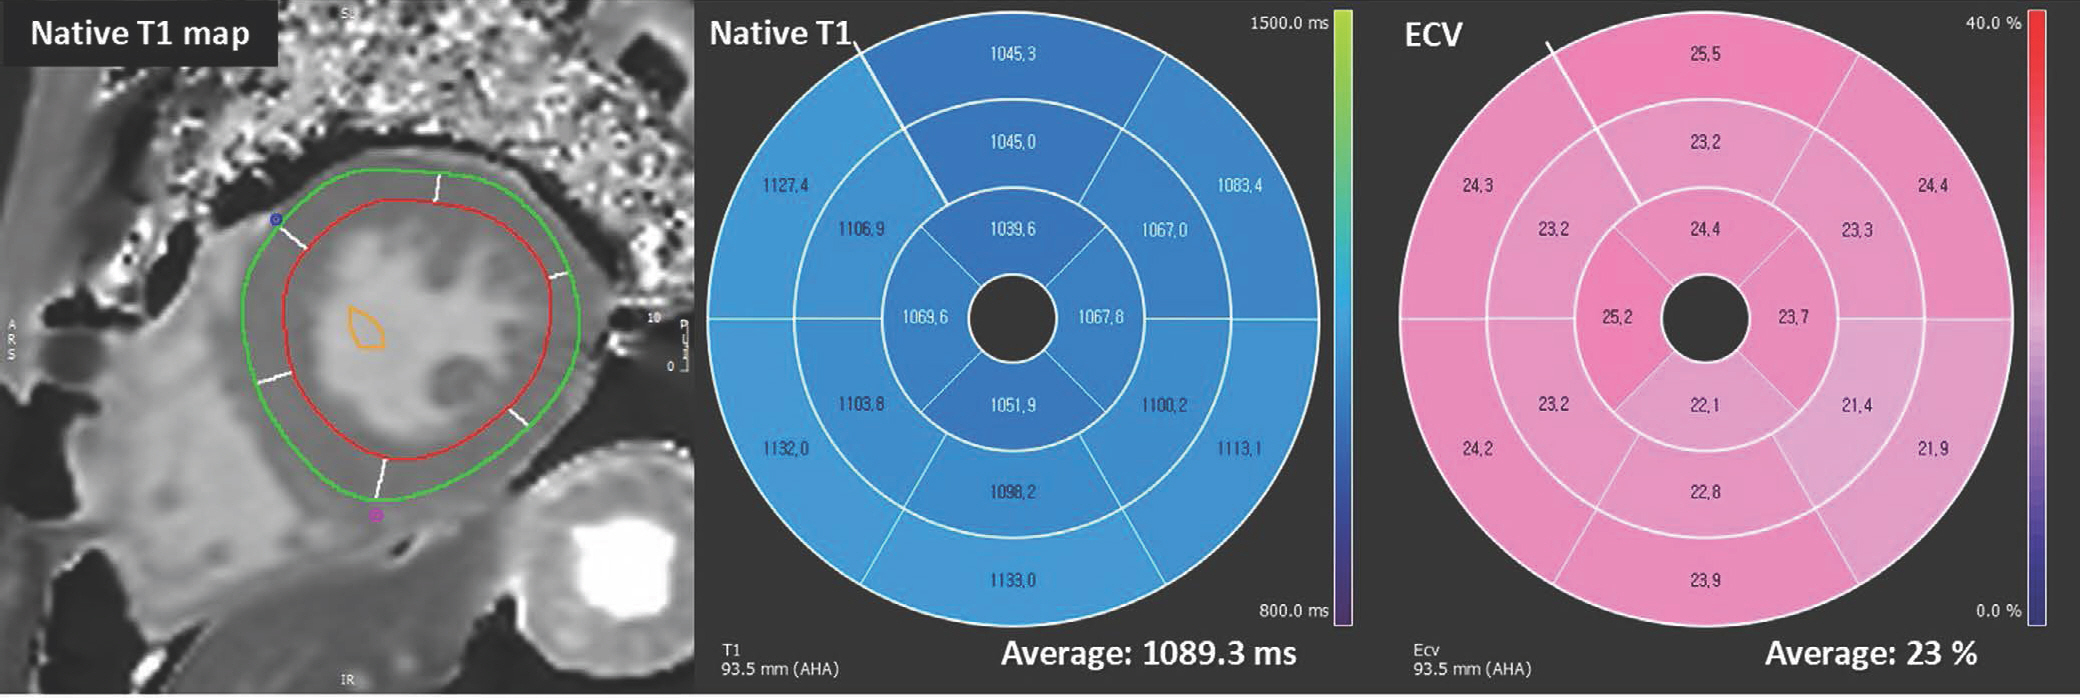
Fig. 14. T1 mapping images of 43-year-old male with Fabry disease. After drawing endocardial contour and epicardial contour in native T1- and post T1 mapping images, T1 value and ECV are calculated. Fabry disease has special characteristics of low T1 value and normal ECV. This patient also had low T1 value of 1089.3 ms and normal ECV value of 23%.
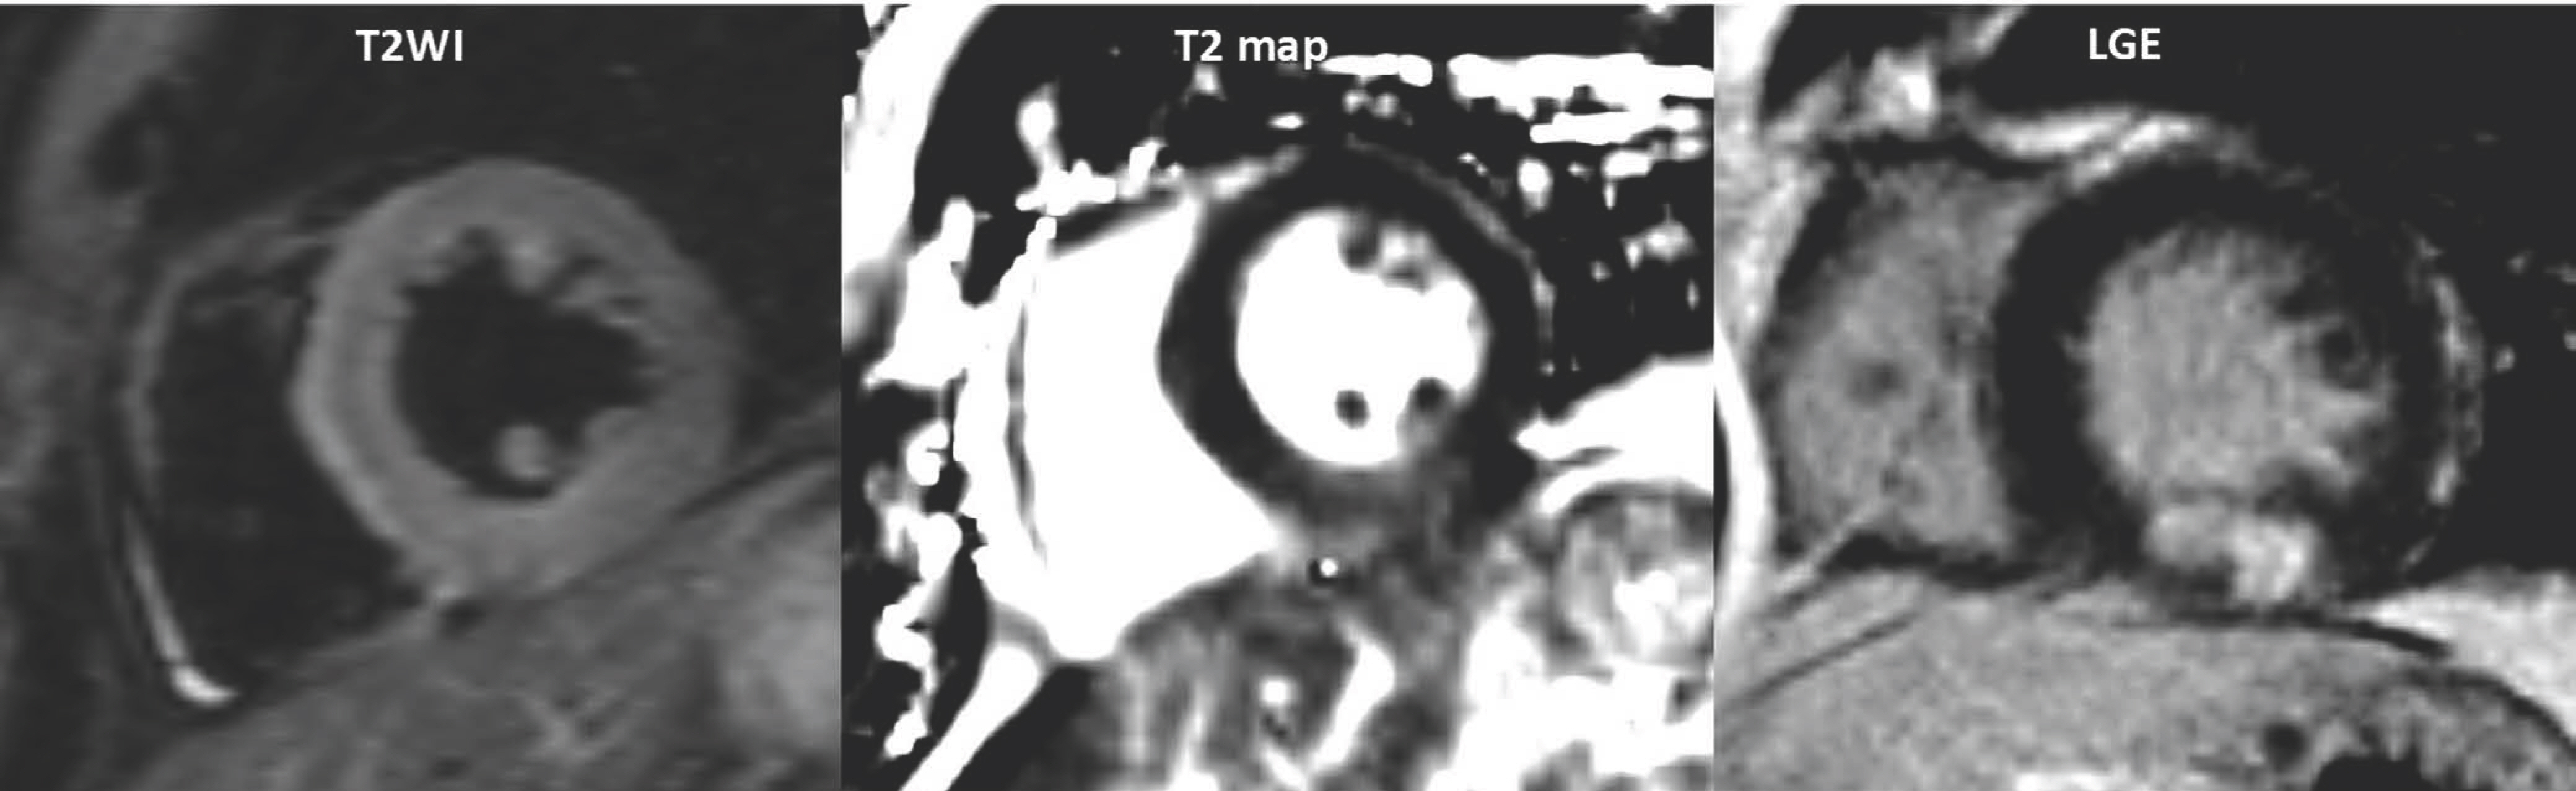
Fig. 15. Acute myocardial infarction in 51-year-old man with chest pain. Area of increased SI on T2WI was correlated with area of delayed enhancement on LGE image. T2WI = T2-weighted image
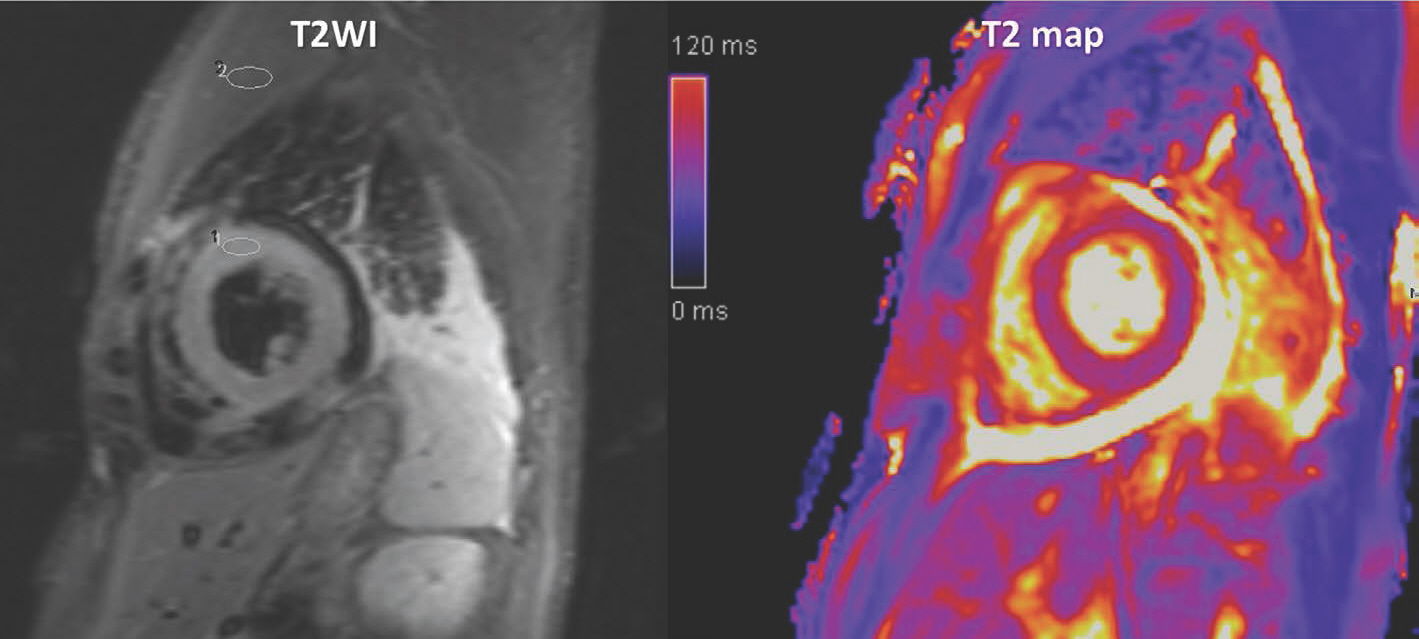
Fig. 16. Acute myocarditis in 40-year-old man with fever. Increased SI observed in global myocardium on T2WI, and SI ratio of myocardium to serratus anterior muscle was increased to 2.0.
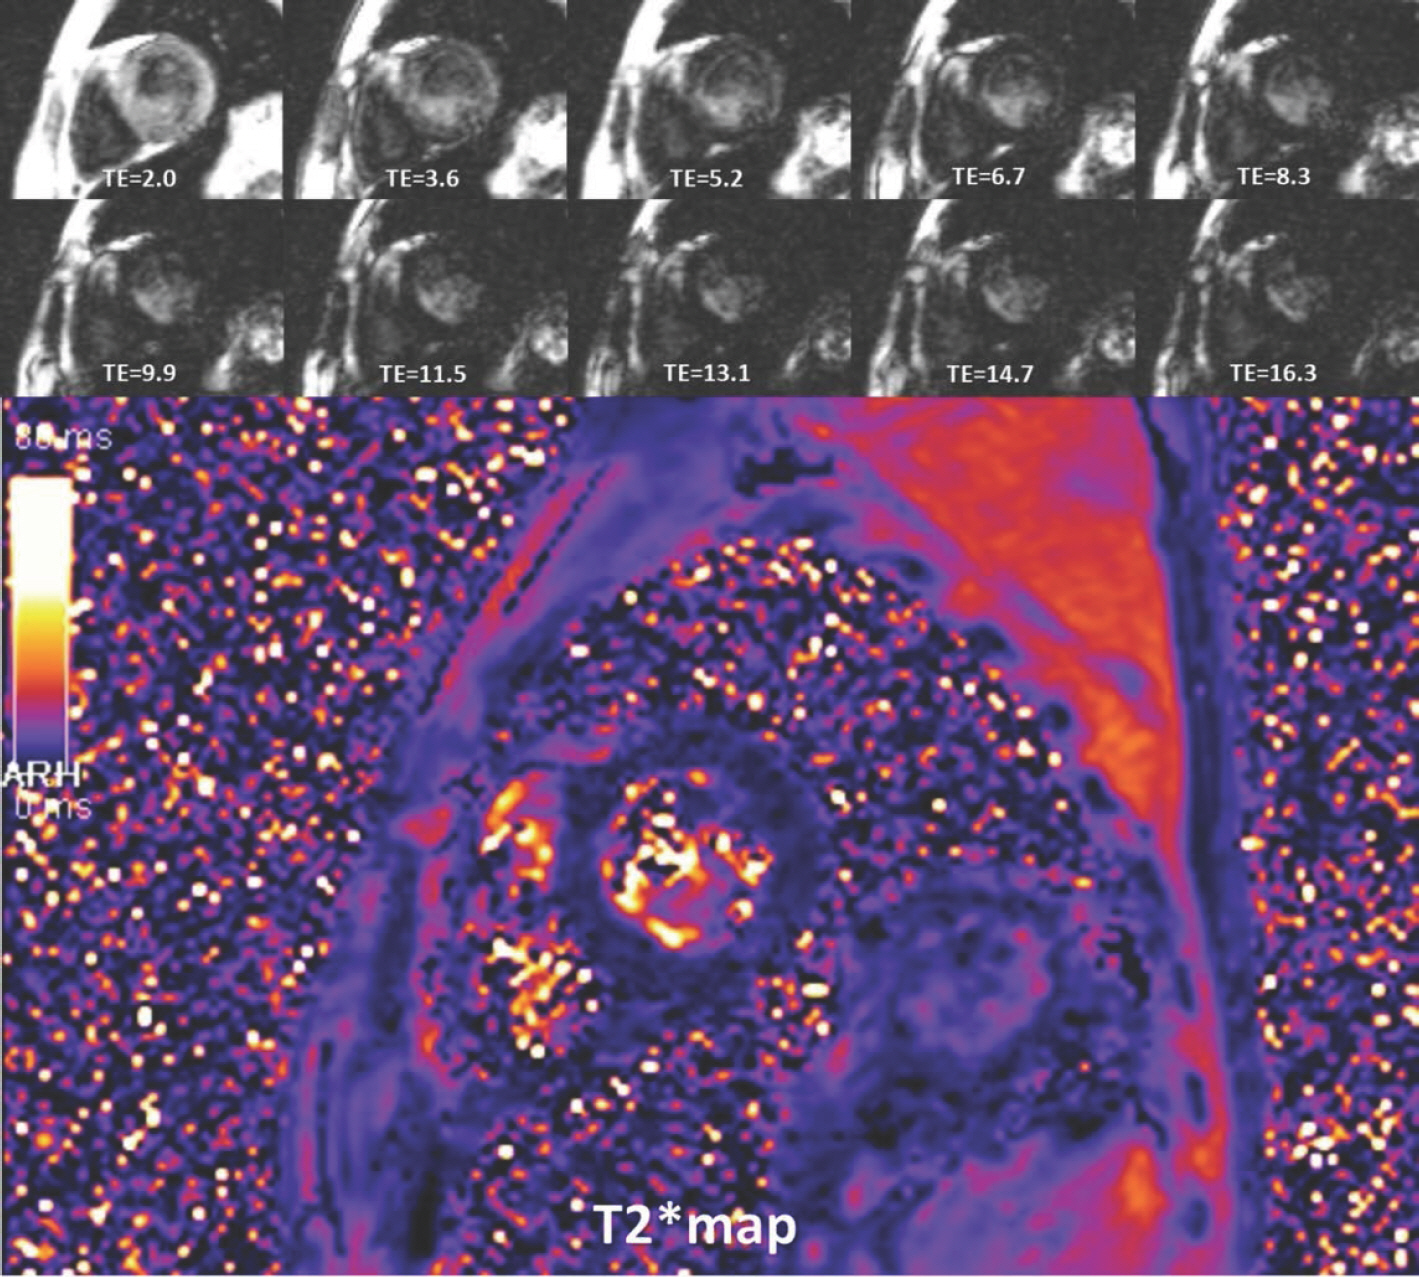
Fig. 17. Beta-thalassemia in 35-year-old man. Substantial signal loss occurred at TE of 8.3 ms, and measured T2∗ value was 3.8 ms. TE = echo time
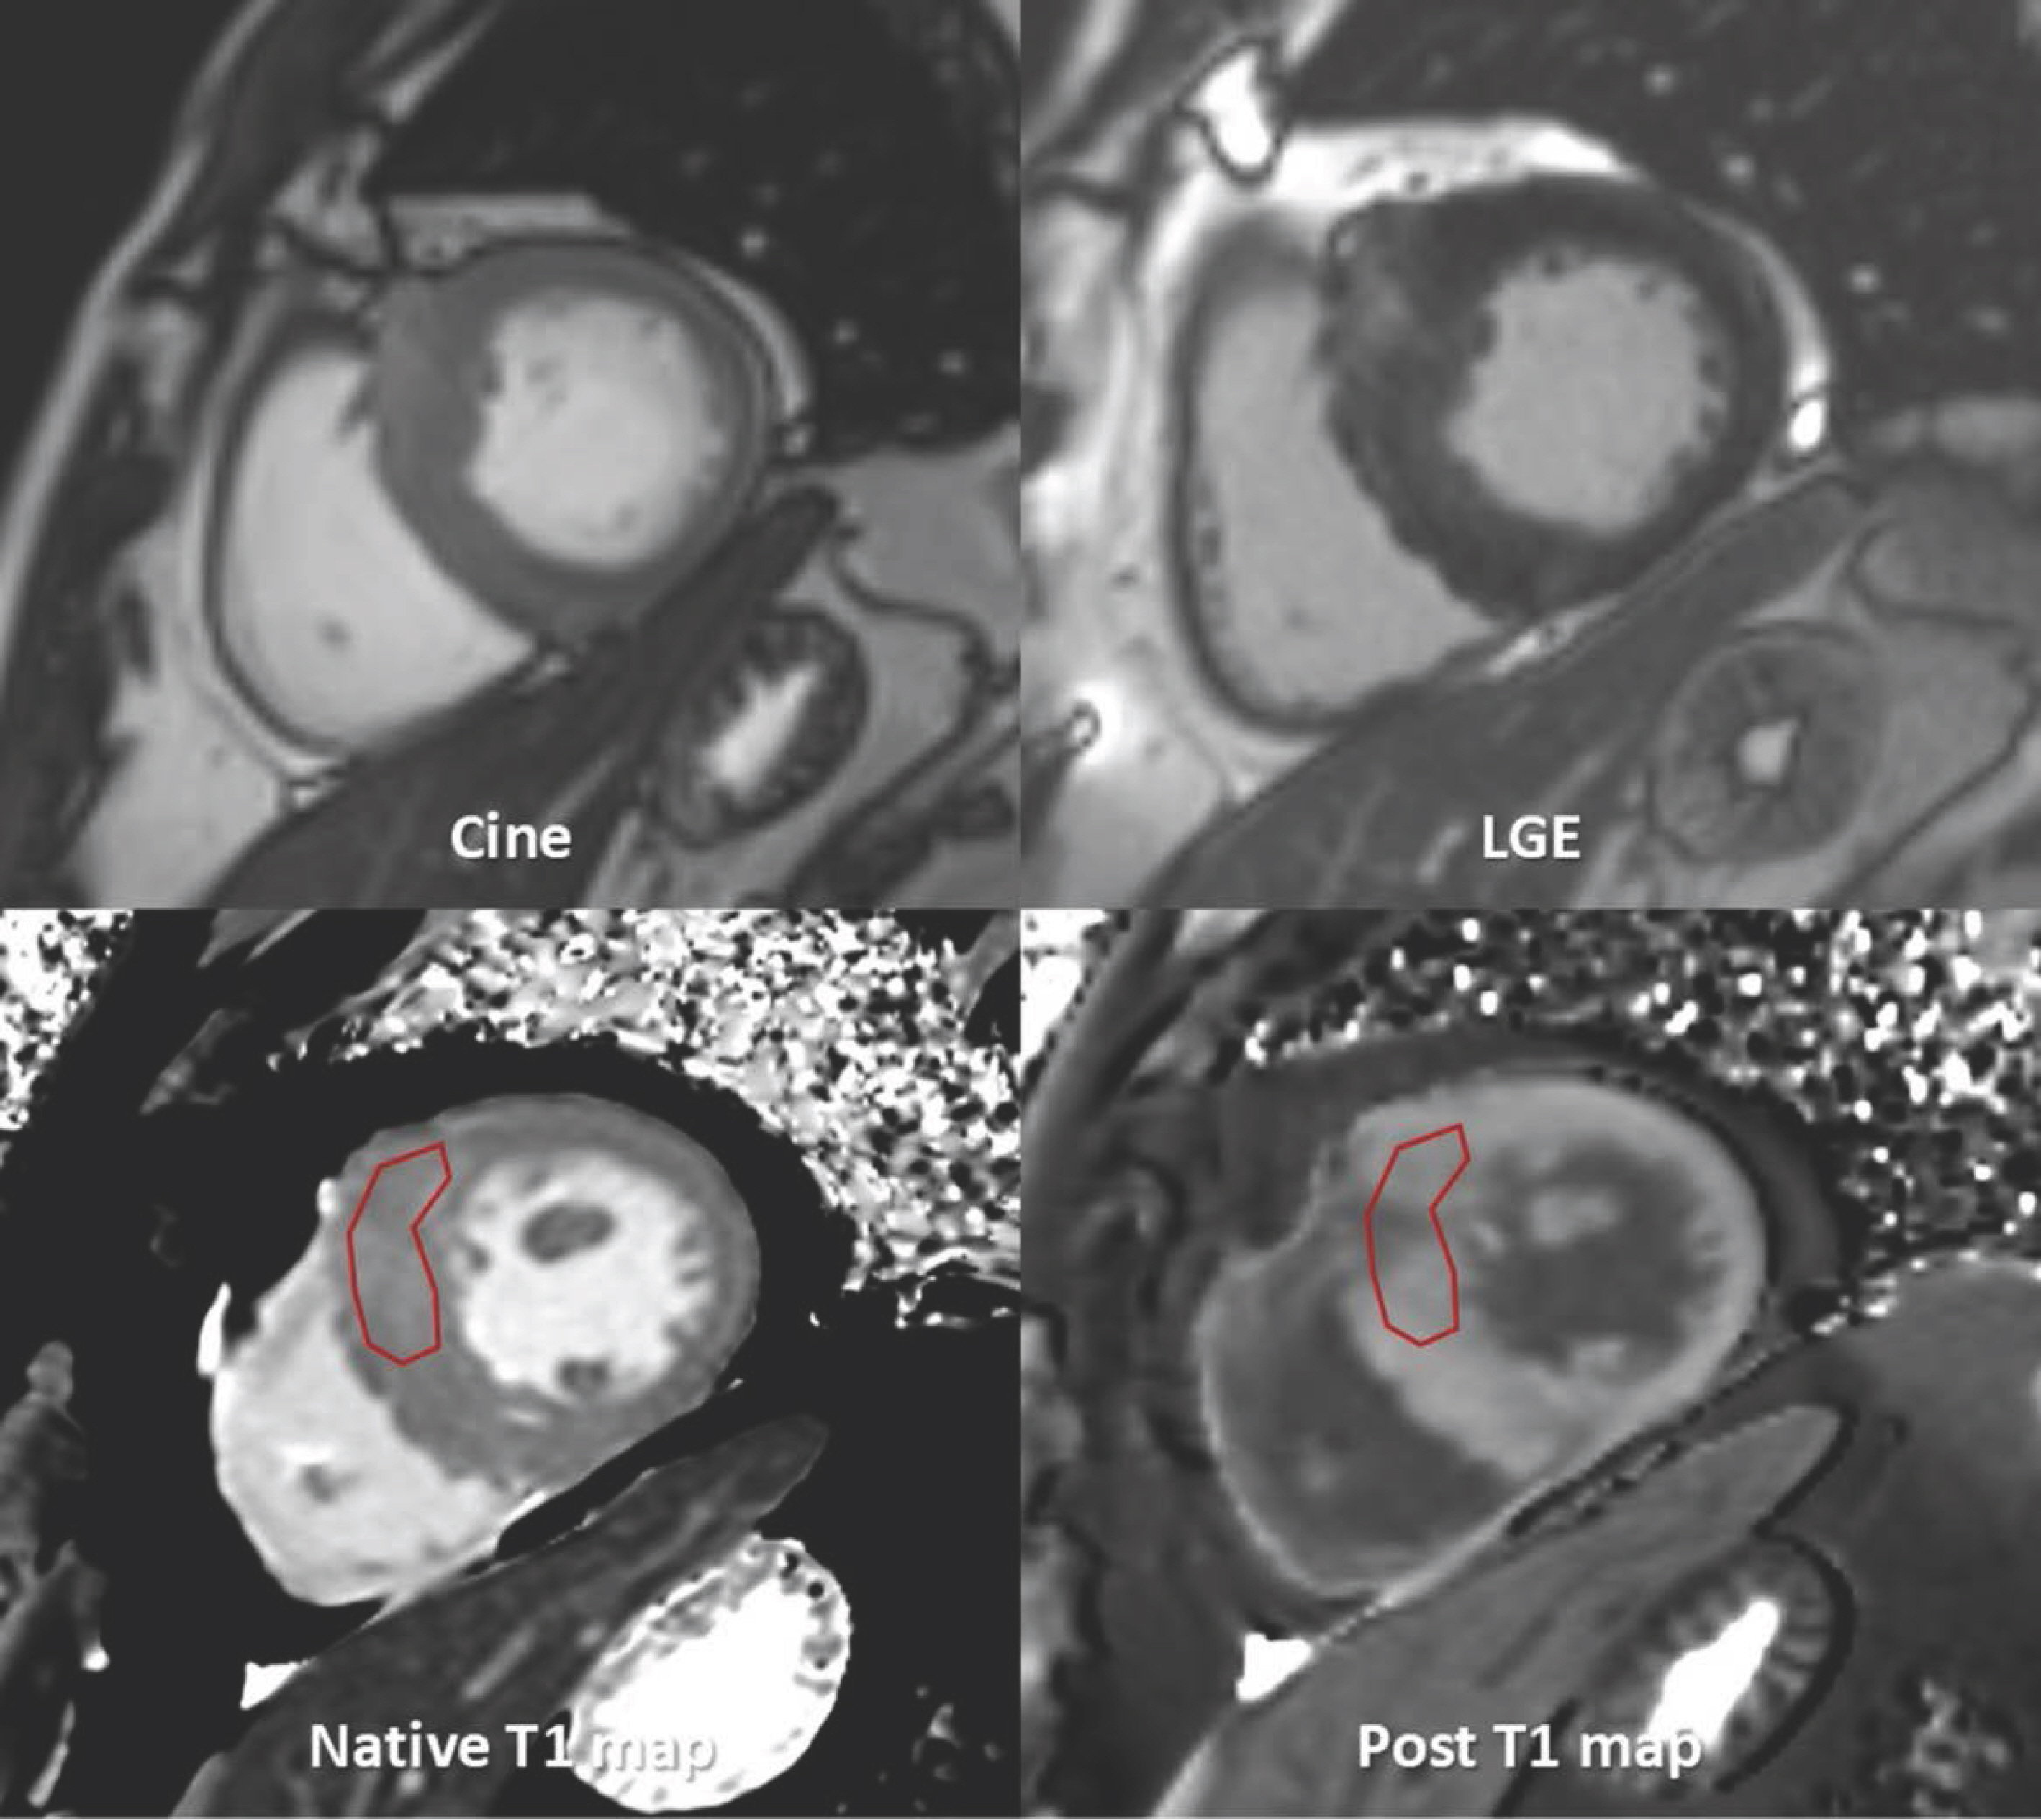
Fig. 18. Images for HCM sample report.
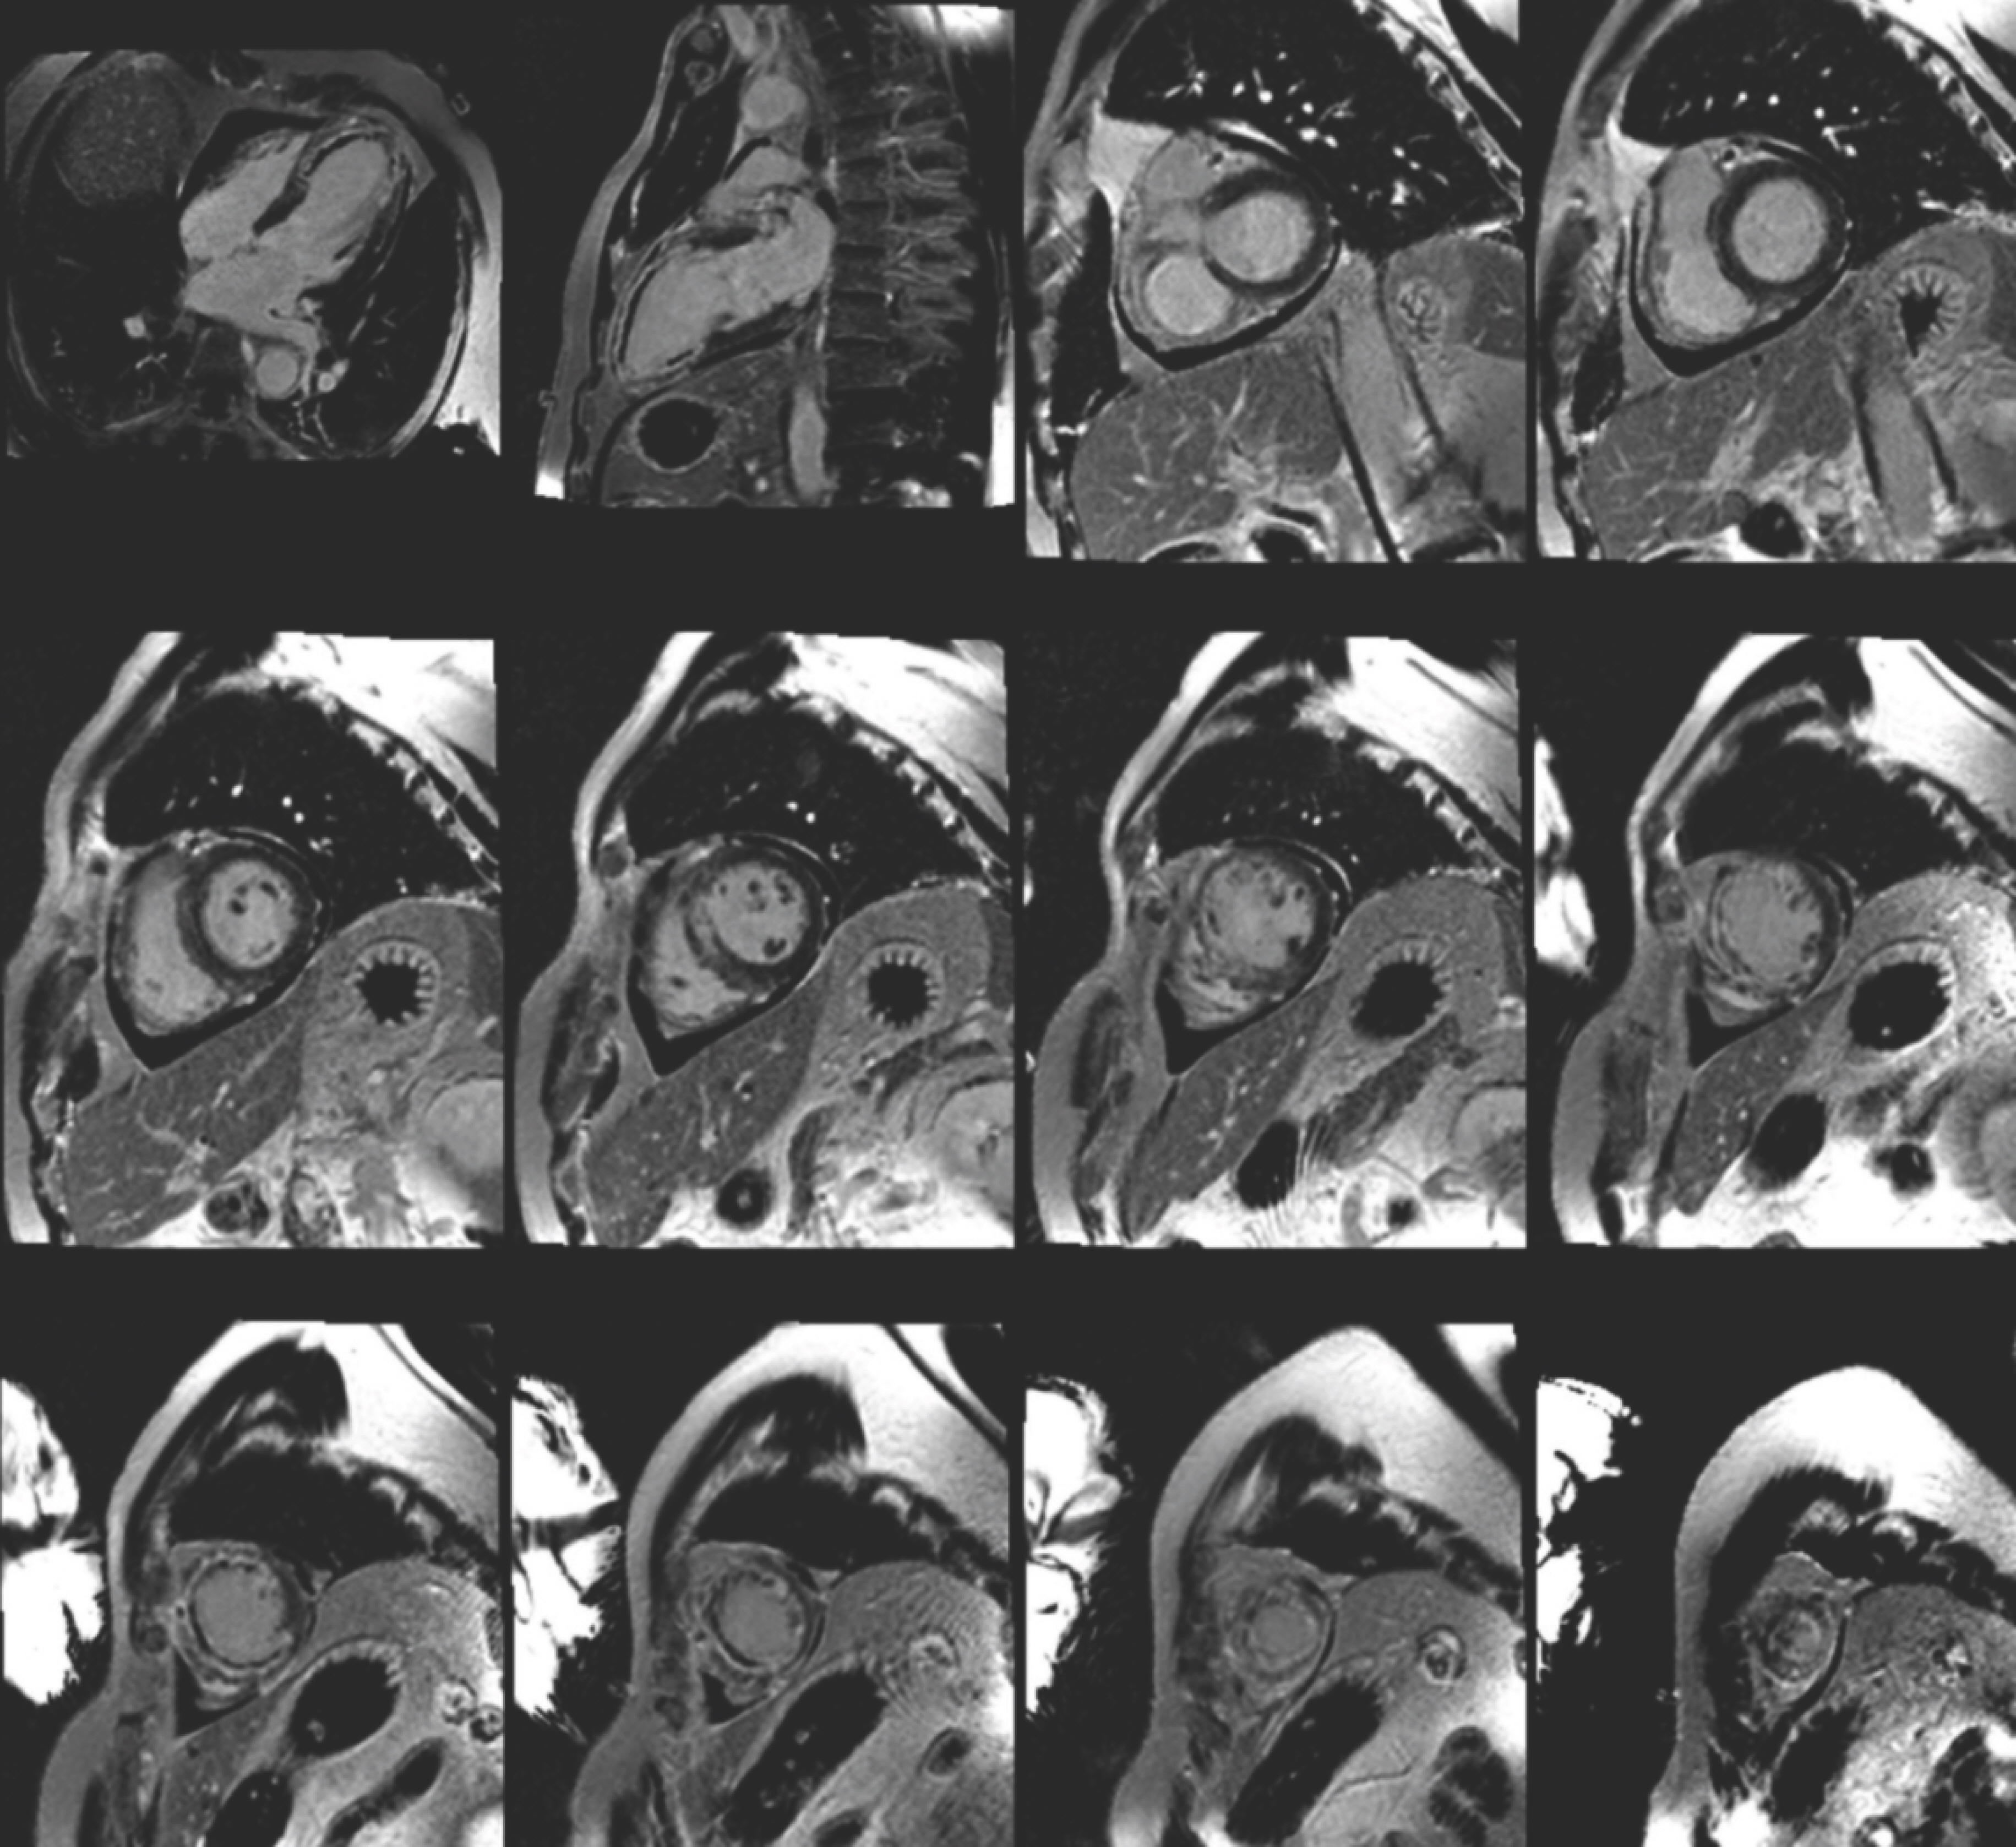
Fig. 19. Images for ischemic cardiomyopathy sample report.
Reference
-
1.Coelho-Filho OR., Rickers C., Kwong RY., Jerosch-Herold M. MR myocardial perfusion imaging. Radiology. 2013. 266:701–715.
Article2.Schulz-Menger J., Bluemke DA., Bremerich J, et al. Standardized image interpretation and post processing in cardiovascular magnetic resonance: Society for Cardiovascular Magnetic Resonance (SCMR) board of trustees task force on standardized post processing. J Cardiovasc Magn Reson. 2013. 15:35.
Article3.Min JY., Ko SM., Song IY., Yi JG., Hwang HK., Shin JK. Comparison of the diagnostic accuracies of 1.5T and 3T stress myocardial perfusion cardiovascular magnetic resonance for detecting significant coronary artery disease. Korean J Radiol. 2018. 19:1007–1020.
Article4.Chung SY., Lee KY., Chun EJ, et al. Comparison of stress perfusion MRI and SPECT for detection of myocardial ischemia in patients with angiographically proven three-vessel coronary artery disease. AJR Am J Roentgenol. 2010. 195:356–362.
Article5.Panting JR., Gatehouse PD., Yang GZ, et al. Abnormal subendocardial perfusion in cardiac syndrome X detected by cardiovascular magnetic resonance imaging. N Engl J Med. 2002. 346:1948–1953.
Article6.Maron BJ., Wolfson JK., Epstein SE., Roberts WC. Intramural (“small vessel”) coronary artery disease in hypertrophic cardiomyopathy. J Am Coll Cardiol. 1986. 8:545–557.
Article7.Maron MS., Olivotto I., Maron BJ, et al. The case for myocardial ischemia in hypertrophic cardiomyopathy. J Am Coll Cardiol. 2009. 54:866–875.
Article8.Kim YK., Park EA., Park SJ, et al. Non-ischemic perfusion defects due to delayed arrival of contrast material on stress perfusion cardiac magnetic resonance imaging after coronary artery bypass graft surgery. Korean J Radiol. 2014. 15:188–194.
Article9.Tejani FH., Thompson RC., Kristy R., Bukofzer S. Effect of caffeine on SPECT myocardial perfusion imaging during regadenoson pharmacologic stress: a prospective, randomized, multicenter study. Int J Cardiovasc Imaging. 2014. 30:979–989.
Article10.Kovacs D., Pivonka R., Khosla PG., Khosla S. Effect of caffeine on myocardial perfusion imaging using single photon emission computed tomography during adenosine pharmacologic stress. Am J Ther. 2008. 15:431–434.
Article11.Jerosch-Herold M. Quantification of myocardial perfusion by cardiovascular magnetic resonance. J Cardiovasc Magn Reson. 2010. 12:57.
Article12.Schwitter J., DeMarco T., Kneifel S, et al. Magnetic resonance-based assessment of global coronary flow and flow reserve and its relation to left ventricular functional parameters: a comparison with positron emission tomography. Circulation. 2000. 101:2696–2702.13.Kelle S., Graf K., Dreysse S., Schnackenburg B., Fleck E., Klein C. Evaluation of contrast wash-in and peak enhancement in adenosine first pass perfusion CMR in patients post bypass surgery. J Cardiovasc Magn Reson. 2010. 12:28.
Article14.Keelan PC., Bielak LF., Ashai K, et al. Long-term prognostic value of coronary calcification detected by electron-beam computed tomography in patients undergoing coronary angiography. Circulation. 2001. 104:412–417.
Article15.Rieber J., Huber A., Erhard I, et al. Cardiac magnetic resonance perfusion imaging for the functional assessment of coronary artery disease: a comparison with coronary angiography and fractional flow reserve. Eur Heart J. 2006. 27:1465–1471.
Article16.Kroll K., Wilke N., Jerosch-Herold M, et al. Modeling regional myocardial flows from residue functions of an intravascular indicator. Am J Physiol. 1996. 271:H1643–1655.
Article17.Jerosch-Herold M., Swingen C., Seethamraju RT. Myocardial blood flow quantification with MRI by model-independent deconvolution. Med Phys. 2002. 29:886–897.
Article18.Ishida M., Schuster A., Morton G, et al. Development of a universal dual-bolus injection scheme for the quantitative assessment of myocardial perfusion cardiovascular magnetic resonance. J Cardiovasc Magn Reson. 2011. 13:28.
Article19.Christian TF., Aletras AH., Arai AE. Estimation of absolute myocardial blood flow during first-pass MR perfusion imaging using a dual-bolus injection technique: comparison to single-bolus injection method. J Magn Reson Imaging. 2008. 27:1271–1277.
Article20.Gatehouse PD., Elkington AG., Ablitt NA., Yang GZ., Pennell DJ., Firmin DN. Accurate assessment of the arterial input function during high-dose myocardial perfusion cardiovascular magnetic resonance. J Magn Reson Imaging. 2004. 20:39–45.
Article21.Jerosch-Herold M., Wilke N., Wang Y, et al. Direct comparison of an intravascular and an extracellular contrast agent for quantification of myocardial perfusion. Cardiac MRI Group. Int J Card Imaging. 1999. 15:453–464.22.Kim RJ., Shah DJ., Judd RM. How we perform delayed enhancement imaging. J Cardiovasc Magn Reson. 2003. 5:505–514.
Article23.Mahrholdt H., Wagner A., Judd RM., Sechtem U., Kim RJ. Delayed enhancement cardiovascular magnetic resonance assessment of non-ischaemic cardiomyopathies. Eur Heart J. 2005. 26:1461–1474.
Article24.Lee JW., Jeong YJ., Lee G, et al. Predictive value of cardiac magnetic resonance imaging-derived myocardial strain for poor outcomes in patients with acute myocarditis. Korean J Radiol. 2017. 18:643–654.
Article25.Kim RJ., Wu E., Rafael A, et al. The use of contrast-enhanced magnetic resonance imaging to identify reversible myocardial dysfunction. N Engl J Med. 2000. 343:1445–1453.
Article26.Klem I., Heitner JF., Shah DJ, et al. Improved detection of coronary artery disease by stress perfusion cardiovascular magnetic resonance with the use of delayed enhancement infarction imaging. J Am Coll Cardiol. 2006. 47:1630–1638.
Article27.Abbas A., Matthews GH., Brown IW., Shambrook JS., Peebles CR., Harden SP. Cardiac MR assessment of microvascular obstruction. Br J Radiol. 2015. 88:20140470.
Article28.Rajiah P., Desai MY., Kwon D., Flamm SD. MR imaging of myocardial infarction. Radiographics. 2013. 33:1383–1412.
Article29.Saremi F., Grizzard JD., Kim RJ. Optimizing cardiac MR imaging: practical remedies for artifacts. Radiographics. 2008. 28:1161–1187.
Article30.Kellman P., Arai AE., McVeigh ER., Aletras AH. Phase-sensitive inversion recovery for detecting myocardial infarction using gadolinium-delayed hyperenhancement. Magn Reson Med. 2002. 47:372–383.
Article31.Kellman P., Arai AE. Cardiac imaging techniques for physicians: late enhancement. J Magn Reson Imaging. 2012. 36:529–542.
Article32.Farrelly C., Rehwald W., Salerno M, et al. Improved detection of subendocardial hyperenhancement in myocardial infarction using dark blood-pool delayed enhancement MRI. AJR Am J Roentgenol. 2011. 196:339–348.
Article33.Bondarenko O., Beek AM., Hofman MB, et al. Standardizing the definition of hyperenhancement in the quantitative assessment of infarct size and myocardial viability using delayed contrast-enhanced CMR. J Cardiovasc Magn Reson. 2005. 7:481–485.
Article34.Lim J., Park EA., Song YS., Lee W. Single-dose gadoterate meglumine for 3T late gadolinium enhancement mri for the assessment of chronic myocardial infarction: intraindividual comparison with conventional double-dose 1.5T MRI. Korean J Radiol. 2018. 19:372–380.
Article35.Amado LC., Gerber BL., Gupta SN, et al. Accurate and objective infarct sizing by contrast-enhanced magnetic resonance imaging in a canine myocardial infarction model. J Am Coll Cardiol. 2004. 44:2383–2389.
Article36.Flett AS., Hasleton J., Cook C, et al. Evaluation of techniques for the quantification of myocardial scar of differing etiology using cardiac magnetic resonance. JACC Cardiovasc Imaging. 2011. 4:150–156.
Article37.Aljaroudi WA., Flamm SD., Saliba W., Wilkoff BL., Kwon D. Role of CMR imaging in risk stratification for sudden cardiac death. JACC Cardiovasc Imaging. 2013. 6:392–406.
Article38.Moon JC., Messroghli DR., Kellman P, et al. Myocardial T1 mapping and extracellular volume quantification: a Society for Cardiovascular Magnetic Resonance (SCMR) and CMR Working Group of the European Society of Cardiology consensus statement. J Cardiovasc Magn Reson. 2013. 15:92.
Article39.Ugander M., Bagi PS., Oki AJ, et al. Myocardial edema as detected by pre-contrast T1 and T2 CMR delineates area at risk associated with acute myocardial infarction. JACC Cardiovasc Imaging. 2012. 5:596–603.
Article40.Karamitsos TD., Piechnik SK., Banypersad SM, et al. Noncontrast T1 mapping for the diagnosis of cardiac amyloidosis. JACC Cardiovasc Imaging. 2013. 6:488–497.
Article41.Sado DM., White SK., Piechnik SK, et al. Identification and assessment of Anderson-Fabry disease by cardiovascular magnetic resonance noncontrast myocardial T1 mapping. Circ Cardiovasc Imaging. 2013. 6:392–398.
Article42.Pedersen SF., Thrysøe SA., Robich MP, et al. Assessment of intramyocardial hemorrhage by T1-weighted cardiovascular magnetic resonance in reperfused acute myocardial infarction. J Cardiovasc Magn Reson. 2012. 14:59.
Article43.Messroghli DR., Radjenovic A., Kozerke S., Higgins DM., Sivananthan MU., Ridgway JP. Modified Look-Locker inversion recovery (MOLLI) for high-resolution T1 mapping of the heart. Magn Reson Med. 2004. 52:141–146.44.Arheden H., Saeed M., Higgins CB, et al. Measurement of the distribution volume of gadopentetate dimeglumine at echo-planar MR imaging to quantify myocardial infarction: comparison with 99mTc-DTPA autoradiography in rats. Radiology. 1999. 211:698–708.45.Taylor AJ., Salerno M., Dharmakumar R., Jerosch-Herold M. T1 mapping: basic techniques and clinical applications. JACC Cardiovasc Imaging. 2016. 9:67–81.46.Kellman P., Wilson JR., Xue H., Ugander M., Arai AE. Extracellular volume fraction mapping in the myocardium, part 1: evaluation of an automated method. J Cardiovasc Magn Reson. 2012. 14:63.
Article47.Miller CA., Naish JH., Bishop P, et al. Comprehensive validation of cardiovascular magnetic resonance techniques for the assessment of myocardial extracellular volume. Circ Cardiovasc Imaging. 2013. 6:373–383.
Article48.Chen Y., Zheng X., Jin H, et al. Role of myocardial extracellular volume fraction measured with magnetic resonance imaging in the prediction of left ventricular functional outcome after revascularization of chronic total occlusion of coronary arteries. Korean J Radiol. 2019. 20:83–93.
Article49.Lee HG., Shim J., Choi JI., Kim YH., Oh YW., Hwang SH. Use of cardiac computed tomography and magnetic resonance imaging in case management of atrial fibrillation with catheter ablation. Korean J Radiol. 2019. 20:695–708.
Article50.Treibel TA., Fontana M., Maestrini V, et al. Automatic measurement of the myocardial interstitium: synthetic extracellular volume quantification without hematocrit sampling. JACC Cardiovasc Imaging. 2016. 9:54–63.51.Shang Y., Zhang X., Zhou X., Wang J. Extracellular volume fraction measurements derived from the longitudinal relaxation of blood-based synthetic hematocrit may lead to clinical errors in 3 T cardiovascular magnetic resonance. J Cardiovasc Magn Reson. 2018. 20:56.
Article52.Kammerlander AA., Duca F., Binder C, et al. Extracellular volume quantification by cardiac magnetic resonance imaging without hematocrit sampling: ready for prime time? Wien Klin Wochenschr. 2018. 130:190–196.53.Robson MD., Piechnik SK., Tunnicliffe EM., Neubauer S. T1 measurements in the human myocardium: the effects of magnetization transfer on the SASHA and MOLLI sequences. Magn Reson Med. 2013. 70:664–670.54.Friedrich MG., Sechtem U., Schulz-Menger J, et al. Cardiovascular magnetic resonance in myocarditis: a JACC white paper. J Am Coll Cardiol. 2009. 53:1475–1487.
Article55.He T., Gatehouse PD., Smith GC., Mohiaddin RH., Pennell DJ., Firmin DN. Myocardial T2∗ measurements in iron-overloaded thalassemia: an in vivo study to investigate optimal methods of quantification. Magn Reson Med. 2008. 60:1082–1089.56.Anderson LJ., Holden S., Davis B, et al. Cardiovascular T2-star (T2∗) magnetic resonance for the early diagnosis of myocardial iron overload. Eur Heart J. 2001. 22:2171–2179.
Article57.Carpenter JP., He T., Kirk P, et al. On T2∗ magnetic resonance and cardiac iron. Circulation. 2011. 123:1519–1528.
Article58.Kirk P., Roughton M., Porter JB, et al. Cardiac T2∗ magnetic resonance for prediction of cardiac complications in thalassemia major. Circulation. 2009. 120:1961–1968.
Article
- Full Text Links
-
- Actions
-
Cited
- CITED
-
- Close
- Share
-
- Similar articles
-
- CMR Parametric Mapping as a Tool for Myocardial Tissue Characterization
- Guidelines for Cardiovascular Magnetic Resonance Imaging from the Korean Society of Cardiovascular Imaging—Part 3: Perfusion, Delayed Enhancement, and T1- and T2 Mapping
- Clinical Application of T1 and T2 Mapping in Cardiac Magnetic Resonance Imaging for Nonischemic Cardiomyopathy: A Case-Based Review
- Guidelines for Cardiovascular Magnetic Resonance Imaging from the Korean Society of Cardiovascular Imaging—Part 3: Perfusion, Delayed Enhancement, and T1- and T2 Mapping
- Treatment Response Evaluation of Cardiac Amyloidosis Using Serial T1- and T2-Mapping Cardiovascular Magnetic Resonance Imaging
