Korean J Transplant.
2020 Sep;34(3):167-177. 10.4285/kjt.2020.34.3.167.
Mathematical model for early functional recovery pattern of kidney transplant recipients using serum creatinine
- Affiliations
-
- 1Department of Surgery, Ajou University School of Medicine, Suwon, Korea
- KMID: 2507161
- DOI: http://doi.org/10.4285/kjt.2020.34.3.167
Abstract
- Background
Commonly used equations for calculating estimated glomerular filtration rate (eGFR) are not applicable when serum creatinine (Scr) is rapidly changing like the post-transplant period. A new mathematical model applicable to the post-transplant period is required.
Methods
All 623 patients who underwent kidney transplantation from January 2008 to June 2018 at a single institute were included to validate the Scr mathematical equations, and 14,360 Scr laboratory results from the time of re-perfusion to 30 days post-transplantation were analyzed.
Results
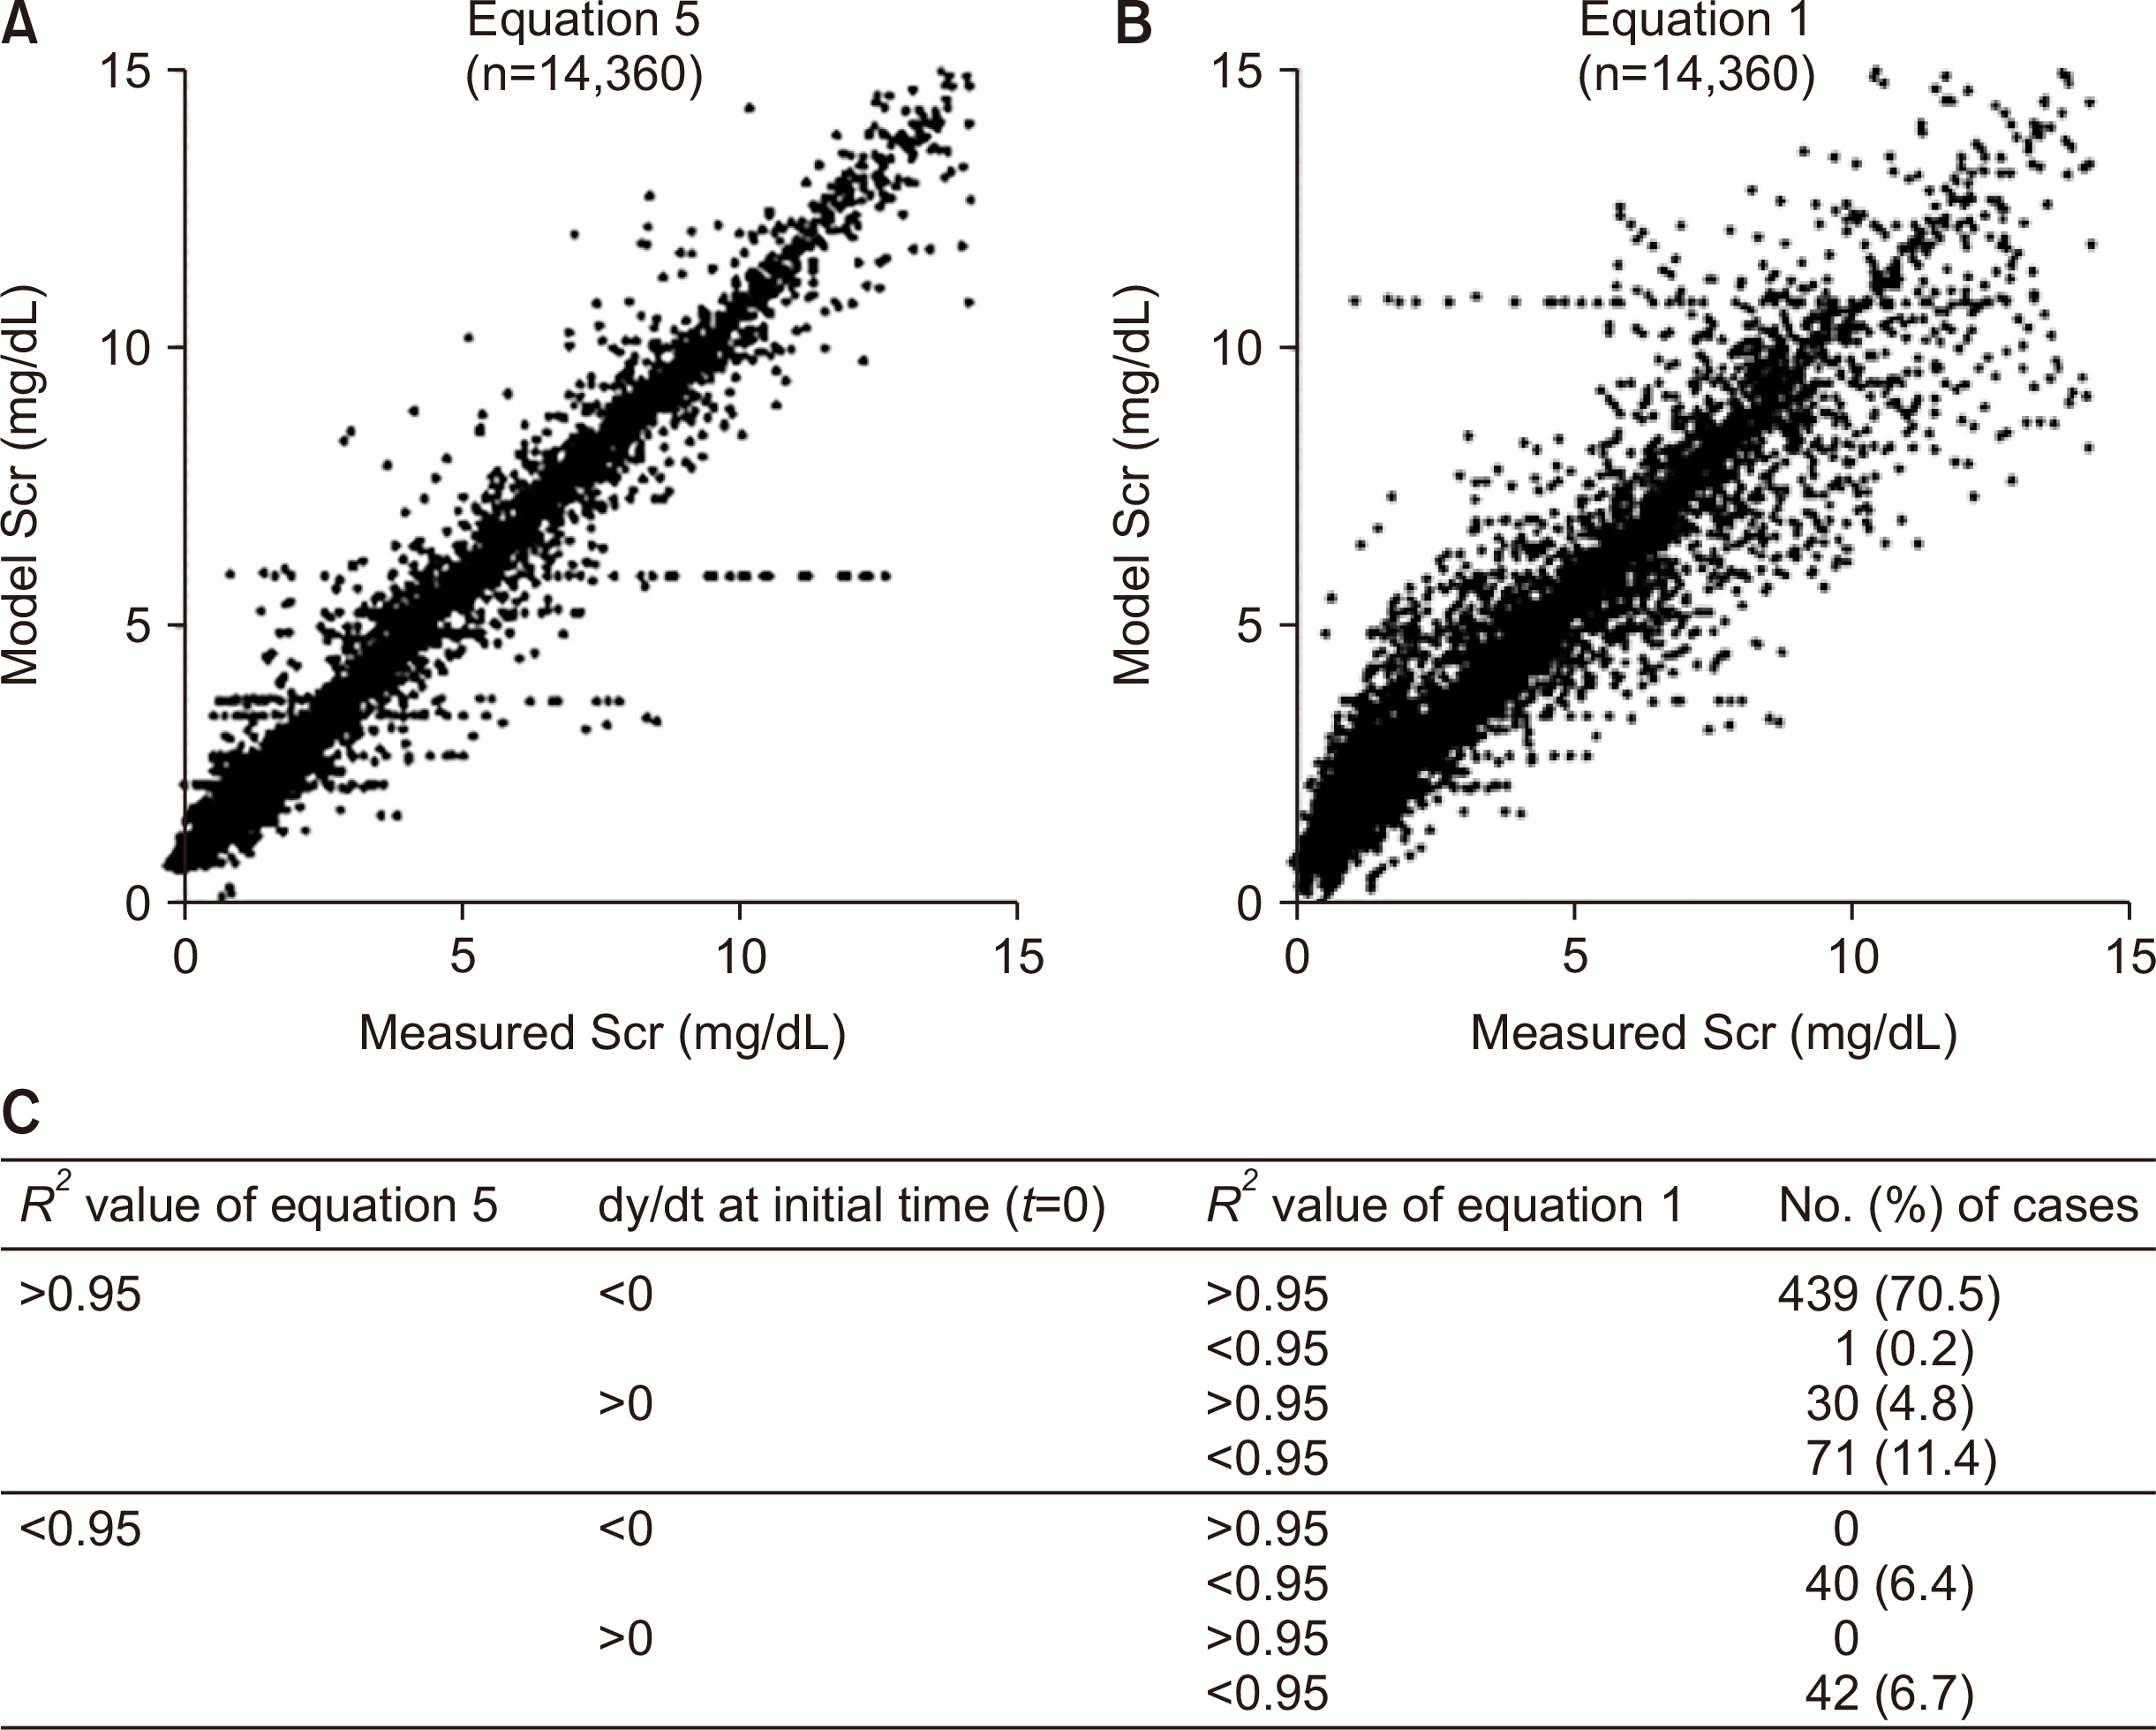
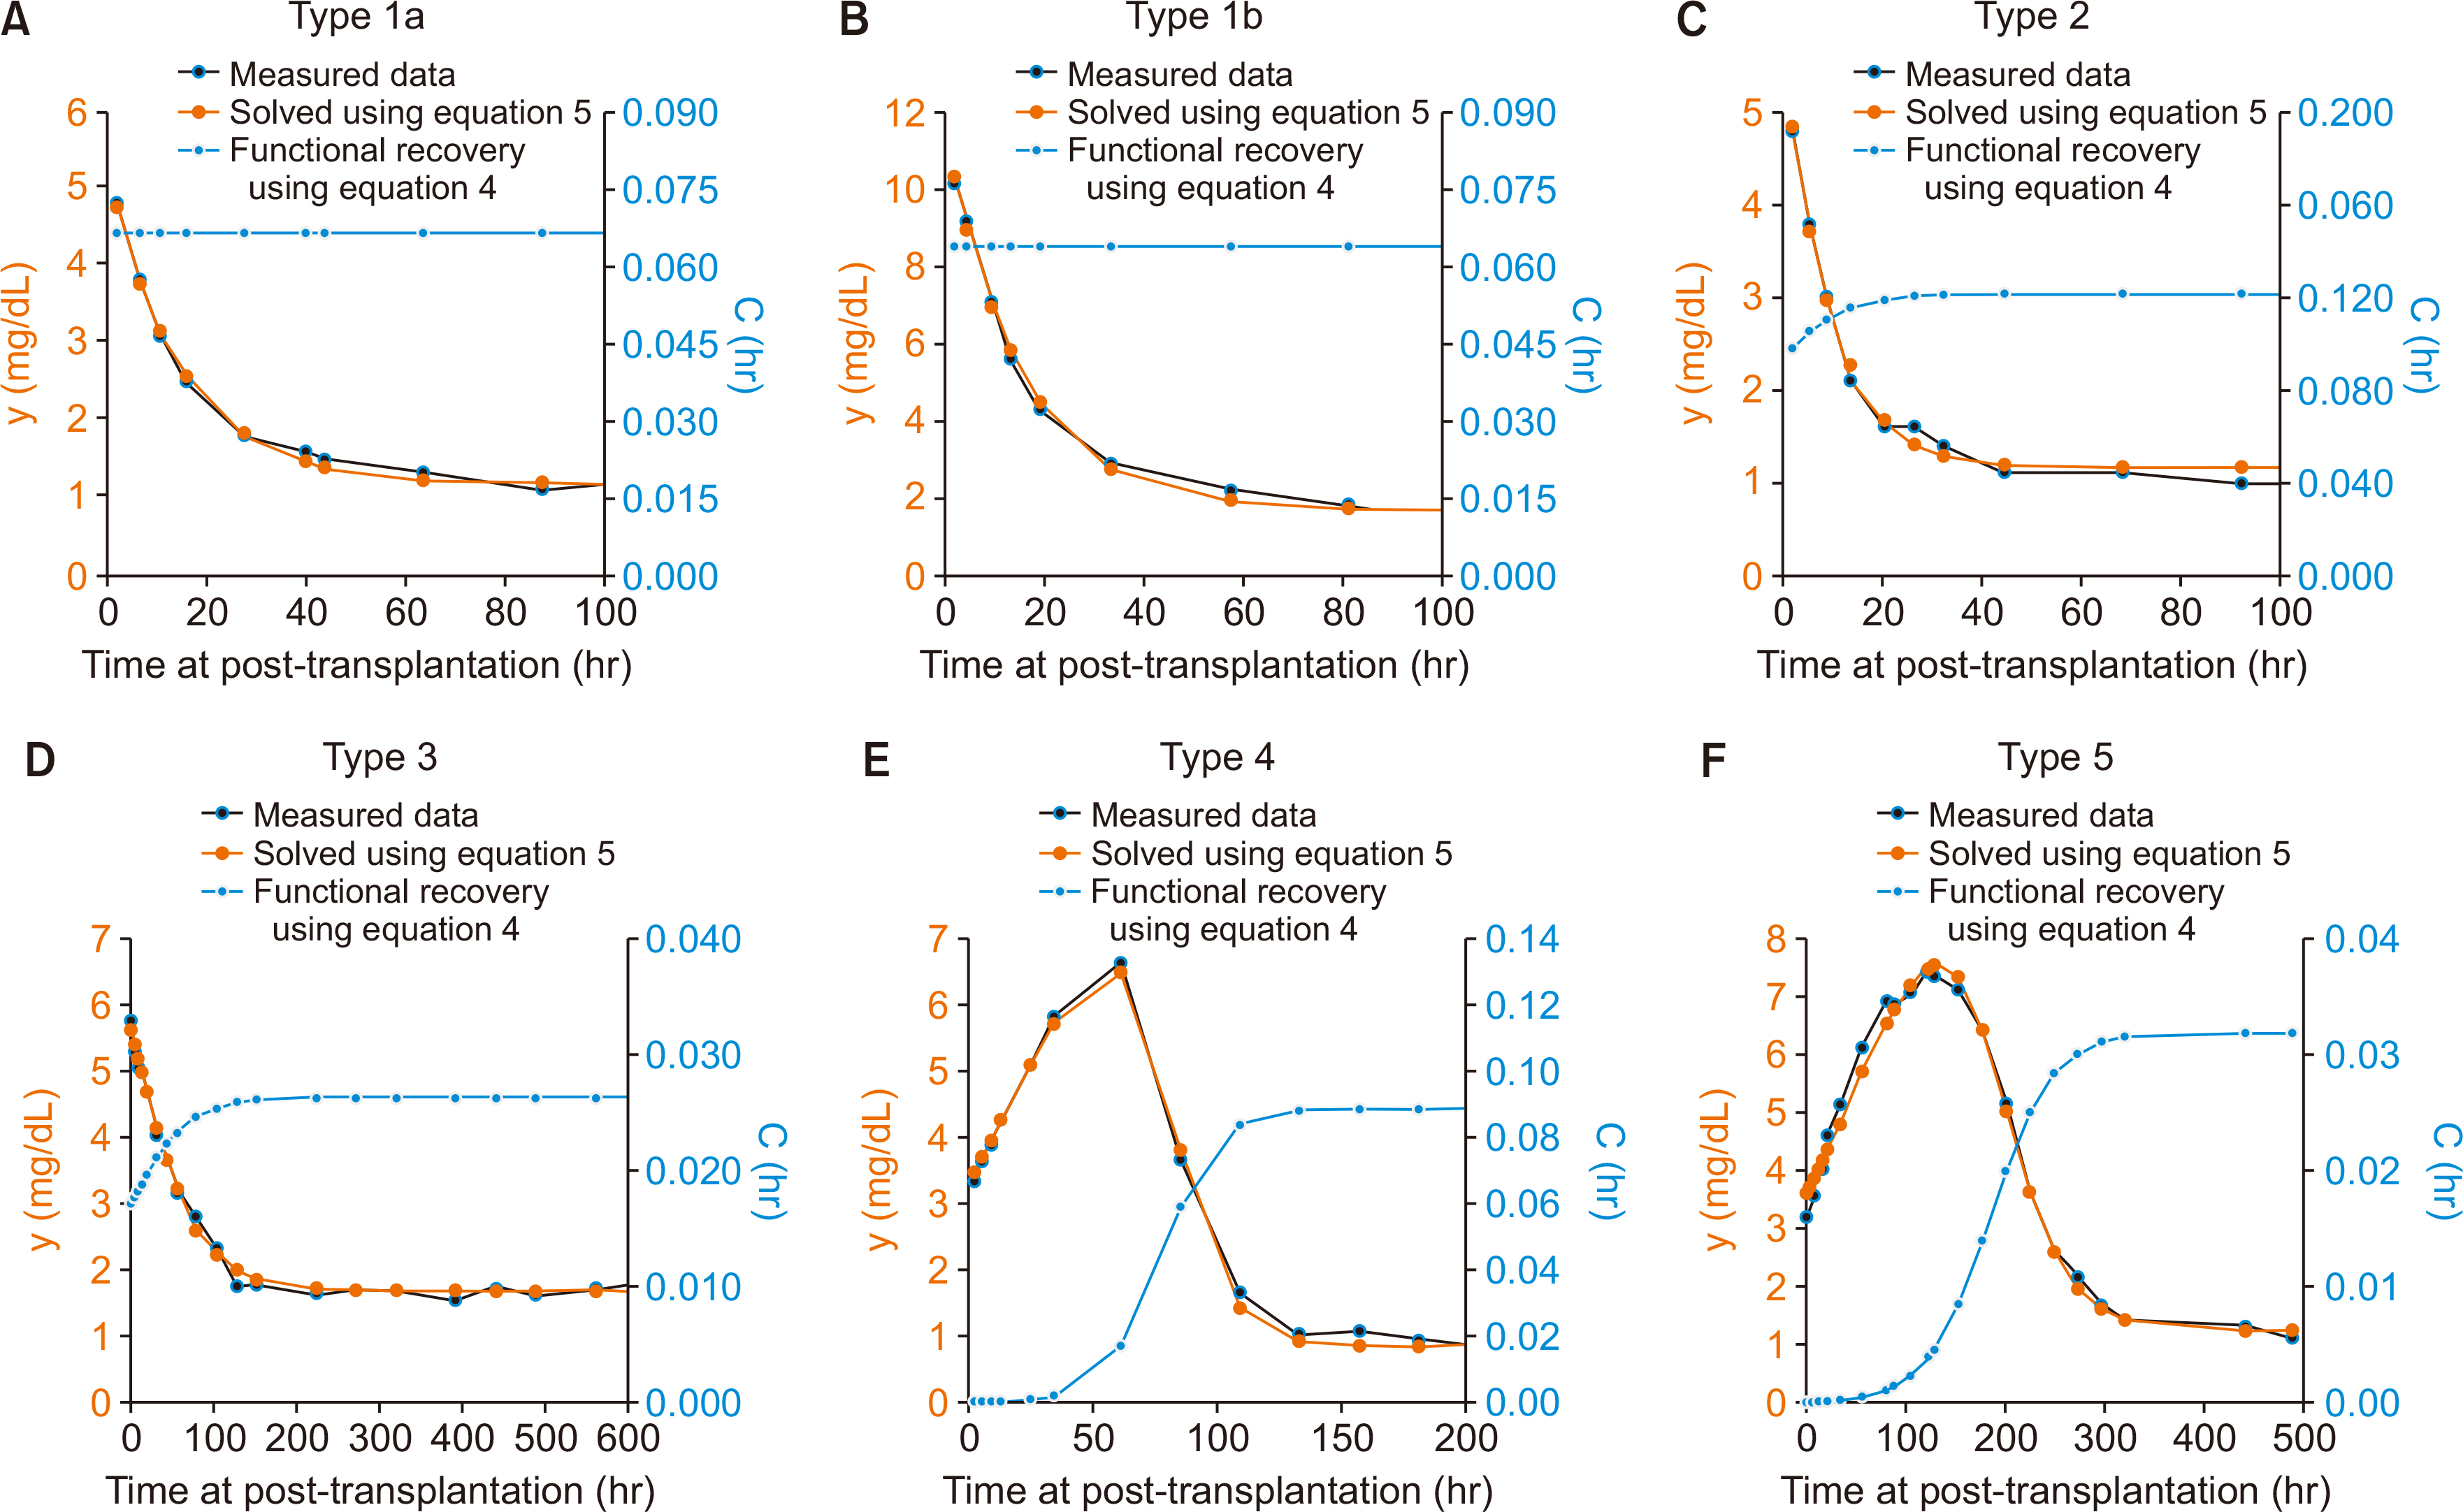
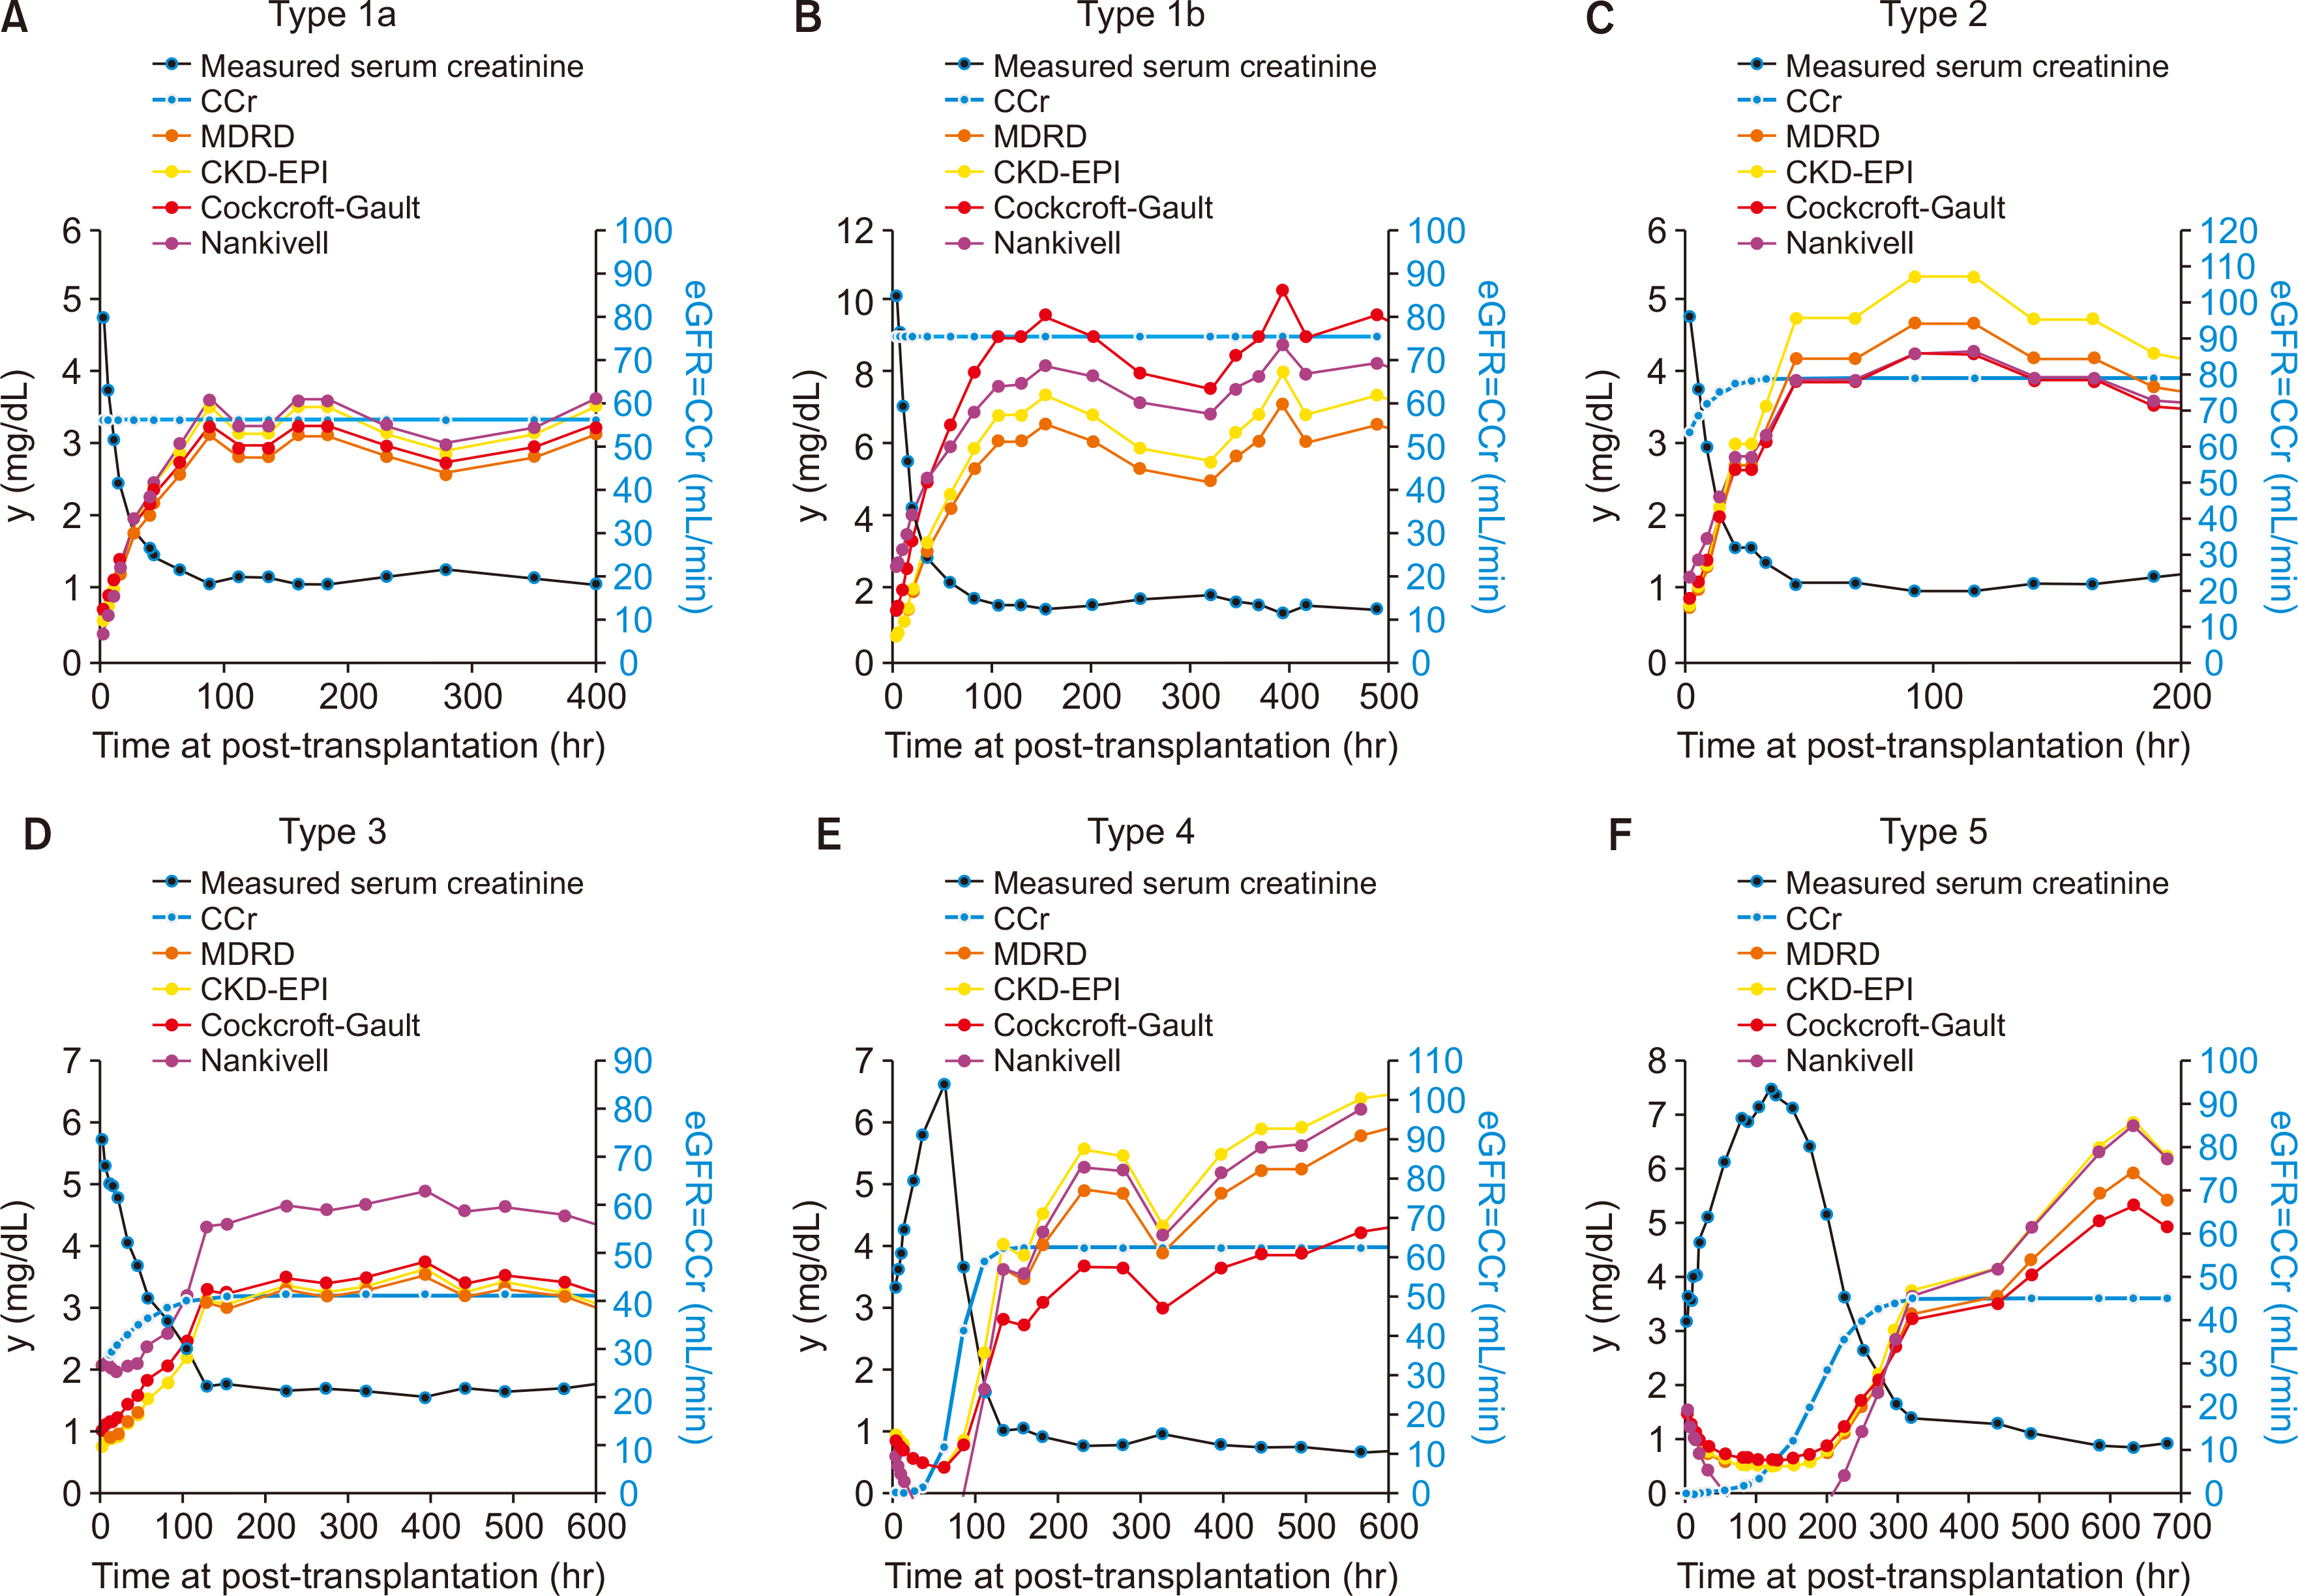
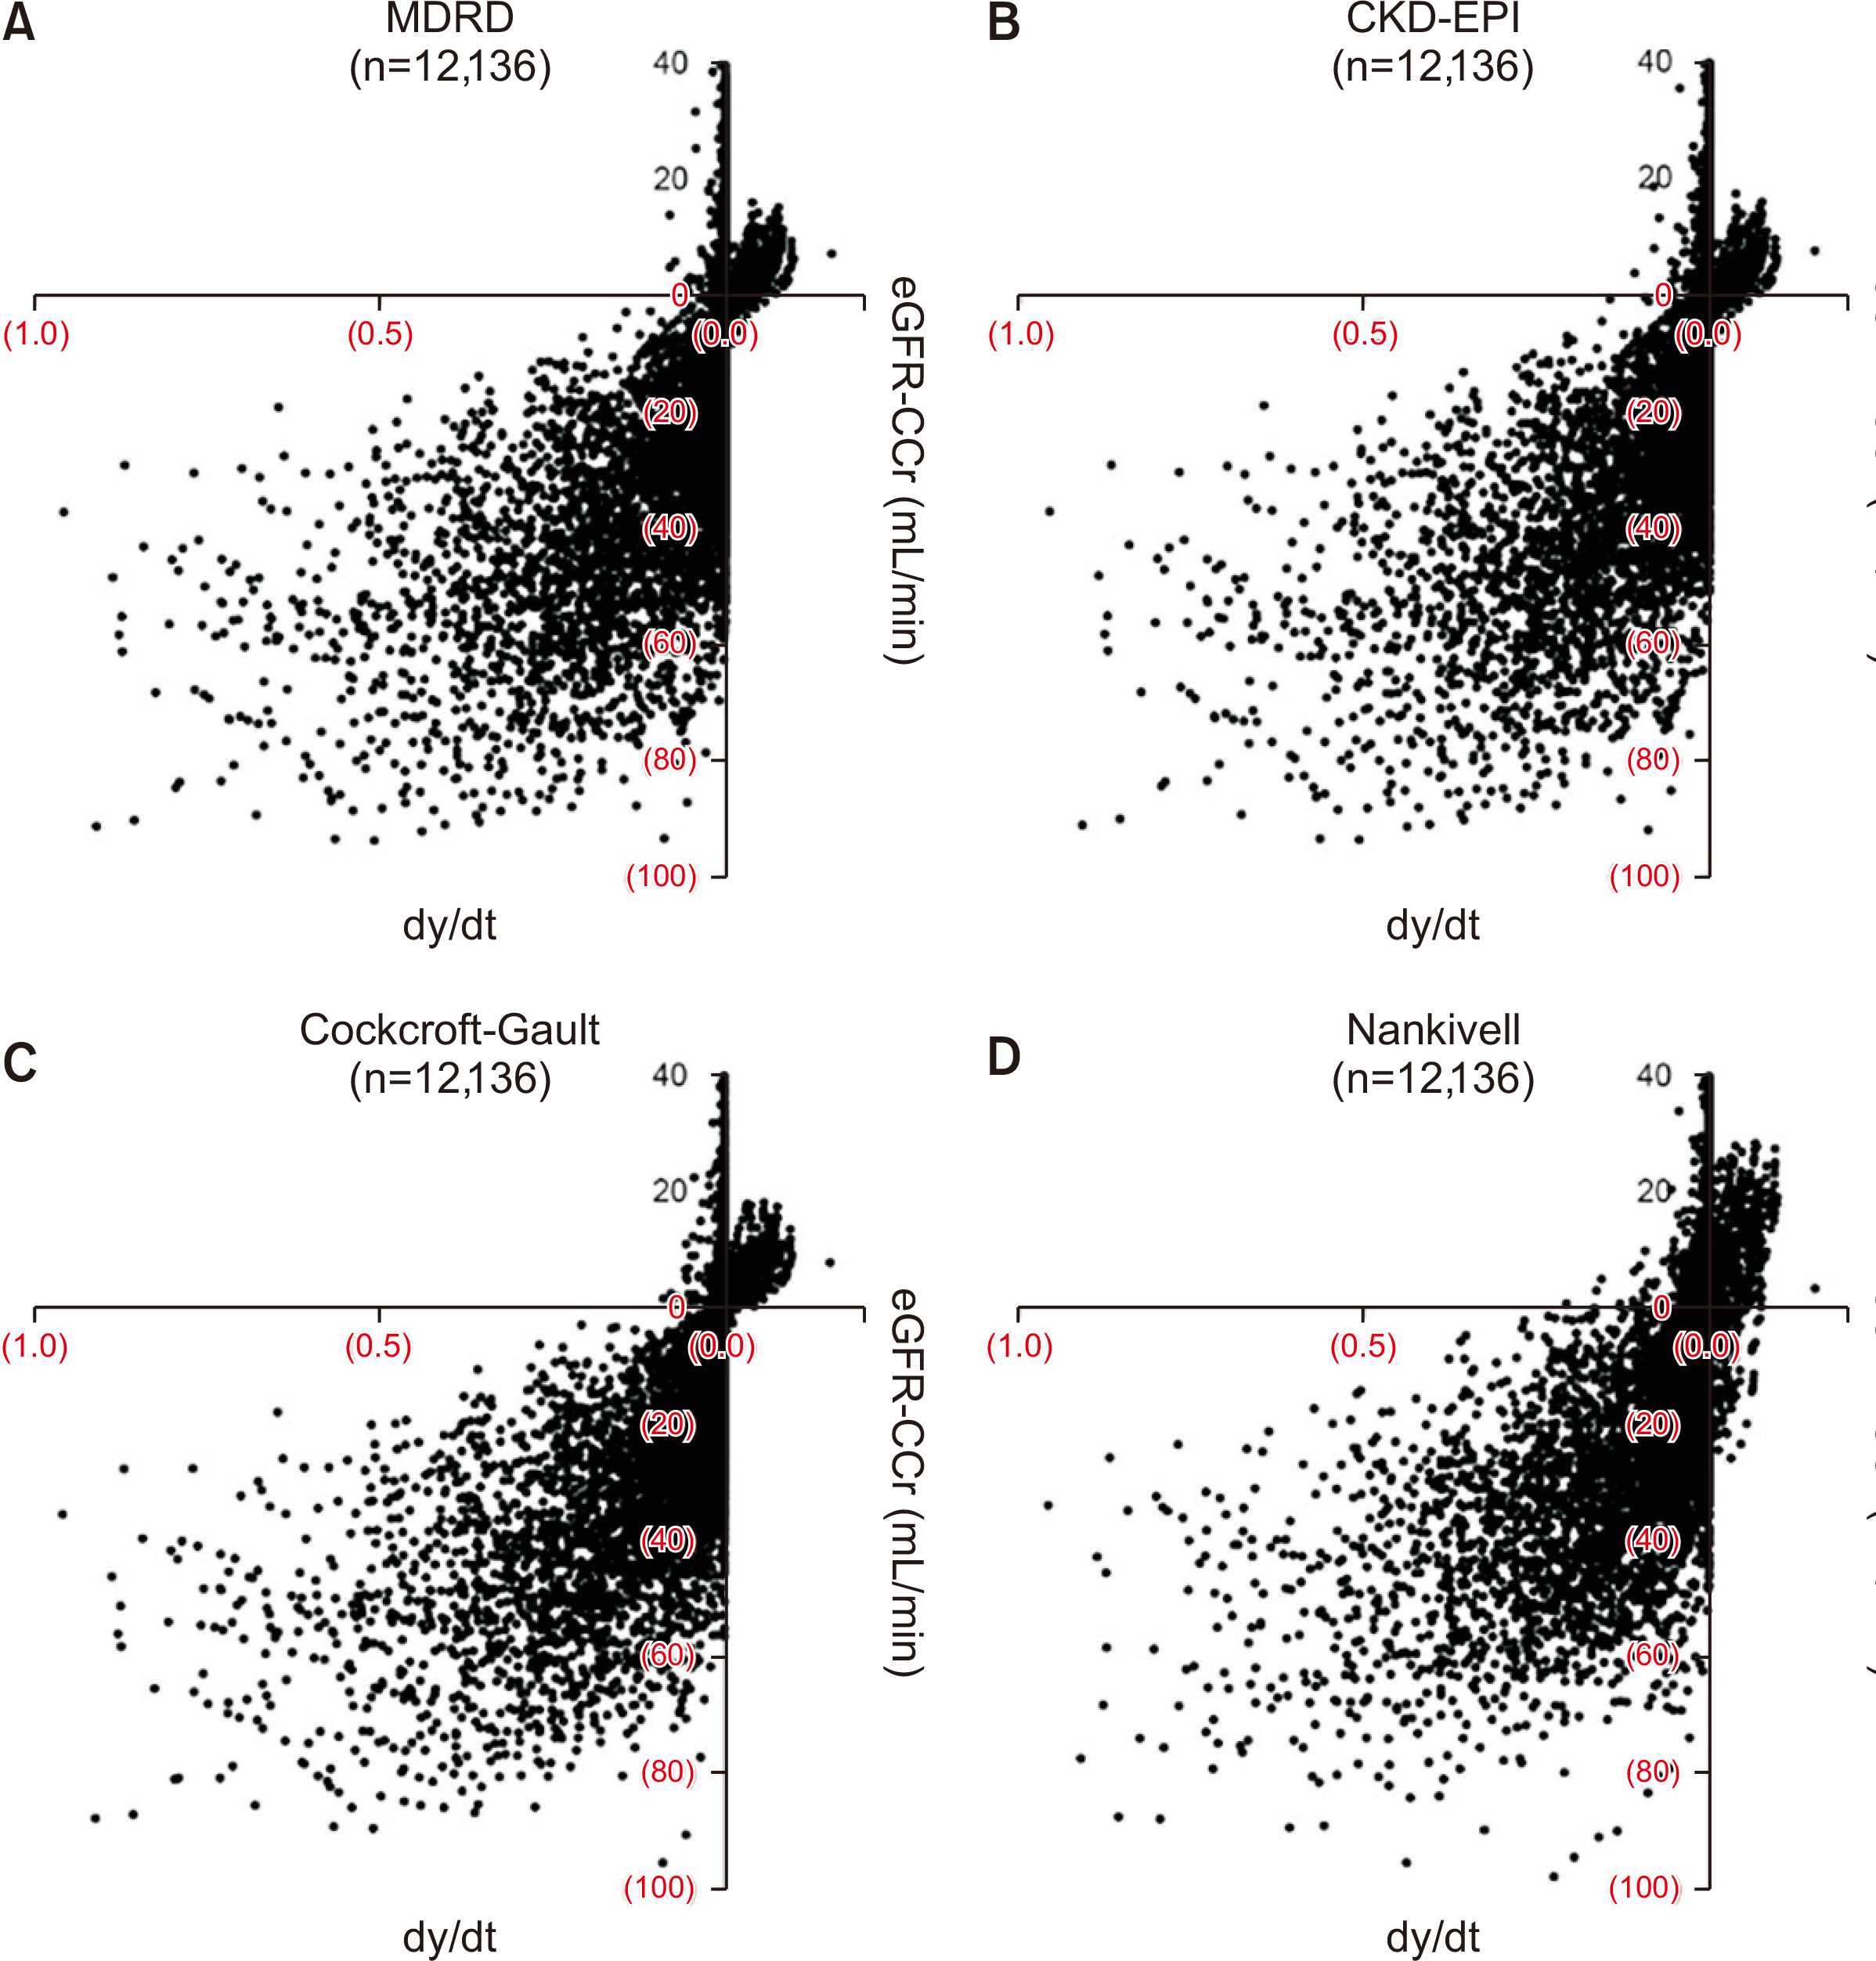
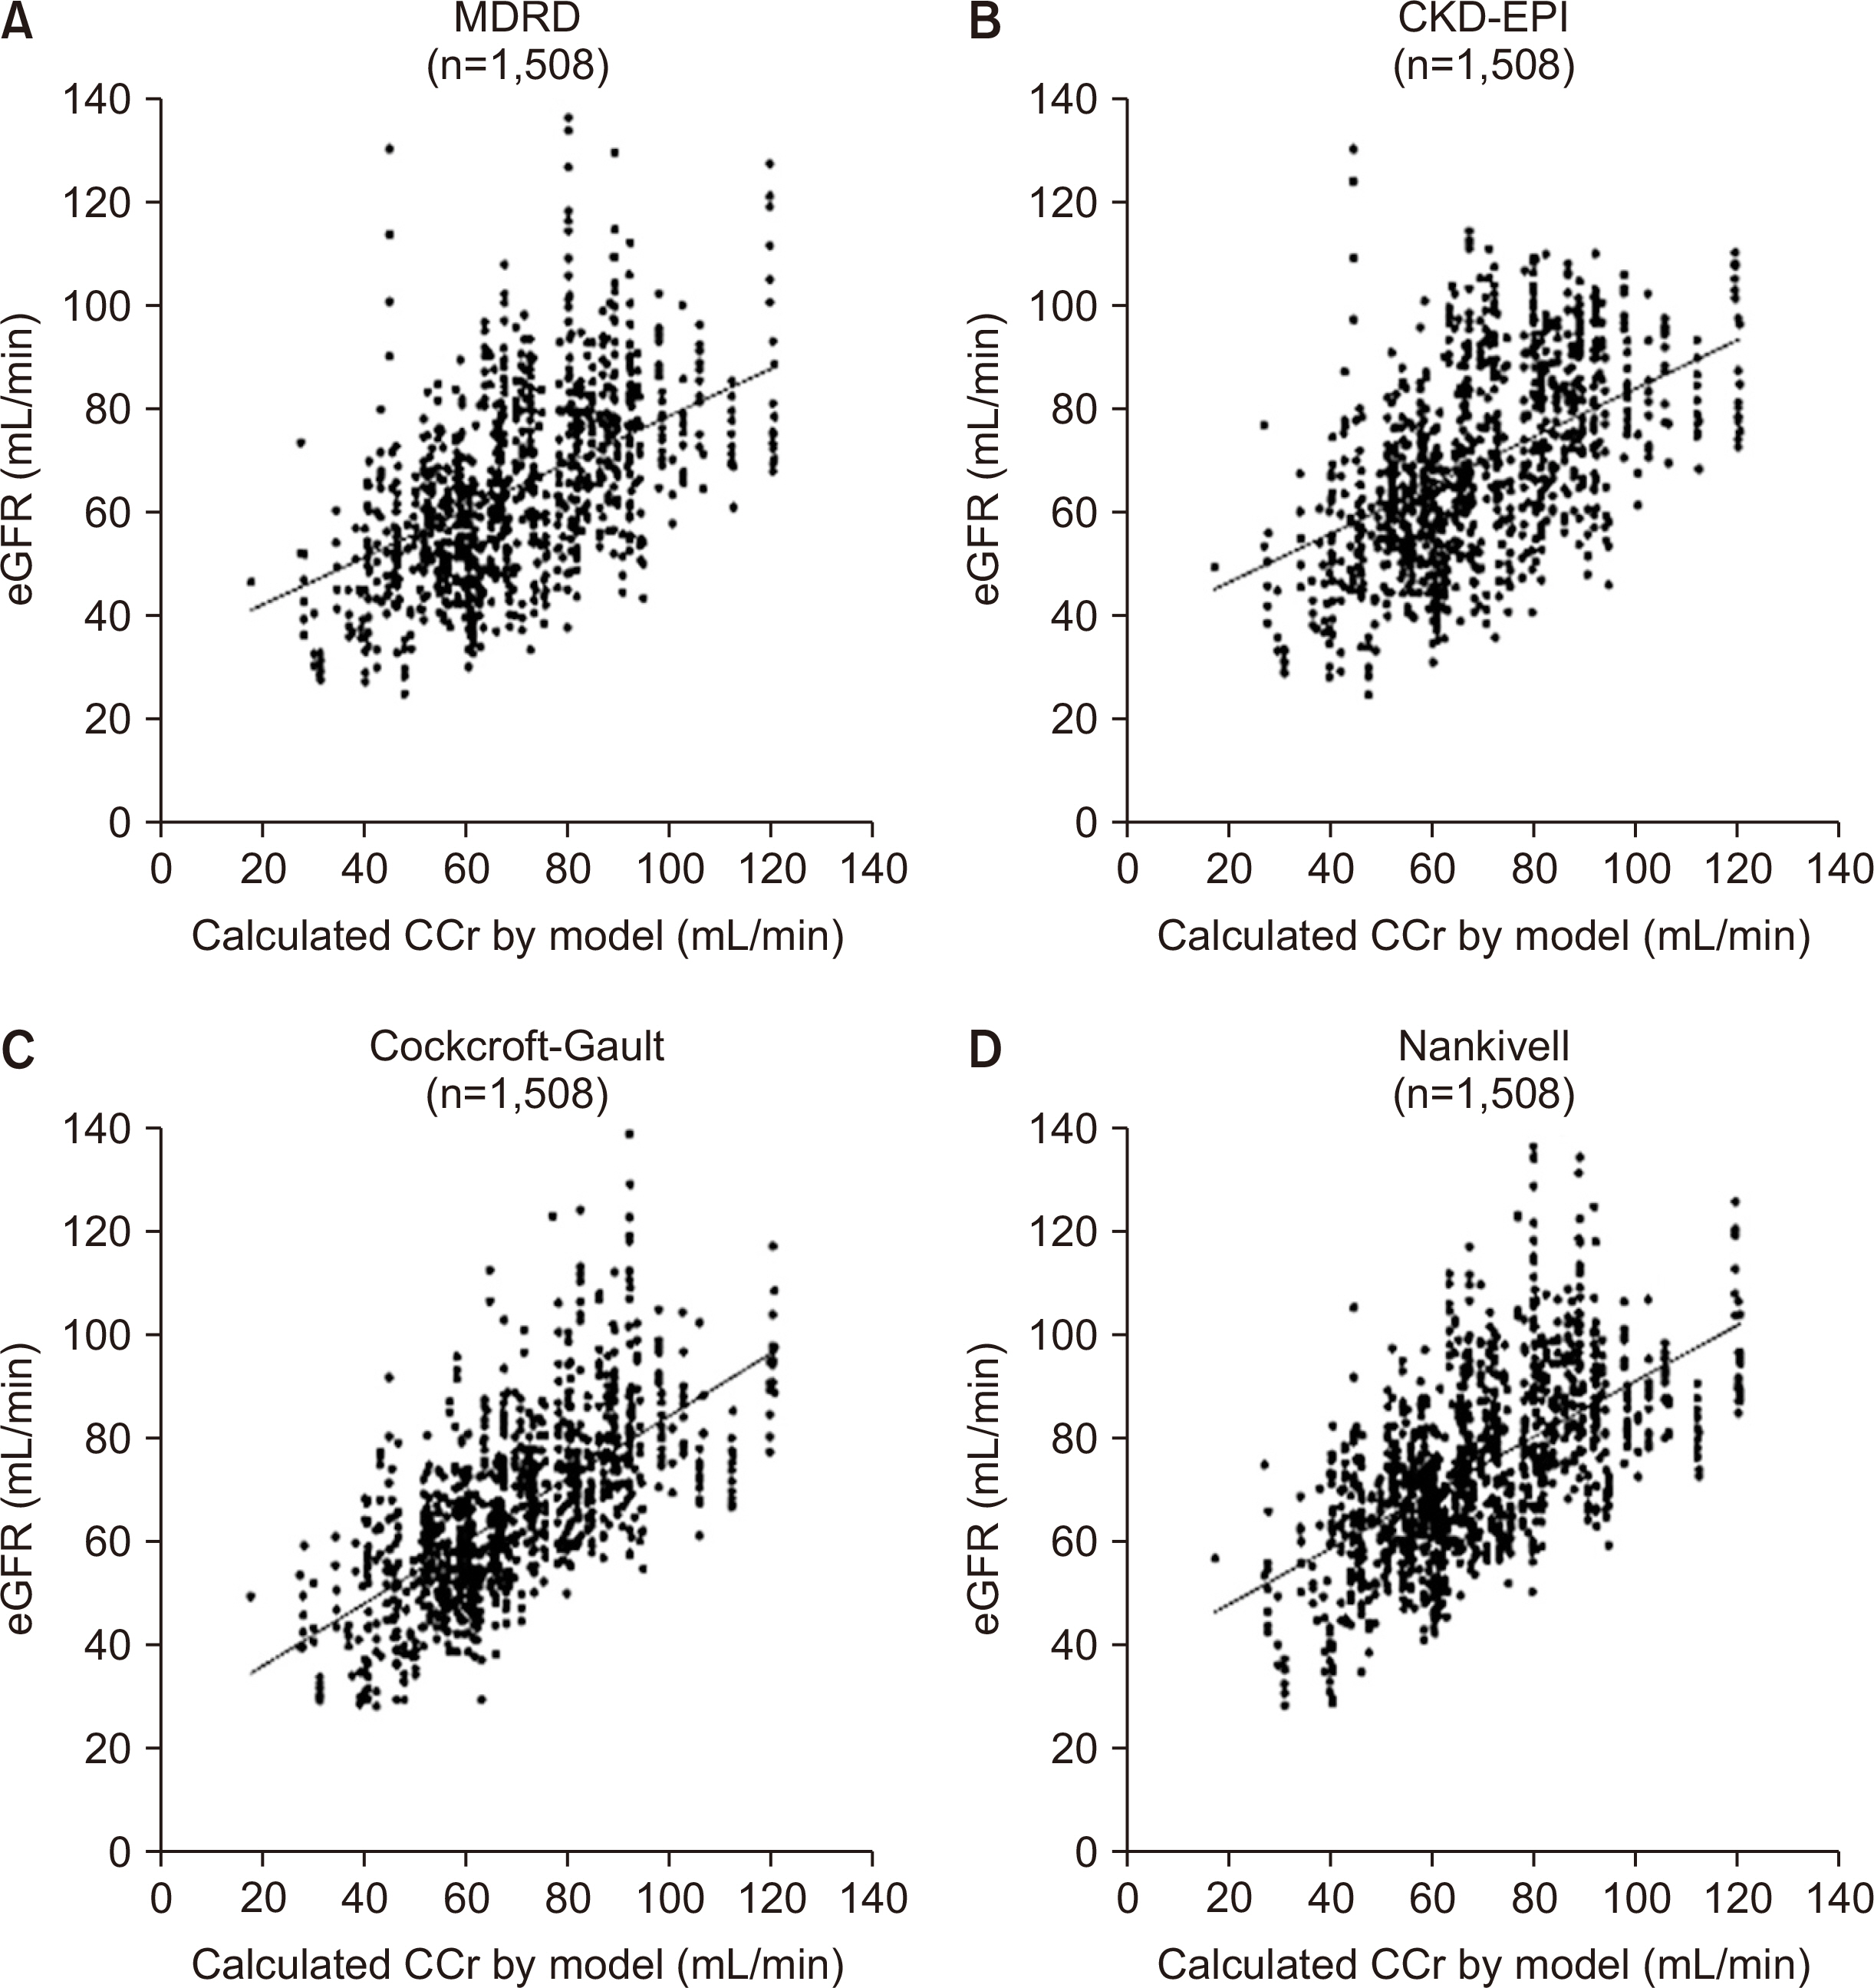
In the validation of model equations, linear regression analysis yielded adjusted R 2 values of 0.972 and 0.925 for equation 5 (applicable when renal function is changing) and equation 1 (applicable when renal function is unchanged), respectively. In selected cases, the population comprised individuals who presented an adjusted R 2 value >0.95 with equation 5. Linear regression analysis showed that adjusted R 2 values and Pearson's correlation coefficients for equation 5 and equation 1 were 0.994 and 0.997 (P<0.001) and 0.956 and 0.978 (P<0.001), respectively. Most of the eGFR formulas are mathematically applicable only if the creatinine input rate equals the creatinine output rate when comparing between commonly used eGFRs and creatinine clearance using the modeled equation.
Conclusions
The proposed equations can provide a new perspective for calculating renal function during the early phase of kidney transplantation. A study of a correlation between the equations and long-term graft outcomes is required.
Figure
Reference
-
1. Cockcroft DW, Gault MH. 1976; Prediction of creatinine clearance from serum creatinine. Nephron. 16:31–41. DOI: 10.1159/000180580. PMID: 1244564.
Article2. Levey AS, Bosch JP, Lewis JB, Greene T, Rogers N, Roth D. 1999; A more accurate method to estimate glomerular filtration rate from serum creatinine: a new prediction equation. Modification of Diet in Renal Disease Study Group. Ann Intern Med. 130:461–70. DOI: 10.7326/0003-4819-130-6-199903160-00002. PMID: 10075613. PMCID: PMC5223708.
Article3. Levey AS, Stevens LA, Schmid CH, Zhang YL, Castro AF 3rd, Feldman HI, et al. 2009; A new equation to estimate glomerular filtration rate. Ann Intern Med. 150:604–12. DOI: 10.7326/0003-4819-150-9-200905050-00006. PMID: 19414839.
Article4. Nankivell BJ, Gruenewald SM, Allen RD, Chapman JR. 1995; Predicting glomerular filtration rate after kidney transplantation. Transplantation. 59:1683–9. DOI: 10.1097/00007890-199506270-00007. PMID: 7604438.
Article5. Delanaye P, Cavalier E, Cristol JP, Delanghe JR. 2014; Calibration and precision of serum creatinine and plasma cystatin C measurement: impact on the estimation of glomerular filtration rate. J Nephrol. 27:467–75. DOI: 10.1007/s40620-014-0087-7. PMID: 24711159.
Article6. Aitken E, Cooper C, Dempster N, McDermott M, Ceresa C, Kingsmore D. 2015; Delayed graft function is a syndrome rather than a diagnosis. Exp Clin Transplant. 13:19–25. PMID: 25654410.7. Sharif A, Borrows R. 2013; Delayed graft function after kidney transplantation: the clinical perspective. Am J Kidney Dis. 62:150–8. DOI: 10.1053/j.ajkd.2012.11.050. PMID: 23391536. PMCID: PMC7504189.
Article8. Siedlecki A, Irish W, Brennan DC. 2011; Delayed graft function in the kidney transplant. Am J Transplant. 11:2279–96. DOI: 10.1111/j.1600-6143.2011.03754.x. PMID: 21929642.
Article9. Gregoir W. 1962; Congenital vesico-ureteral reflux. Acta Urol Belg. 30:286–300. PMID: 13901619.10. Lich RJ, Howerton LW, Davis LA. 1961; Childhood urosepsis. J Ky Med Assoc. 59:1177–9. DOI: 10.1055/s-0040-1717072. PMID: 14465076.11. Mitch WE, Walser M. 1978; A proposed mechanism for reduced creatinine excretion in severe chronic renal failure. Nephron. 21:248–54. DOI: 10.1159/000181400. PMID: 714198.
Article12. Levey AS, Eckardt KU, Tsukamoto Y, Levin A, Coresh J, Rossert J, et al. 2005; Definition and classification of chronic kidney disease: a position statement from Kidney Disease: Improving Global Outcomes (KDIGO). Kidney Int. 67:2089–100. DOI: 10.1111/j.1523-1755.2005.00365.x. PMID: 15882252.
Article13. White CA, Huang D, Akbari A, Garland J, Knoll GA. 2008; Performance of creatinine-based estimates of GFR in kidney transplant recipients: a systematic review. Am J Kidney Dis. 51:1005–15. DOI: 10.1053/j.ajkd.2008.02.308. PMID: 18455847.
Article14. Santos J, Martins LS. 2015; Estimating glomerular filtration rate in kidney transplantation: still searching for the best marker. World J Nephrol. 4:345–53. DOI: 10.5527/wjn.v4.i3.345. PMID: 26167457. PMCID: PMC4491924.
Article15. Schröppel B, Legendre C. 2014; Delayed kidney graft function: from mechanism to translation. Kidney Int. 86:251–8. DOI: 10.1038/ki.2014.18. PMID: 24522494. PMCID: PMC7477357.
Article16. Gaber AO, Mulgaonkar S, Kahan BD, Woodle ES, Alloway R, Bajjoka I, et al. 2011; YSPSL (rPSGL-Ig) for improvement of early renal allograft function: a double-blind, placebo-controlled, multi-center Phase IIa study. Clin Transplant. 25:523–33. DOI: 10.1111/j.1399-0012.2010.01295.x. PMID: 20573162.
- Full Text Links
- Actions
-
Cited
- CITED
-
- Close
- Share
- Similar articles
-
- Change in Plasma Homocysteine Concentration during the Recovery Phase of Renal Transplantation
- Renal Function Recovery in Donors and Recipients after Live Donor Nephrectomy: Hand-Assisted Laparoscopic vs. Open Procedures
- Late Onset Renal Vein Thrombosis after Kidney Transplantation
- Relationship between serum cystatin C and glomerular filtration rate in renal transplant patients
- Hypertension after kidney transplantation

