Drawing Guidelines for Receiver Operating Characteristic Curve in Preparation of Manuscripts
- Affiliations
-
- 1Department of Orthopedic Surgery, Seoul Sacred Heart General Hospital, Seoul, Korea
- KMID: 2503012
- DOI: http://doi.org/10.3346/jkms.2020.35.e171
Abstract
- The appropriate plot effectively conveys the author's conclusions to the readers. The Journal of Korean Medical Science provides a series of special articles to show you how to make consistent and excellent plots easier. In the second article, drawing receiver operating characteristic (ROC) curve is introduced. A ROC curve is a graphic plot that illustrates the diagnostic ability as its discrimination threshold is varied. It is widely used as logistic regression analysis as machine learning becomes widespread. It has great visual effect in comparing various diagnostic tools.
Figure
-
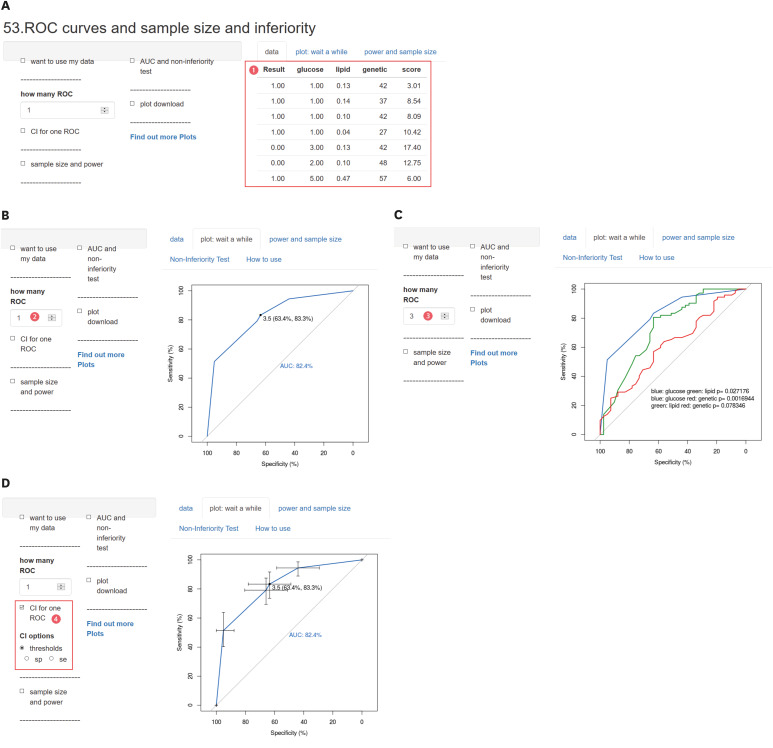
Fig. 1 First tool for ROC. (A) Initial screen and example data. (B) One ROC plot. (C) Three ROC curves. (D) One ROC curve with CIs.ROC = receiver operating characteristic, AUC = area under curve, CI = confidence interval.
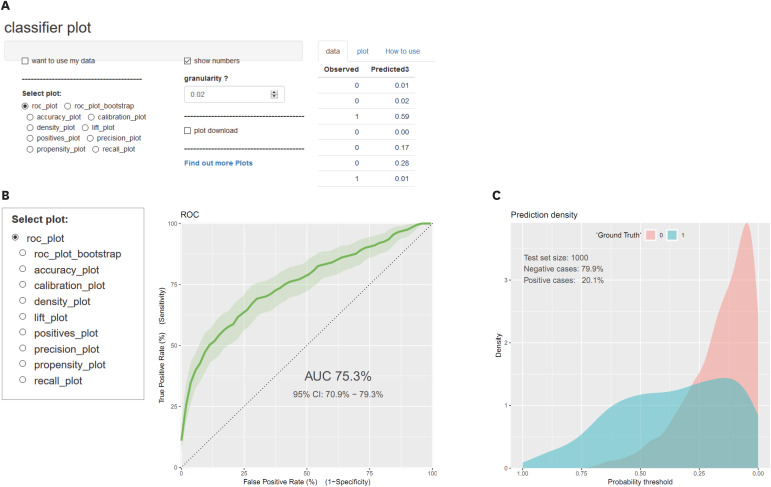
Fig. 2 Second tool. (A) Initial screen of classifier plot. (B) Lists of available curves. (C) Density plot.AUC = area under curve, CI = confidence interval.
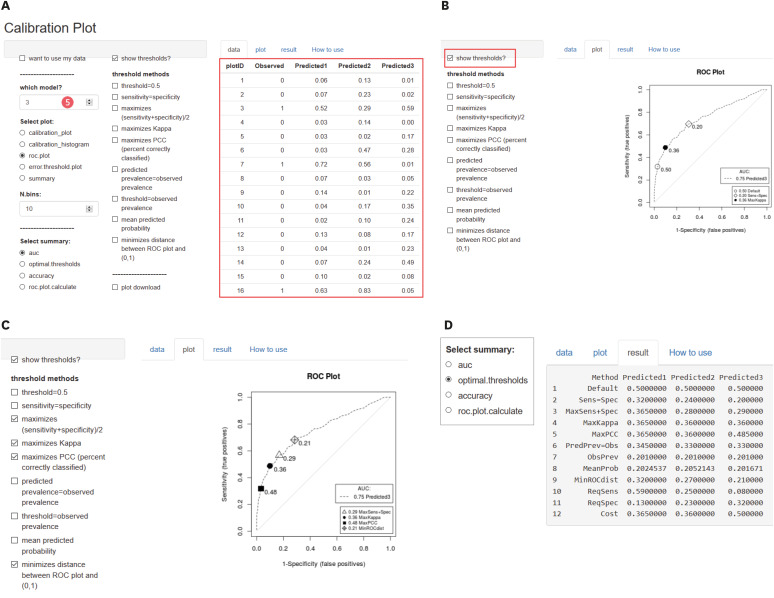
Fig. 3 Third tool. (A) Initial screen of calibration plot. (B) Available thresholds options. (C) Select multiple threshold methods. (D) Various optimal thresholds result. (E) Various optimal thresholds represented on plot.ROC = receiver operating characteristic, AUC = area under curve.
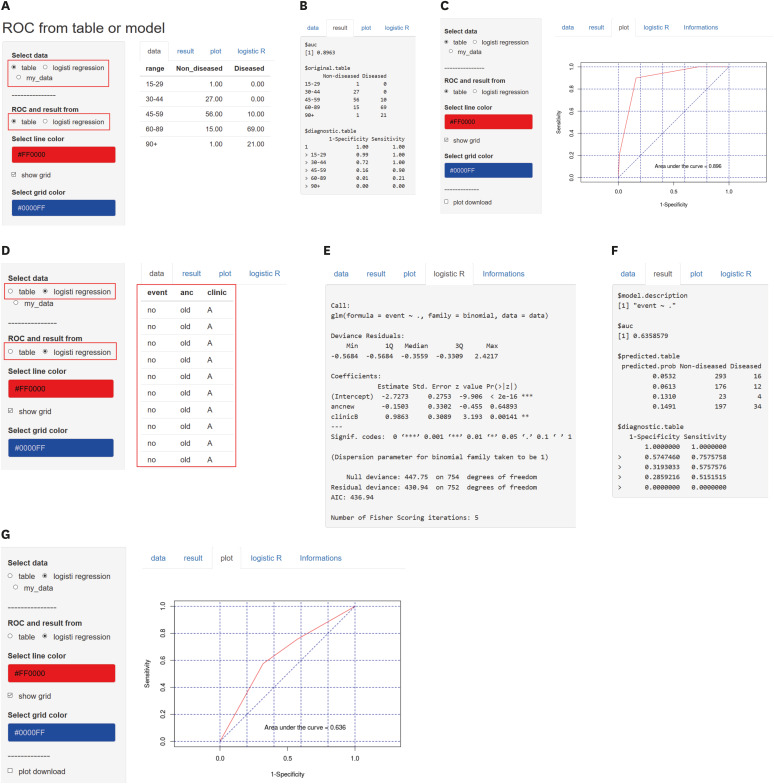
Fig. 4 Fourth tool. (A) ROC from table or model. (B) Calculated specificity and sensitivity using data. (C) Select color of line and grid. (D) Data for logistic regression. (E) Result of logistic regression. (F) Diagnostic table as a result of logistic regression. (G) ROC curve from logistic regression.ROC = receiver operating characteristic.
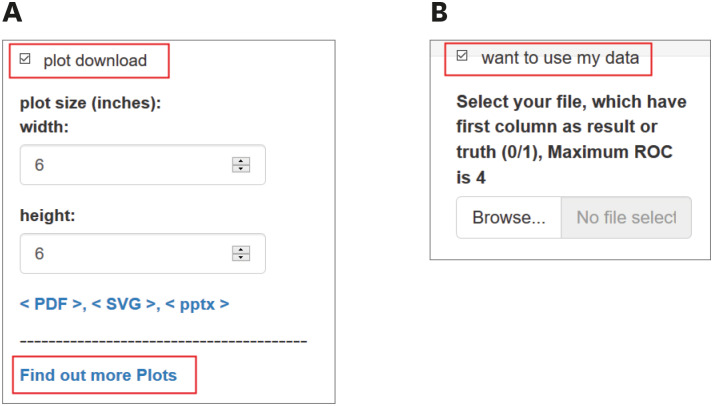
Fig. 5 How to upload data and download plots. (A) How to download the plot. (B) How to upload your own data.ROC = receiver operating characteristic.
Reference
- Full Text Links
-
- Actions
-
Cited
- CITED
-
- Close
- Share
-
- Similar articles
-
- Drawing Test Form for Depression: The Development of Drawing Tests for Predicting Depression Among Breast Cancer Patients
- Receiver Operating Characteristic (ROC) Curve: Practical Review for Radiologists
- Analysis of shoulder MR imaging using Receiver Operating Characteristic curve
- Receiver operating characteristic curve: overview and practical use for clinicians
- Interpretation of Receiver Operating Characteristics(ROC)
