Korean J Sports Med.
2019 Dec;37(4):155-161. 10.5763/kjsm.2019.37.4.155.
Achilles Tendon Injury and Seasonal Variation: An Analysis Using Google Trends
- Affiliations
-
- 1Department of Orthopedic Surgery, Seoul Red Cross Hospital, Seoul, Korea. gulpae@naver.com
- KMID: 2466805
- DOI: http://doi.org/10.5763/kjsm.2019.37.4.155
Abstract
- PURPOSE
Achilles tendon injury is one of the most common sports-related injuries. Several studies suggest that Achilles tendon injury is associated with seasonal variation. The purpose of this study is to determine the relationship between seasonal variations and Achilles tendon injury through Google Trends (GT) and to evaluate the correlation between GT and actual data.
METHODS
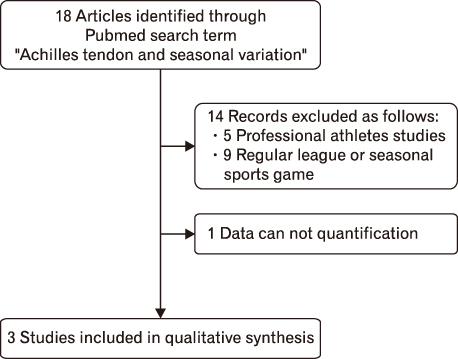
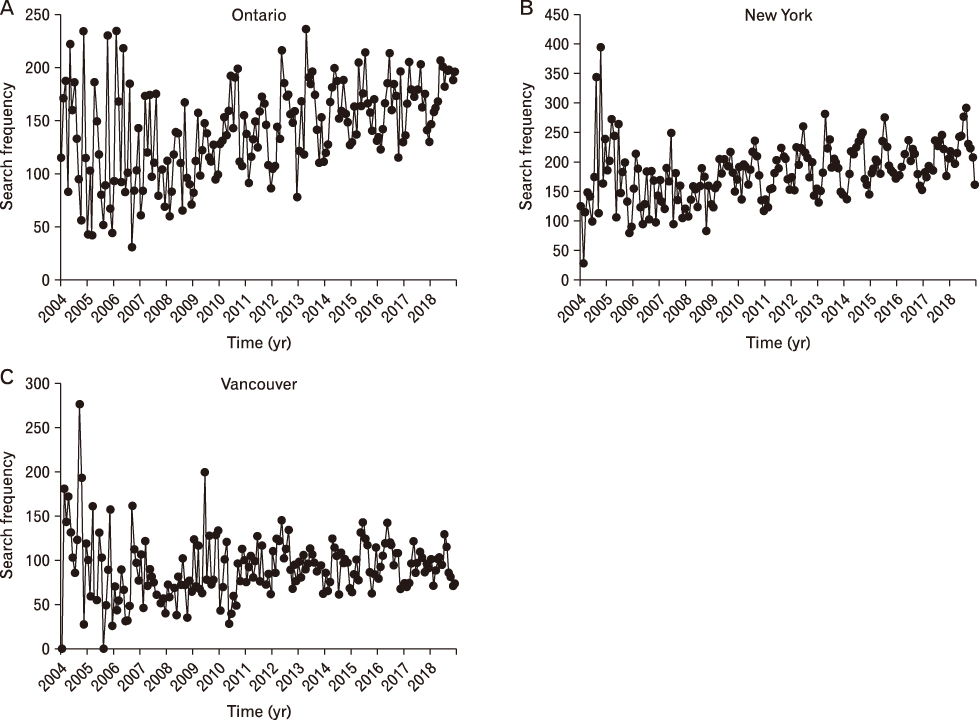
We identified three articles through PubMed database as control group. The experimental group (GT group) was collected from GT by setting the same conditions as the control group. For GT group, we use the search terms related to the Achilles tendon injury. The exploration period was set from January 1, 2004 to December 31, 2018.
RESULTS
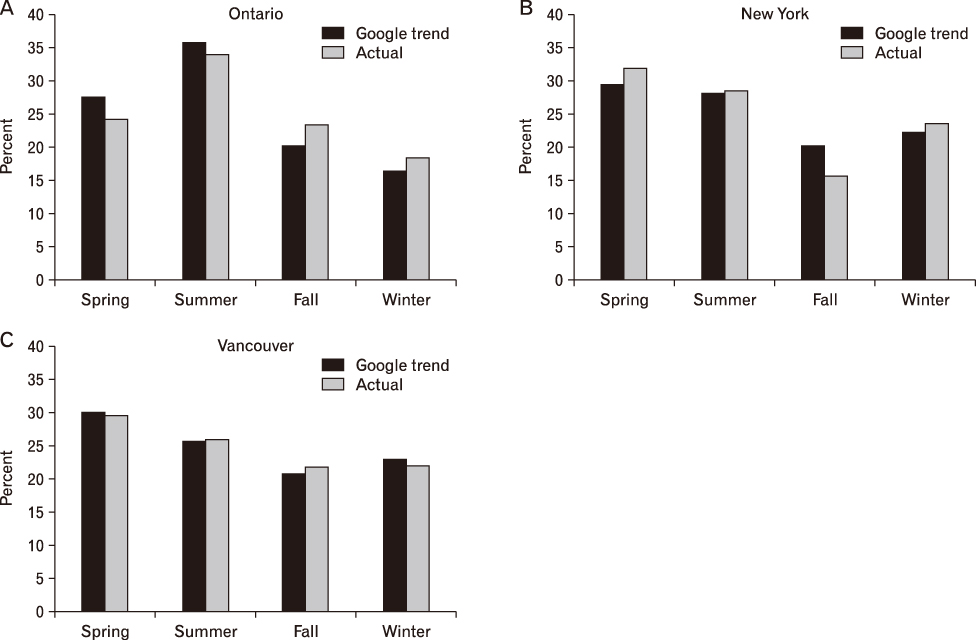
There is approximately more than 90% (p<0.05) correlation between GT group and control group. The incidences of Ontario were the highest in the summer. Those of New York and Vancouver were higher in spring compared to those of Ontario.
CONCLUSION
Our study implies that there is significant seasonal variation for Achilles tendon injury. Most of these injuries seem to occur in spring and summer. Also, there is a significant relationship between GT data and actual data. If the data from GT can be analyzed properly, these approach methods will be useful for epidemiological research.
Keyword
MeSH Terms
Figure
Reference
-
1. Levi N. The incidence of Achilles tendon rupture in Copenhagen. Injury. 1997; 28:311–313.2. Nillius SA, Nilsson BE, Westlin NE. The incidence of Achilles tendon rupture. Acta Orthop Scand. 1976; 47:118–121.3. Pivarnik JM, Reeves MJ, Rafferty AP. Seasonal variation in adult leisure-time physical activity. Med Sci Sports Exerc. 2003; 35:1004–1008.4. Heo YM, Yi JW, Oh BH, Jun JB, Cho HJ, Kim TG. Study on the orthopedic characteristics of bicycle injury patients. Korean J Sports Med. 2018; 36:1–6.5. Suchak AA, Bostick G, Reid D, Blitz S, Jomha N. The incidence of Achilles tendon ruptures in Edmonton, Canada. Foot Ankle Int. 2005; 26:932–936.6. Houshian S, Tscherning T, Riegels-Nielsen P. The epidemiology of Achilles tendon rupture in a Danish county. Injury. 1998; 29:651–654.7. Caldwell JE, Lightsey HM, Trofa DP, Swindell HW, Greisberg JK, Vosseller JT. Seasonal variation of Achilles tendon injury. J Am Acad Orthop Surg Glob Res Rev. 2018; 2:e043.8. Scott A, Grewal N, Guy P. The seasonal variation of Achilles tendon ruptures in Vancouver, Canada: a retrospective study. BMJ Open. 2014; 4:e004320.9. Sheth U, Wasserstein D, Jenkinson R, Moineddin R, Kreder H, Jaglal SB. The epidemiology and trends in management of acute Achilles tendon ruptures in Ontario, Canada: a population-based study of 27 607 patients. Bone Joint J. 2017; 99:78–86.10. Cervellin G, Comelli I, Lippi G. Is Google Trends a reliable tool for digital epidemiology? Insights from different clinical settings. J Epidemiol Glob Health. 2017; 7:185–189.11. Brownstein JS, Freifeld CC, Madoff LC. Digital disease detection: harnessing the Web for public health surveillance. N Engl J Med. 2009; 360:2153–2155.12. International Telecommunication Union. ICT facts and figures 2017 [Internet]. Geneva (CH): International Telecommunication Union;c2017. cited 2019 Mar 9. Available from: https://www.itu.int/en/ITU-D/Statistics/Documents/facts/ICTFactsFigures2017.pdf.13. Strotman PK, Novicoff WM, Nelson SJ, Browne JA. Increasing public interest in stem cell injections for osteoarthritis of the hip and knee: a Google Trends analysis. J Arthroplasty. 2019; 34:1053–1057.14. Ginsberg J, Mohebbi MH, Patel RS, Brammer L, Smolinski MS, Brilliant L. Detecting influenza epidemics using search engine query data. Nature. 2009; 457:1012–1014.15. Google. Trends help center [Internet]. Mountain View (CA): Google;cited 2019 Aug 12. Available from: https://support.google.com/trends/.16. Ingram DG, Matthews CK, Plante DT. Seasonal trends in sleep-disordered breathing: evidence from Internet search engine query data. Sleep Breath. 2015; 19:79–84.17. Ingram DG, Plante DT. Seasonal trends in restless legs symptomatology: evidence from Internet search query data. Sleep Med. 2013; 14:1364–1368.18. Kardes S. Seasonal variation in the internet searches for gout: an ecological study. Clin Rheumatol. 2019; 38:769–775.19. Kardes S, Kardes E. Seasonality of bruxism: evidence from Google Trends. Sleep Breath. 2019; 23:695–701.20. Plante DT, Ingram DG. Seasonal trends in tinnitus symptomatology: evidence from Internet search engine query data. Eur Arch Otorhinolaryngol. 2015; 272:2807–2813.21. Toosi B, Kalia S. Seasonal and geographic patterns in tanning using real-time data from Google Trends. JAMA Dermatol. 2016; 152:215–217.22. Barnett AG, Baker P, Dobson AJ. Analysing seasonal data. R J. 2012; 4:5–10.23. R Foundation. R package version 0.3-5. Season: seasonal analysis of health data; 2014 [Internet]. Vienna (AT): R Foundation;cited 2019 Nov 1. Available from: https://cran.r-project.org/package=season/.24. Environment Canada, Meteorological Service of Canada. Canadian climate normal: 1981–2010 Climate Normals & Averages [Internet]. Ottawa (CA): Environment Canada;2019. cited 2019 Nov 1. Available from: http://climate.weather.gc.ca/climate_normals/index_e.html.25. World Meteorological Organization. Mean daily minimum/maximum temperature of Vancouver, British Columbia in 30 years [Internet]. Geneva (CH): World Meteorological Organization;2019. cited 2019 Nov 1. Available from: http://worldweather.wmo.int/en/city.html?cityId=266.26. World Meteorological Organization. Mean daily minimum/maximum temperature of New York city, New York in 30 years [Internet]. Geneva (CH): World Meteorological Organization;2019. cited 2019 Nov 1. Available from: http://worldweather.wmo.int/en/city.html?cityId=278.27. Institute of Medicine (US) Committee on a National Surveillance System for Cardiovascular and Select Chronic Diseases. A nationwide framework for surveillance of cardiovascular and chronic lung diseases. Washington (DC): National Academies Press (US);2011.28. Nuti SV, Wayda B, Ranasinghe I, et al. The use of Google Trends in health care research: a systematic review. PLoS One. 2014; 9:e109583.
- Full Text Links
- Actions
-
Cited
- CITED
-
- Close
- Share
- Similar articles
-
- Achilles Tendon Rupture Associated With Ipsilateral Medial Malleolar Fracture (A Case Report)
- Heterotopic Ossification of a Partially Ruptured Achilles Tendon (A Case Report)
- Achilles Tendon Rupture Associated with Ipsilateral Bimalleolar Fracture: A Case Report
- Treatment of Massive Defect in Achilles Tendon with Tendon Allograft: A Case Report
- Long Term Result of Four Cases without a Staged Reconstruction of an Infected Achilles Tendon Following Repair


