Regional Variation of Human Skin Surface Temperature
- Affiliations
-
- 1Department of Dermatology, Seoul National University Hospital, Seoul, Korea. ivymed27@snu.ac.kr jhchung@snu.ac.kr
- 2Institute of Human-Environment Interface Biology, Medical Research Center, Seoul National University, Seoul, Korea.
- 3Department of Biomedical Sciences, Seoul National University Graduate School, Seoul, Korea.
- KMID: 2444874
- DOI: http://doi.org/10.5021/ad.2019.31.3.349
Abstract
- No abstract available.
Figure
-
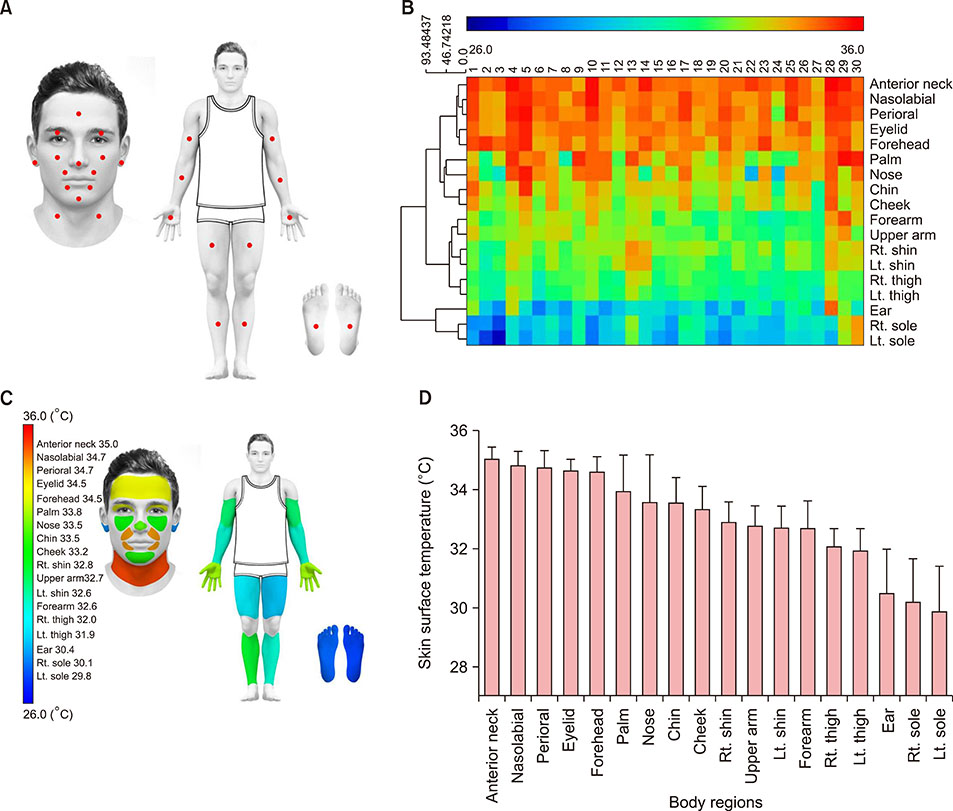
Fig. 1 (A) Schematic diagram of the regions that measured skin surface temperature (SST). As a whole, a total of 15 regions were measured. In the face, 8 regions were measured. And another 7 regions were the anterior neck, palm, forearm, upper arm, sole, shin, and thigh. Except for forehead, nose tip, and chin, both sides of each region were measured. (B) Heat map and hierarchical clustering of SST. Participants maintained a supine position and the temperature was recorded if it remained stable for more than 5 seconds. The color refers to SST. The lowest temperature was depicted as blue, and the highest as red (26℃~36℃). Hierarchical clustering was performed using the “Manhattan distance” metric. All participants were represented on the x-axis (1~30), and body regions on the right (Rt.) y-axis. The left (Lt.) y-axis depicts hierarchical clustering. The top left figures show the mean distance between the regions in hierarchical clustering. (C) SST of the regions were depicted as different colors for quick reference. (D) The SST according to regions. The graphs show the average temperature and standard deviation.
Reference
-
1. Cho S, Shin MH, Kim YK, Seo JE, Lee YM, Park CH, et al. Effects of infrared radiation and heat on human skin aging in vivo. J Investig Dermatol Symp Proc. 2009; 14:15–19.
Article2. Benedict FG, Miles WR, Johnson A. The temperature of the human skin. Proc Natl Acad Sci U S A. 1919; 5:218–222.
Article3. Hardy JD, DuBois EF, Soderstrom GF. Basal metabolism, radiation, convection and vaporization at temperatures of 22 to 35℃. J Nutr. 1938; 15:477–497.
Article4. Marrakchi S, Maibach HI. Biophysical parameters of skin: map of human face, regional, and age-related differences. Contact Dermatitis. 2007; 57:28–34.
Article5. Mitchell D, Wyndham CH, Atkins AR, Vermeulen AJ, Hofmeyr HS, Strydom NB, et al. Direct measurement of the theramal responses of nude resting men in dry environments. Pflugers Arch. 1968; 303:324–343.
Article6. Yosipovitch G, Xiong GL, Haus E, Sackett-Lundeen L, Ashkenazi I, Maibach HI. Time-dependent variations of the skin barrier function in humans: transepidermal water loss, stratum corneum hydration, skin surface pH, and skin temperature. J Invest Dermatol. 1998; 110:20–23.
Article7. Rubinstein EH, Sessler DI. Skin-surface temperature gradients correlate with fingertip blood flow in humans. Anesthesiology. 1990; 73:541–545.
Article8. Simmons GH, Wong BJ, Holowatz LA, Kenney WL. Changes in the control of skin blood flow with exercise training: where do cutaneous vascular adaptations fit in? Exp Physiol. 2011; 96:822–828.
Article9. Brebner DF, Kerslake DM, Waddell JL. The effect of atmospheric humidity on skin temperature & sweat rates of resting men at two ambient temperatures. J Physiol. 1958; 144:299–306.
Article10. Waller JM, Maibach HI. Age and skin structure and function, a quantitative approach (I): blood flow, pH, thickness, and ultrasound echogenicity. Skin Res Technol. 2005; 11:221–235.
Article
- Full Text Links
-
- Actions
-
Cited
- CITED
-
- Close
- Share
-
- Similar articles
-
- Regional Morphological Study on the Development of the Human Embryonic and Fetal periderm
- Comparison of the Diagnostic Validity of Real and Absolute Skin Temperature Differences for Complex Regional Pain Syndrome
- Regional Variation in the Expression of Epidermolysis Bullosa Acquisita Antigen
- Clinical Application of Digital Infrared Thermographic Imaging for the Prediction of Foot Ulcer Development in Diabetic Patients
- The Effect of Cold Air Application for the Intraarticular and Skin Temperature Changes of Knees
