In silico evaluation of the acute occlusion effect of coronary artery on cardiac electrophysiology and the body surface potential map
- Affiliations
-
- 1SiliconSapiens Co, Seoul 06153, Korea.
- 2Department of Mechanical and Biomedical Engineering, Kangwon National University, Chuncheon 24341, Korea. ebshim@kangwon.ac.kr
- 3Department of Cardiology, University of Ulsan College of Medicine, Ulsan 44033, Korea.
- KMID: 2443618
- DOI: http://doi.org/10.4196/kjpp.2019.23.1.71
Abstract
- Body surface potential map, an electric potential distribution on the body torso surface, enables us to infer the electrical activities of the heart. Therefore, observing electric potential projected to the torso surface can be highly useful for diagnosing heart diseases such as coronary occlusion. The BSPM for the heart of a patient show a higher level of sensitivity than 12-lead ECG. Relevant research has been mostly based on clinical statistics obtained from patients, and, therefore, a simulation for a variety of pathological phenomena of the heart is required. In this study, by using computer simulation, a body surface potential map was implemented according to various occlusion locations (distal, mid, proximal occlusion) in the left anterior descending coronary artery. Electrophysiological characteristics of the body surface during the ST segment period were observed and analyzed based on an ST isointegral map. We developed an integrated system that takes into account the cellular to organ levels, and performed simulation regarding the electrophysiological phenomena of the heart that occur during the first 5 minutes (stage 1) and 10 minutes (stage 2) after commencement of coronary occlusion. Subsequently, we calculated the bipolar angle and amplitude of the ST isointegral map, and observed the correlation between the relevant characteristics and the location of coronary occlusion. In the result, in the ventricle model during the stage 1, a wider area of ischemia led to counterclockwise rotation of the bipolar angle; and, during the stage 2, the amplitude increased when the ischemia area exceeded a certain size.
Keyword
MeSH Terms
Figure
-
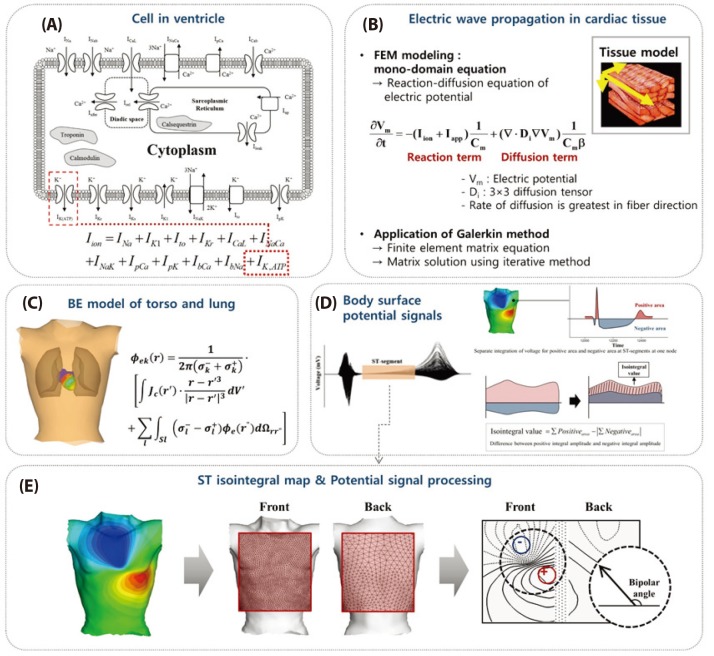
Fig. 1 The integrated schematic for all the process.(A) cell model in the ventricle; (B) electric wave propagation in cardiac tissue; (C) mapping process of the heart electrical potentials onto the torso; (D) integrated membrane voltage value of each ST segment of torso data; (E) slope angle between the maximum and minimum value(bipolar value) on the ST isointegral map.
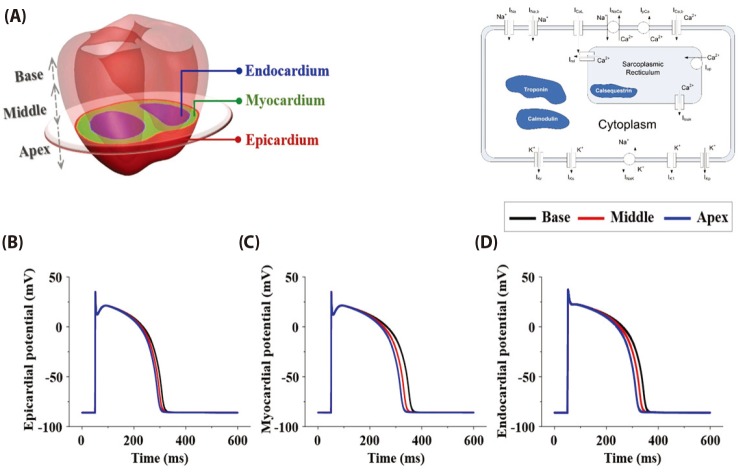
Fig. 2 A human ventricular elec trophysiology cell model.(A) Base, mi ddle and apex segments in ventricle, and epi-, myo-, and endo- cardiac zones in each segments; (B) epicardiac AP, (C) myocardiac AP, (D) endocardiac AP of base, middle, and apex region.
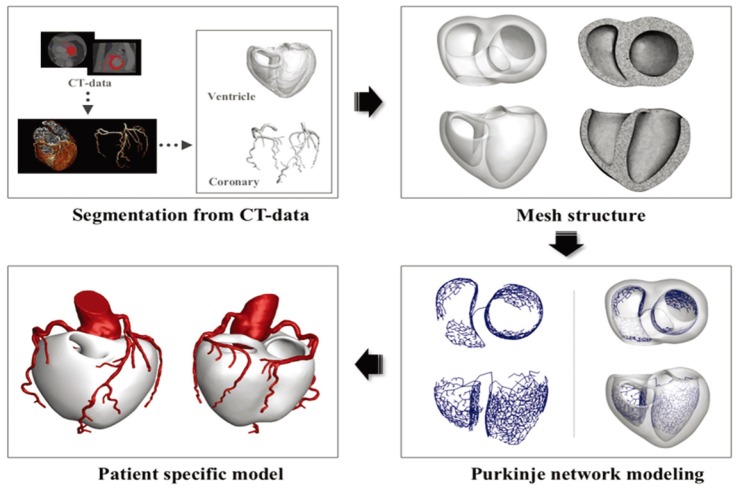
Fig. 3 (A) A patient-specific coronary and ventricle model from CT image data; (B) Mesh generation of ventricle model; (C) purkinje network model; (D) a patient-specific ventricle model with coronary artery.
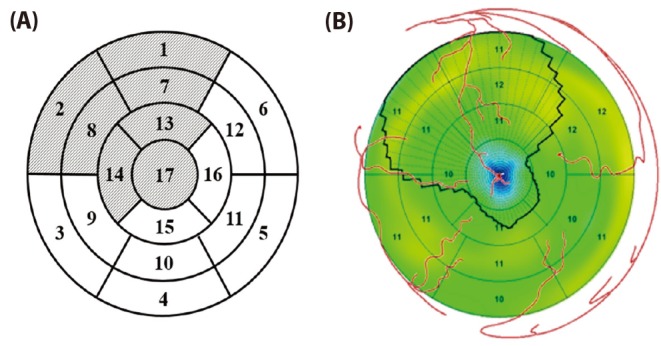
Fig. 4 The ischemia regions determined by 17-segment heart model.(A) Segments attributed to the LAD occlusion in 17-segment heart model and (B) the left ventricular regions attributed to the LAD occlusion in this simulations.
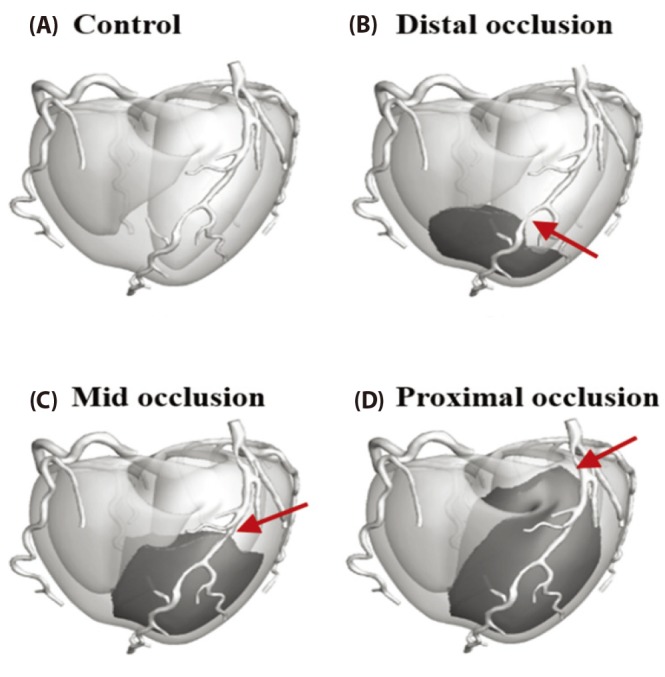
Fig. 5 Ischemic zone in ventricle caused by occlusions in distal, mid, and proximal of LAD.(A) The control model, (B) LAD distal occlusion model, (C) LAD mid occlusion model and (D) LAD proximal occlusion model. The red arrow pointed out the location of coronary occlusion. Dark gray zone is where the ischemic zone attributed to the each coronary occlusion. The ischemic zones in control, distal occlusion model, mid occlusion model, and proximal occlusion model were 0, 12, 24, 36% of the left ventricle.
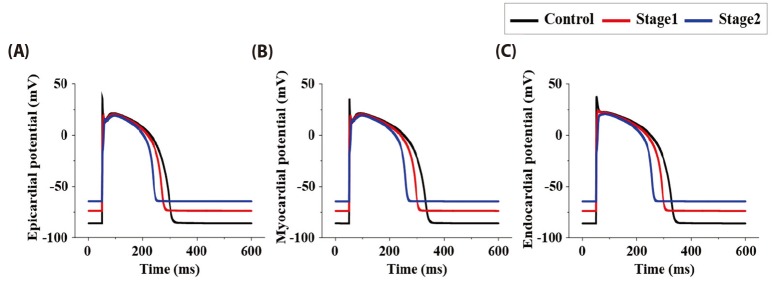
Fig. 6 Cardiac membrane potentials during normal and under ischemic condition.The black line indicates action potential during normal state in control model. The red line indicates action potential in 5 minutes after coronary occlusion. The blue line indicates action potential in 10 minutes after coronary occlusion. (A) epicardiac AP; (B) myocardiac AP; (C) endocardiac AP.
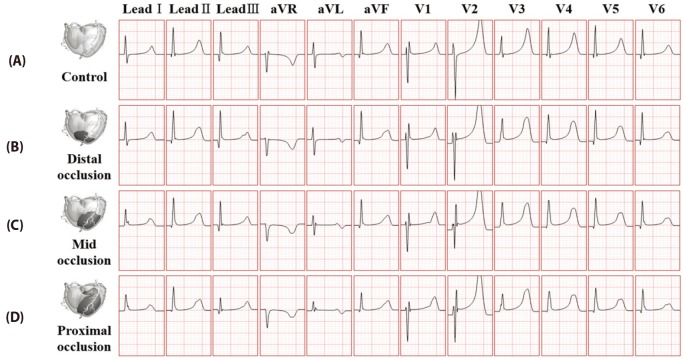
Fig. 7 12-lead ECG in 5 minutes after coronary occlusion.(A) control model without occlusion, (B) ventricular model with distal coronary occlusion, (C) ventricular model with mid coronary occlusion, (D) ventricular model with proximal coronary occlusion.
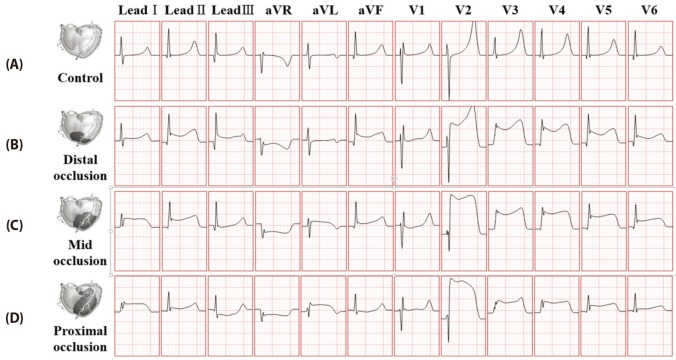
Fig. 8 12-lead ECG waveform in 10 minutes after coronary occlusion.(A) control model without occlusion, (B) ventricular model with distal coronary occlusion, (C) ventricular model with mid coronary occlusion, (D) ventricular model with proximal coronary occlusion.
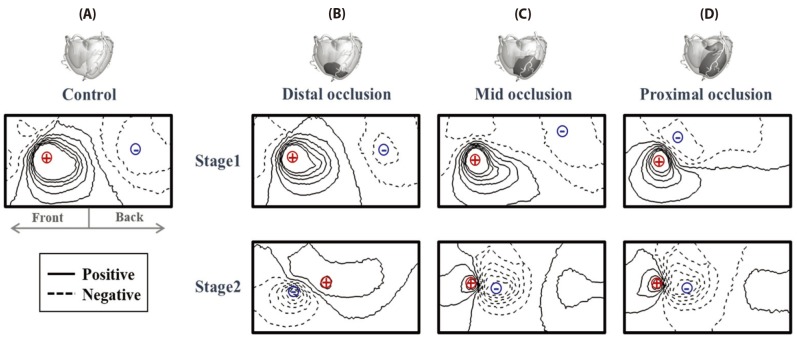
Fig. 9 ST isointegral map by integrating body potential which is relevant to ST segmentation.The solid line and the dotted line indicates the zone with positive isointegral value and with the negative isointegral value, respectively. The red plus sign shows maximum zone, and the blue minus sign shows minimum zone. The left side of isointegral map is on the front and the right side of isointegral map is on the back. Panel (A) control model without occlusion, (B) ventricular model with distal coronary occlusion, (C) ventricular model with mid coronary occlusion, (D) ventricular model with proximal coronary occlusion at stage 1 and stage 2.
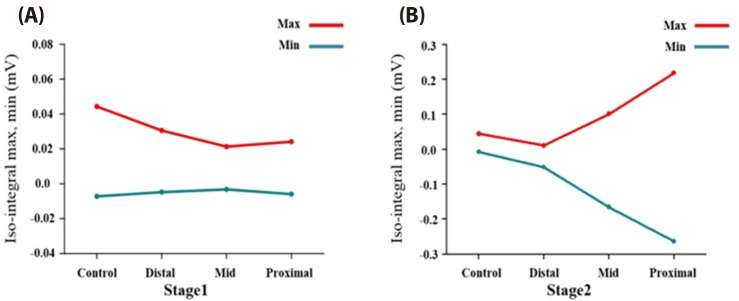
Fig. 10 Maximum and minimum value in ST isointegral map according to the location of coronary occlusion at (A) stage 1 and (B) stage 2.
Reference
-
1. Boe E, Russell K, Eek C, Eriksen M, Remme EW, Smiseth OA, Skulstad H. Non-invasive myocardial work index identifies acute coronary occlusion in patients with non-ST-segment elevation-acute coronary syndrome. Eur Heart J Cardiovasc Imaging. 2015; 16:1247–1255. PMID: 25851329.
Article2. Pursnani A, Lee AM, Mayrhofer T, Ahmed W, Uthamalingam S, Ferencik M, Puchner SB, Bamberg F, Schlett CL, Udelson J, Hoffmann U, Ghoshhajra BB. Early resting myocardial computed tomography perfusion for the detection of acute coronary syndrome in patients with coronary artery disease. Circ Cardiovasc Imaging. 2015; 8:e002404. PMID: 25752898.
Article3. Soneson H, Engblom H, Hedström E, Bouvier F, Sörensson P, Pernow J, Arheden H, Heiberg E. An automatic method for quantification of myocardium at risk from myocardial perfusion SPECT in patients with acute coronary occlusion. J Nucl Cardiol. 2010; 17:831–840. PMID: 20440591.
Article4. Kornreich F, Montague TJ, Rautaharju PM. Body surface potential mapping of ST segment changes in acute myocardial infarction. Implications for ECG enrollment criteria for thrombolytic therapy. Circulation. 1993; 87:773–782. PMID: 8443898.
Article5. Mirvis DM. Current status of body surface electrocardiographic mapping. Circulation. 1987; 75:684–688. PMID: 3549042.
Article6. Ambrose JA, Singh M. Pathophysiology of coronary artery disease leading to acute coronary syndromes. F1000Prime Rep. 2015; 7:08. PMID: 25705391.
Article7. Lafont A. Basic aspects of plaque vulnerability. Heart. 2003; 89:1262–1267. PMID: 12975444.
Article8. Lanza GA, Careri G, Crea F. Mechanisms of coronary artery spasm. Circulation. 2011; 124:1774–1782. PMID: 22007100.
Article9. Shaw RM, Rudy Y. Electrophysiologic effects of acute myocardial ischemia: a theoretical study of altered cell excitability and action potential duration. Cardiovasc Res. 1997; 35:256–272. PMID: 9349389.
Article10. ten Tusscher KH, Noble D, Noble PJ, Panfilov AV. A model for human ventricular tissue. Am J Physiol Heart Circ Physiol. 2004; 286:H1573–H1589. PMID: 14656705.
Article11. Perotti LE, Krishnamoorthi S, Borgstrom NP, Ennis DB, Klug WS. Regional segmentation of ventricular models to achieve repolarization dispersion in cardiac electrophysiology modeling. Int J Numer Method Biomed Eng. 2015; 31(8):DOI: 10.1002/cnm.2718.
Article12. Berenfeld O, Jalife J. Purkinje-muscle reentry as a mechanism of polymorphic ventricular arrhythmias in a 3-dimensional model of the ventricles. Circ Res. 1998; 82:1063–1077. PMID: 9622159.
Article13. Im UB, Kwon SS, Kim K, Lee YH, Park YK, Youn CH, Shim EB. Theoretical analysis of the magnetocardiographic pattern for reentry wave propagation in a three-dimensional human heart model. Prog Biophys Mol Biol. 2008; 96:339–356. PMID: 17919689.14. Potse M, Dubé B, Vinet A. Cardiac anisotropy in boundary-element models for the electrocardiogram. Med Biol Eng Comput. 2009; 47:719–729. PMID: 19306030.
Article15. Hänninen H, Takala P, Rantonen J, Mäkijärvi M, Virtanen K, Nenonen J, Katila T, Toivonen L. ST-T integral and T-wave amplitude in detection of exercise-induced myocardial ischemia evaluated with body surface potential mapping. J Electrocardiol. 2003; 36:89–98.
Article16. Rude RE, Poole WK, Muller JE, Turi Z, Rutherford J, Parker C, Roberts R, Raabe DS Jr, Gold HK, Stone PH, Willerson JT, Braunwald E. Electrocardiographic and clinical criteria for recognition of acute myocardial infarction based on analysis of 3,697 patients. Am J Cardiol. 1983; 52:936–942. PMID: 6356862.
Article17. Kania M, Zaczek R, Zavala-Fernandez H, Janusek D, Kobylecka M, Królicki L, Opolski G, Maniewski R. ST-segment changes in high-resolution body surface potential maps measured during exercise to assess myocardial ischemia: a pilot study. Arch Med Sci. 2014; 10:1086–1090. PMID: 25624843.18. Przyklenk K, Vivaldi MT, Schoen FJ, Malcolm J, Arnold O, Kloner RA. Salvage of ischaemic myocardium by reperfusion: importance of collateral blood flow and myocardial oxygen demand during occlusion. Cardiovasc Res. 1986; 20:403–414. PMID: 3779738.
Article19. Saito Y, Yasuno M, Ishida M, Suzuki K, Matoba Y, Emura M, Takahashi M. Importance of coronary collaterals for restoration of left ventricular function after intracoronary thrombolysis. Am J Cardiol. 1985; 55:1259–1263. PMID: 3993556.
Article20. Guyton AC, Hall JE. Textbook of medical physiology. 11th ed. Philadelphia: Elsevier Saunders;2006.
- Full Text Links
-
- Actions
-
Cited
- CITED
-
- Close
- Share
-
- Similar articles
-
- Aspiration Thromboembolectomy in the Management of Acute Coronary Occlusion during Pertaneous Transluminal Coronary Angioplasty
- Sudden Cardiac Arrest with Acute Myocardial Infarction Induced by Left Subclavian Artery Occlusion in a Patient with Prior Coronary Artery Bypass Surgery
- Clinical and pharmacological application of multiscale multiphysics heart simulator, UT-Heart
- Changes in Coronary Perfusion after Occlusion of Coronary Arteries in Kawasaki Disease
- Current Status of Cardiac CT for Nuclear Medicine Professionals: Coronary Artery Disease Evaluation
