CT Image Conversion among Different Reconstruction Kernels without a Sinogram by Using a Convolutional Neural Network
- Affiliations
-
- 1Department of Radiology and Research Institute of Radiology, University of Ulsan College of Medicine, Asan Medical Center, Seoul, Korea. seojb@amc.seoul.kr
- 2Department of Convergence Medicine, University of Ulsan College of Medicine, Asan Medical Center, Seoul, Korea.
- KMID: 2438260
- DOI: http://doi.org/10.3348/kjr.2018.0249
Abstract
OBJECTIVE
The aim of our study was to develop and validate a convolutional neural network (CNN) architecture to convert CT images reconstructed with one kernel to images with different reconstruction kernels without using a sinogram.
MATERIALS AND METHODS
This retrospective study was approved by the Institutional Review Board. Ten chest CT scans were performed and reconstructed with the B10f, B30f, B50f, and B70f kernels. The dataset was divided into six, two, and two examinations for training, validation, and testing, respectively. We constructed a CNN architecture consisting of six convolutional layers, each with a 3 × 3 kernel with 64 filter banks. Quantitative performance was evaluated using root mean square error (RMSE) values. To validate clinical use, image conversion was conducted on 30 additional chest CT scans reconstructed with the B30f and B50f kernels. The influence of image conversion on emphysema quantification was assessed with Bland-Altman plots.
RESULTS
Our scheme rapidly generated conversion results at the rate of 0.065 s/slice. Substantial reduction in RMSE was observed in the converted images in comparison with the original images with different kernels (mean reduction, 65.7%; range, 29.5-82.2%). The mean emphysema indices for B30f, B50f, converted B30f, and converted B50f were 5.4 ± 7.2%, 15.3 ± 7.2%, 5.9 ± 7.3%, and 16.8 ± 7.5%, respectively. The 95% limits of agreement between B30f and other kernels (B50f and converted B30f) ranged from −14.1% to −2.6% (mean, −8.3%) and −2.3% to 0.7% (mean, −0.8%), respectively.
CONCLUSION
CNN-based CT kernel conversion shows adequate performance with high accuracy and speed, indicating its potential clinical use.
MeSH Terms
Figure
-
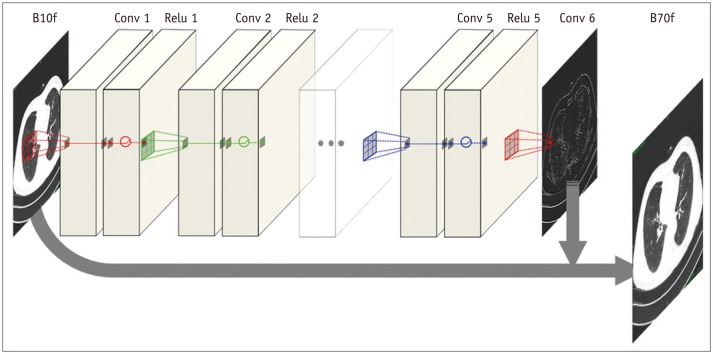
Fig. 1 Architecture of CNN.Proposed CNN architecture consists of six convolutional layers, each with 3 × 3 kernel with 64 filter banks. To maintain original resolution throughout network, we excluded pooling layer in CNN structure and used original matrix size of 512 × 512 for both input and output images. Rectified linear unit was used as activation function at end of each convolutional layer. As we applied concept of residuals, proposed CNN was trained to learn difference between target and input images, and final image was obtained by adding residual image (output) to input. CNN = convolutional neural network
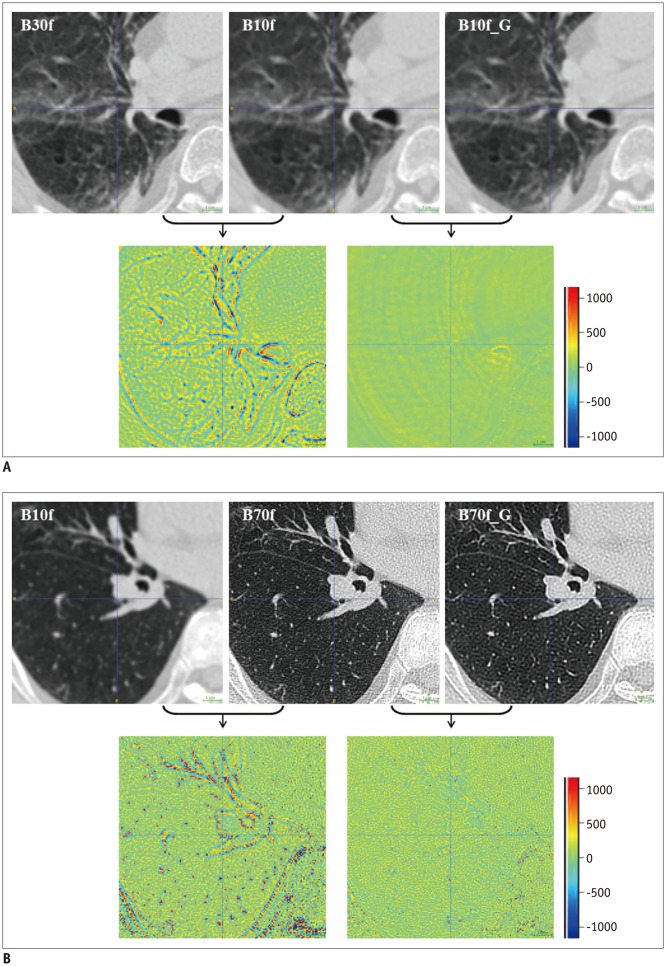
Fig. 2 Comparisons of original and converted CT images using CNN.Input image, ground-truth image, and converted image are presented on upper panel, and difference images are located on bottom panel. In difference image, green indicates zero, blue represents negative values, and red indicates positive values.A. Pronounced differences between B10f and B30f images mostly disappeared after applying proposed conversion scheme (RMSE from 16.95 HU to 3.12 HU). B. Similar results were observed in kernel conversion from B10f to B70f (RMSE from 149.06 HU to 99.21 HU). However, speckled error regions remained owing to difficulties in kernel conversion from B10f to B70f and high signal-to-noise ratio in B70f. HU = Hounsfield unit, RMSE = root mean square error
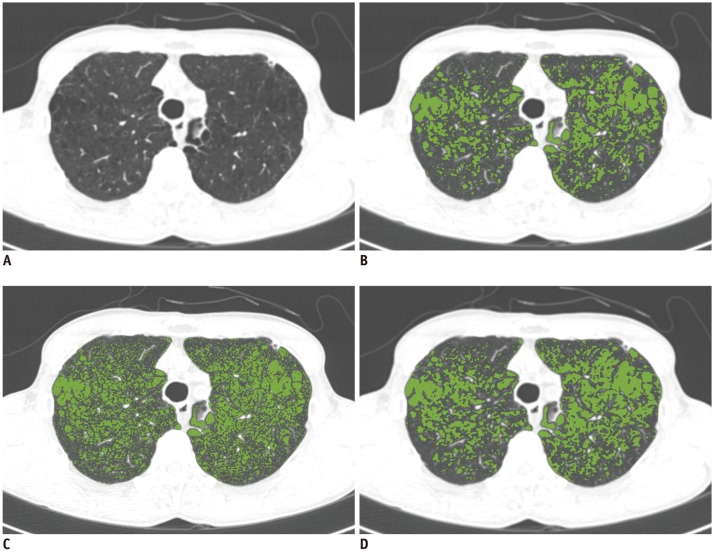
Fig. 3 Influence of kernels on EI.EI was calculated from CT images reconstructed using different kernels in 72-year-old male [(A): B30f]. Results for EI were 9.9% in B30f kernel image (B), 20.2% in B50f kernel image (C), and 12.1% in converted B30f kernel image (D). EI = emphysema index
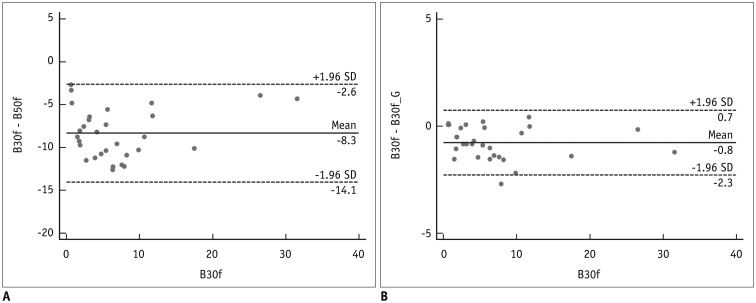
Fig. 4 Bland-Altman plots showing association between B30f and other kernels (B50f and converted B30f).A, B. Graphs showing differences between B30f and other kernels (B50f and converted B30f). X-axis represents EI in B30f, and Y-axis represents differences in EI between B30f and other kernels. (A) B30f and B50f and (B) B30f and converted B30f. 95% limits of agreements ranged from −14.1% to −2.6% (mean, −8.3%) and from −2.3% to 0.7% (mean, −0.8%), respectively. SD = standard deviation
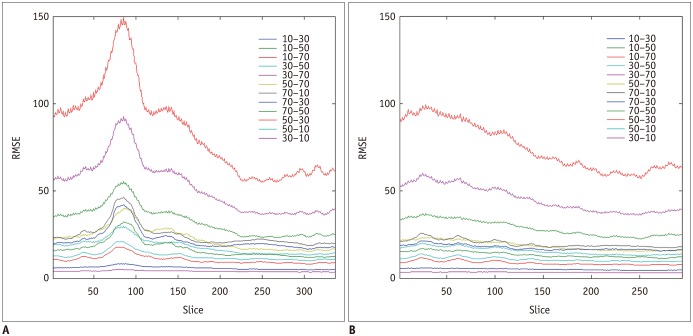
Fig. 5 Changes in RMSE along z axis.A, B. Graphs showing differences in RMSE between original image and converted images along z axis in Test 1 and Test 2. There was trend of increase from upper to lower thorax.
Reference
-
1. Schaller S, Wildberger JE, Raupach R, Niethammer M, Klingenbeck-Regn K, Flohr T. Spatial domain filtering for fast modification of the tradeoff between image sharpness and pixel noise in computed tomography. IEEE Trans Med Imaging. 2003; 22:846–853. PMID: 12906238.
Article2. Boedeker KL, McNitt-Gray MF, Rogers SR, Truong DA, Brown MS, Gjertson DW, et al. Emphysema: effect of reconstruction algorithm on CT imaging measures. Radiology. 2004; 232:295–301. PMID: 15220511.
Article3. Behrendt FF, Das M, Mahnken AH, Kraus T, Bakai A, Stanzel S, et al. Computer-aided measurements of pulmonary emphysema in chest multidetector-row spiral computed tomography: effect of image reconstruction parameters. J Comput Assist Tomogr. 2008; 32:899–904. PMID: 19204452.4. Wang Y, de Bock GH, van Klaveren RJ, van Ooyen P, Tukker W, Zhao Y, et al. Volumetric measurement of pulmonary nodules at low-dose chest CT: effect of reconstruction setting on measurement variability. Eur Radiol. 2010; 20:1180–1187. PMID: 19921204.
Article5. Weiss KL, Cornelius RS, Greeley AL, Sun D, Chang IY, Boyce WO, et al. Hybrid convolution kernel: optimized CT of the head, neck, and spine. AJR Am J Roentgenol. 2011; 196:403–406. PMID: 21257893.
Article6. Wildberger JE, Mahnken AH, Flohr T, Raupach R, Weiss C, Günther RW, et al. Spatial domain image filtering in computed tomography: feasibility study in pulmonary embolism. Eur Radiol. 2003; 13:717–723. PMID: 12664108.
Article7. Lapp RM, Kyriakou Y, Kachelriess M, Wilharm S, Kalender WA. Interactively variable isotropic resolution in computed tomography. Phys Med Biol. 2008; 53:2693–2713. PMID: 18445875.
Article8. Ohkubo M, Wada S, Kayugawa A, Matsumoto T, Murao K. Image filtering as an alternative to the application of a different reconstruction kernel in CT imaging: feasibility study in lung cancer screening. Med Phys. 2011; 38:3915–3923. PMID: 21858988.
Article9. Gallardo-Estrella L, Lynch DA, Prokop M, Stinson D, Zach J, Judy PF, et al. Normalizing computed tomography data reconstructed with different filter kernels: effect on emphysema quantification. Eur Radiol. 2016; 26:478–486. PMID: 26002132.
Article10. Kim J, Lee JK, Lee KM. Accurate image super-resolution using very deep convolutional networks. In : 2016 The IEEE Conference on Computer Vision and Pattern Recognition (CVPR); 2016 June 27-30; Las Vegas, NV, USA. p. 1646–1654.11. Haruna A, Muro S, Nakano Y, Ohara T, Hoshino Y, Ogawa E, et al. CT scan findings of emphysema predict mortality in COPD. Chest. 2010; 138:635–640. PMID: 20382712.
Article12. Han MK, Kazerooni EA, Lynch DA, Liu LX, Murray S, Curtis JL, et al. COPDGene Investigators. Chronic obstructive pulmonary disease exacerbations in the COPDGene study: associated radiologic phenotypes. Radiology. 2011; 261:274–282. PMID: 21788524.
Article13. Lee YK, Oh YM, Lee JH, Kim EK, Lee JH, Kim N, et al. KOLD Study Group. Quantitative assessment of emphysema, air trapping, and airway thickening on computed tomography. Lung. 2008; 186:157–165. PMID: 18351420.
Article14. Schroeder JD, McKenzie AS, Zach JA, Wilson CG, Curran-Everett D, Stinson DS, et al. Relationships between airflow obstruction and quantitative CT measurements of emphysema, air trapping, and airways in subjects with and without chronic obstructive pulmonary disease. AJR Am J Roentgenol. 2013; 201:W460–W470. PMID: 23971478.
Article
- Full Text Links
-
- Actions
-
Cited
- CITED
-
- Close
- Share
-
- Similar articles
-
- Convolutional Neural Network Based Sinogram Extrapolation for Truncated CT: Preliminary Study
- MTF Evaluation and Clinical Application according to the Characteristic Kernels in the Computed Tomography
- Improvement of Analytic Reconstruction Algorithms Using a Sinogram Interpolation Method for Sparse-angular Sampling with a Photon-counting Detector
- Compensation Methods for Non-uniform and Incomplete Data Sampling in High Resolution PET with Multiple Scintillation Crystal Layers
- Gastrointestinal polyp detection in endoscopic images using an improved feature extraction method
