Transl Clin Pharmacol.
2018 Mar;26(1):39-47. 10.12793/tcp.2018.26.1.39.
Comparison of various estimation methods for the parameters of Michaelis-Menten equation based on in vitro elimination kinetic simulation data
- Affiliations
-
- 1Department of Clinical Pharmacology and Therapeutics, Asan Medical Center, University of Ulsan, Seoul 05505, Republic of Korea. mdhslim@gmail.com
- KMID: 2420306
- DOI: http://doi.org/10.12793/tcp.2018.26.1.39
Abstract
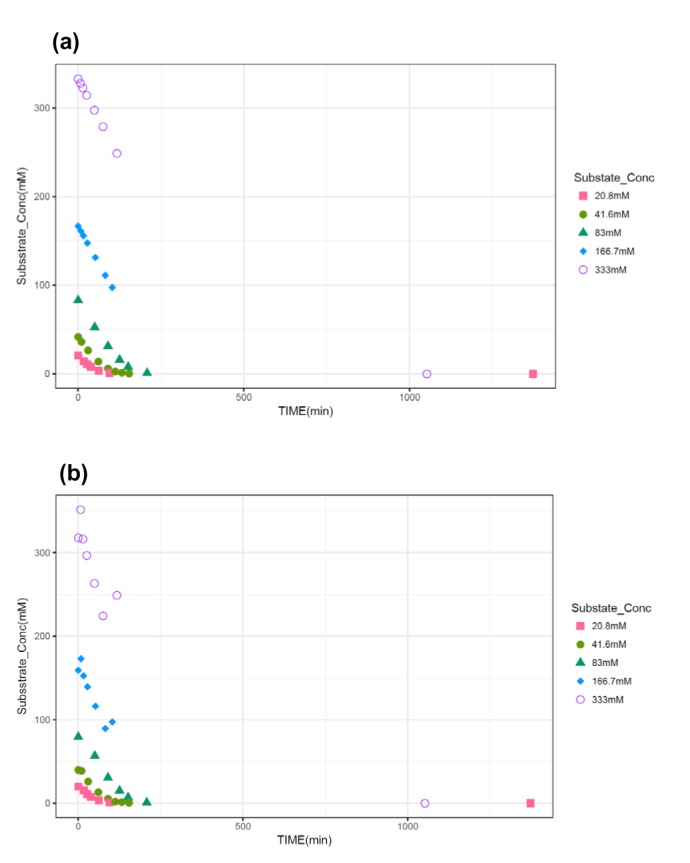
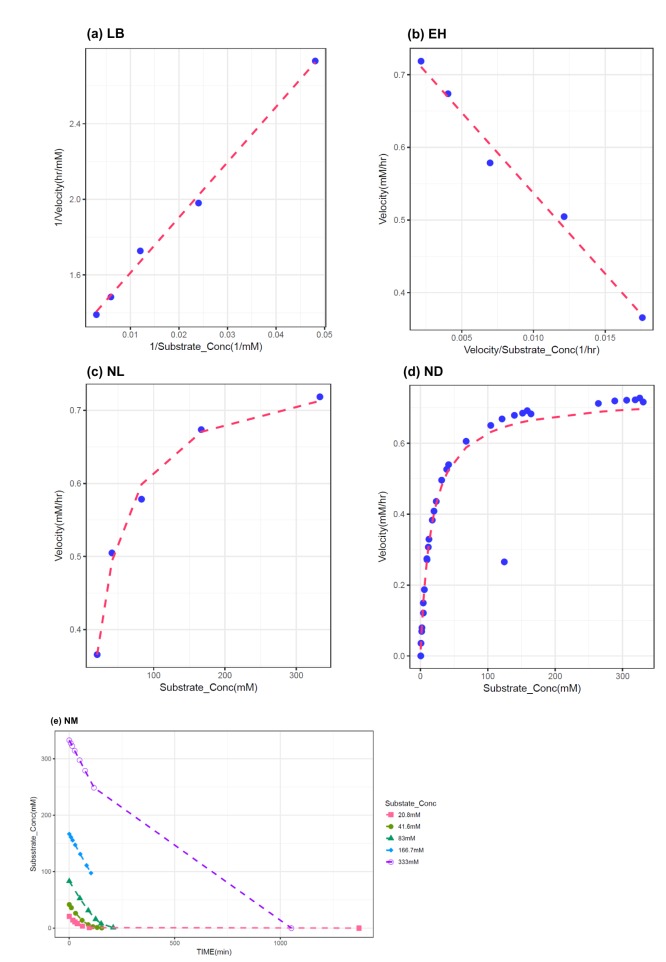
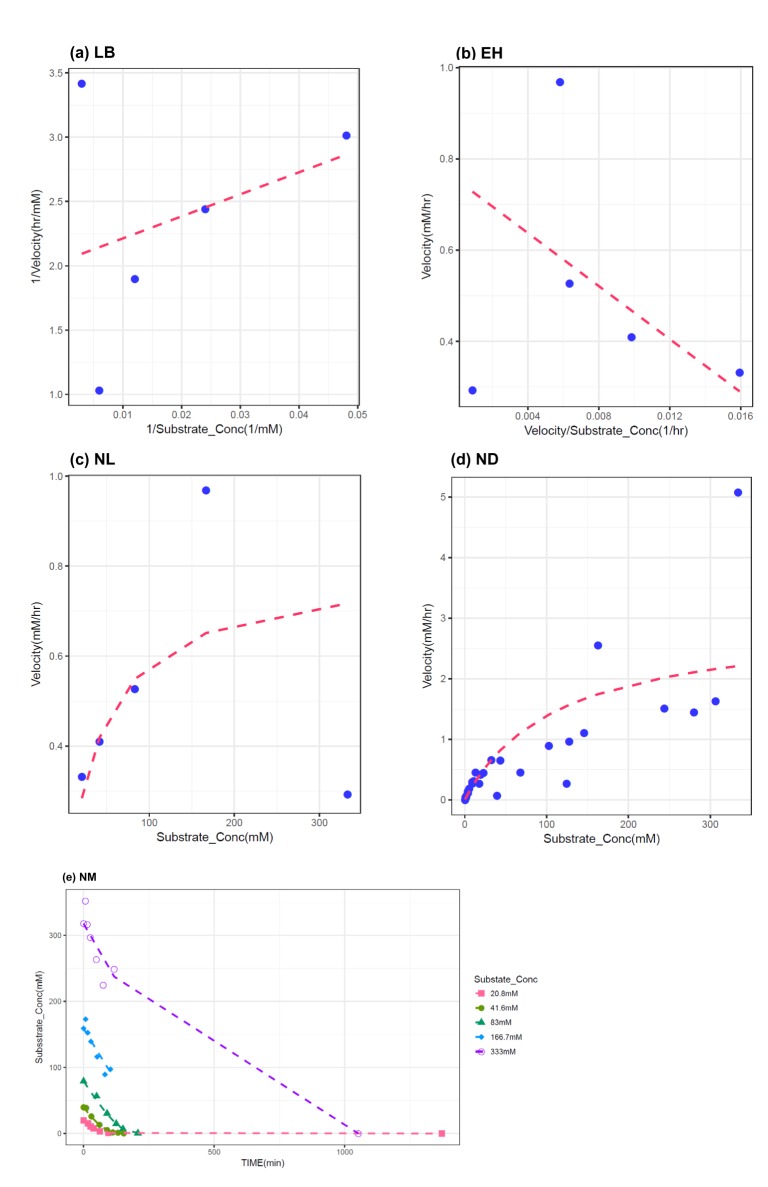
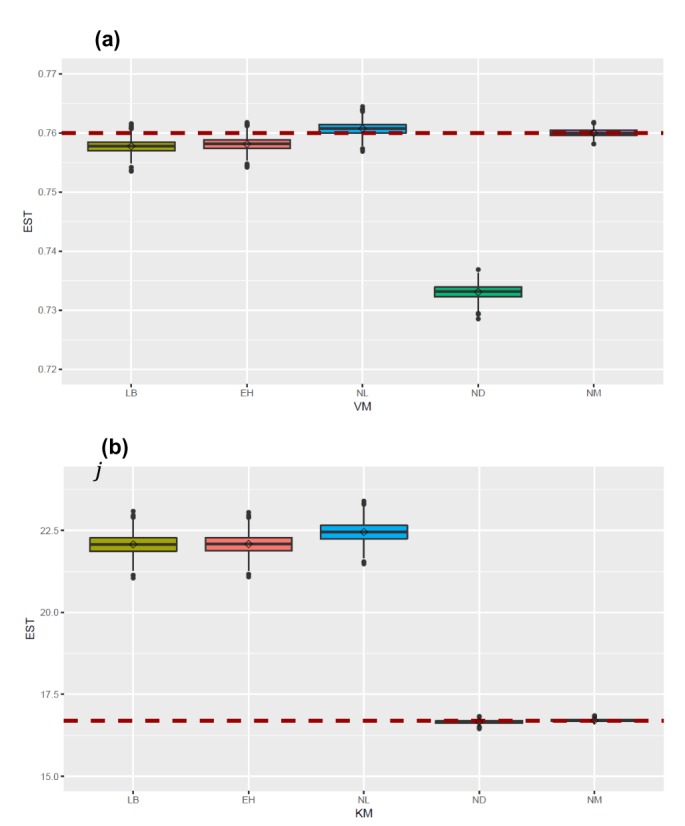
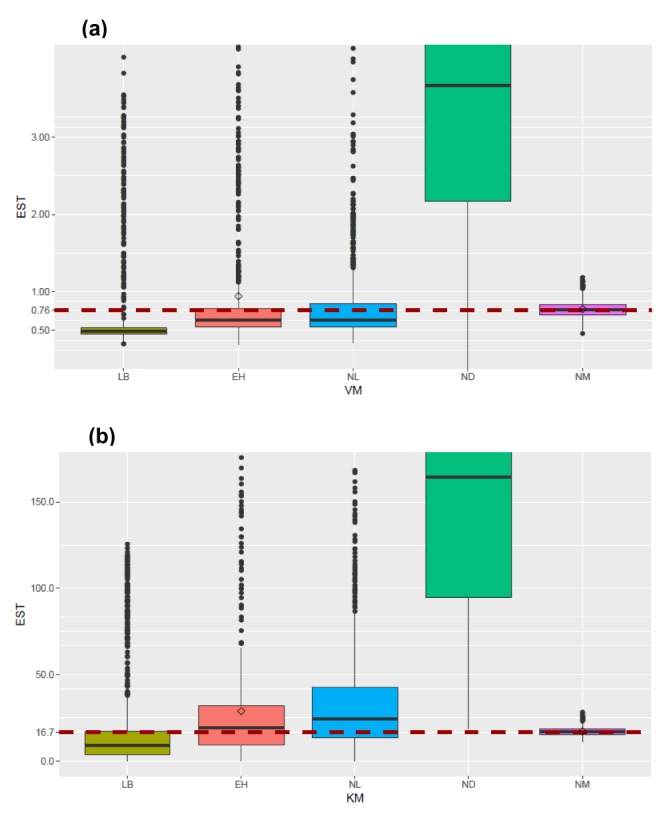
- The Michaelis-Menten equation is one of the best-known models describing the enzyme kinetics of in vitro drug elimination experiments, and takes a form of equation relating reaction rate (V) to the substrate concentration ([S]) via the maximum reaction rate (Vmax) and the Michaelis constant (Km). The current study was conducted to compare the accuracy and precision of the parameter estimates in the Michaelis-Menten equation from various estimation methods using simulated data. One thousand replicates of simulated [S] over serial time data were generated using the results of a previous study, incorporating additive or combined error models as a source of random variables in the Monte-Carlo simulation using R. From each replicate of simulated data, Vmax and Km were estimated by five different methods, including traditional linearization methods and nonlinear ones without linearization using NONMEM. The relative accuracy and precision of the estimated parameters were compared by the median values and their 90% confidence intervals. Overall, Vmax and Km estimation by nonlinear methods (NM) provided the most accurate and precise results from the tested 5 estimation methods. The superiority of parameter estimation by NM was even more evident in the simulated data incorporating the combined error model. The current simulation study suggests that NMs using a program such as NONMEM provide more reliable and accurate parameter estimates of the Michaelis-Menten equation than traditional linearization methods in in vitro drug elimination kinetic experiments.
Keyword
MeSH Terms
Figure
Reference
-
1. Michaelis L, Menten ML, Johnson KA, Goody RS. The original Michaelis constant: translation of the 1913 Michaelis-Menten paper. Biochemistry. 2011; 50:8264–8269. DOI: 10.1021/bi201284u. PMID: 21888353.
Article2. Cornish-Bowden A. The origins of enzyme kinetics. FEBS Lett. 2013; 587:2725–2730. DOI: 10.1016/j.febslet.2013.06.009. PMID: 23791665.
Article3. Johnson KA, Simpson ZB, Blom T. Global kinetic explorer: a new computer program for dynamic simulation and fitting of kinetic data. Anal Biochem. 2009; 387:20–29. DOI: 10.1016/j.ab.2008.12.024. PMID: 19154726.
Article4. Kuzmic P. Program DYNAFIT for the analysis of enzyme kinetic data: application to HIV proteinase. Anal Biochem. 1996; 237:260–273. PMID: 8660575.5. Barshop BA, Wrenn RF, Frieden C. Analysis of numerical methods for computer simulation of kinetic processes: development of KINSIM--a flexible, portable system. Anal Biochem. 1983; 130:134–145. PMID: 6688159.
Article6. Cornish-Bowden A. Fundamentals of Enzyme Kinetics. 4th ed. Wiley-Blackwell: New York;2012. p. 16–38.7. Fersht AR. Structure and mechanism in protein science. New York: W. H. Freedman;1999. p. 108–110.8. Johnson KA. A century of enzyme kinetic analysis, 1913 to 2013. FEBS Lett. 2013; 587:2753–2766. DOI: 10.1016/j.febslet.2013.07.012. PMID: 23850893.
Article9. Bae KS, Yim DS. R-based reproduction of the estimation process hidden behind NONMEM® Part 2: First-order conditional estimation. Transl Clin Pharmacol. 2016; 24:161–168.
Article10. Hofstee BH. Non-inverted versus inverted plots in enzyme kinetics. Nature. 1959; 184:1296–1298. PMID: 14402470.
Article11. Nelatury SR, Nelatury CF, Vagula MC. Parameter Estimation in Different Enzyme Reactions. Adv Enzyme Res. 2014; 2:14–26. DOI: 10.4236/aer.2014.21002.
Article12. Kemmer G, Keller S. Nonlinear least-squares data fitting in Excel spreadsheets. Nat Protoc. 2010; 5:267–281. DOI: 10.1038/nprot.2009.182. PMID: 20134427.
Article13. Page A. A non-linear regression program in BASIC for estimating Km and Vmax. Comput Appl Biosci. 1987; 3:49–51. PMID: 3453214.
Article14. Marszalek J, Kostrowicki J, Spychala J. LEHM: a convenient non-linear regression microcomputer prog ram for fitting Michaelis-Menten and Hill models to enzyme kinetic data. Comput Appl Biosci. 1989; 5:239–240. PMID: 2766012.
- Full Text Links
- Actions
-
Cited
- CITED
-
- Close
- Share
- Similar articles
-
- Erratum: Comparison of various estimation methods for the parameters of Michaelis-Menten equation based on in vitro elimination kinetic simulation data
- The Clinical Study on the Predictability of Time from Toxic Level to Therapeutic Concentration on Phenytoin Toxicity
- Estimation and simulation of kinetic-pharmacodynamic parameters of rocuronium by Bragg's dose-response-time model
- Assessing the impact of recombination on the estimation of isolation-with-migration models using genomic data: a simulation study
- Efficacy of Simulation-based Learning for Improving the Accuracy of Blood Loss Estimation in Postpartum Hemorrhage

