Investig Magn Reson Imaging.
2017 Sep;21(3):171-176. 10.13104/imri.2017.21.3.171.
Quantification of Gadolinium Concentration Using GRE and UTE Sequences
- Affiliations
-
- 1Department of Radiology, Seoul St. Mary's Hospital, College of Medicine, The Catholic University of Korea, Seoul, Korea. hschoi@catholic.ac.kr
- 2Bayer Korea, Seoul, Korea.
- KMID: 2392688
- DOI: http://doi.org/10.13104/imri.2017.21.3.171
Abstract
- PURPOSE
To compare different MR sequences for quantification of gadolinium concentration.
MATERIALS AND METHODS
Gadolinium contrast agents were diluted into 36 different concentrations. They were scanned using gradient echo (GRE) and ultrashort echo time (UTE) and R1, R2* and phase values were estimated from collected data. For analysis, ROI masks were made for each concentration and then ROI value was measured by mean and standard deviation from the estimated quantitative maps. Correlation analysis was performed and correlation coefficient was calculated.
RESULTS
Using GRE sequence, R1 showed a strong linear correlation at concentrations of 10 mM or less, and R2* showed a strong linear correlation between 10 to 100 mM. The phase of GRE generally exhibited a negative linear relationship for concentrations of 100 mM or less. In the case of UTE, the phase had a strong negative linear relationship at concentrations 100 mM or above.
CONCLUSION
R1, which was calculated by conventional GRE, showed a high performance of quantification for lower concentrations, with a correlation coefficient of 0.966 (10 mM or less). R2* showed stronger potential for higher concentrations with a correlation coefficient of 0.984 (10 to 100 mM), and UTE phase showed potential for even higher concentrations with a correlation coefficient of 0.992 (100 mM or above).
Keyword
Figure
-
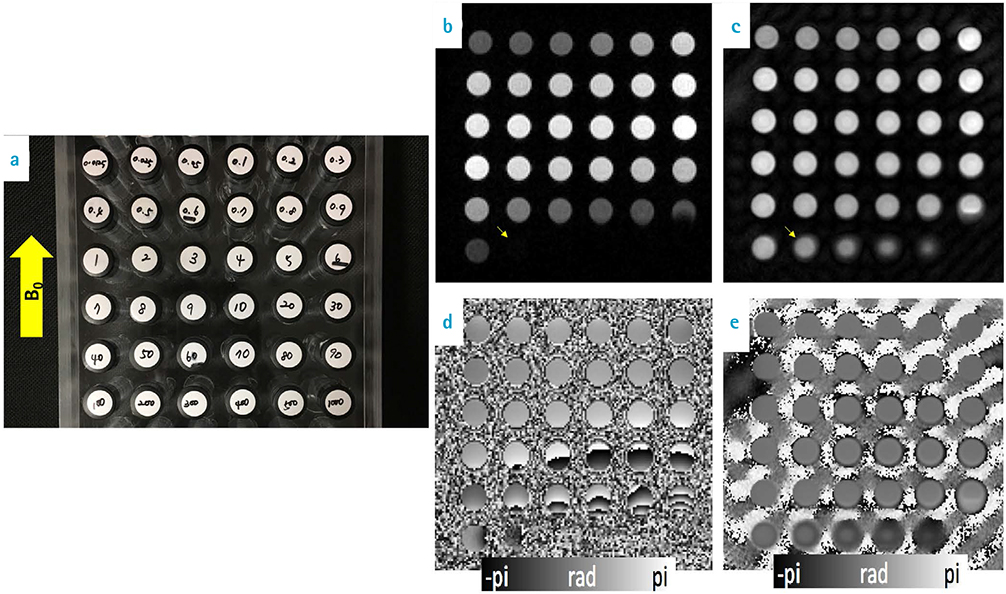
Fig. 1 Phantom and representative MR images. (a) gadolinium phantom (concentration presented by mM), (b) GRE magnitude image, (c) UTE magnitude image, (d) GRE phase image, (e) UTE phase image.
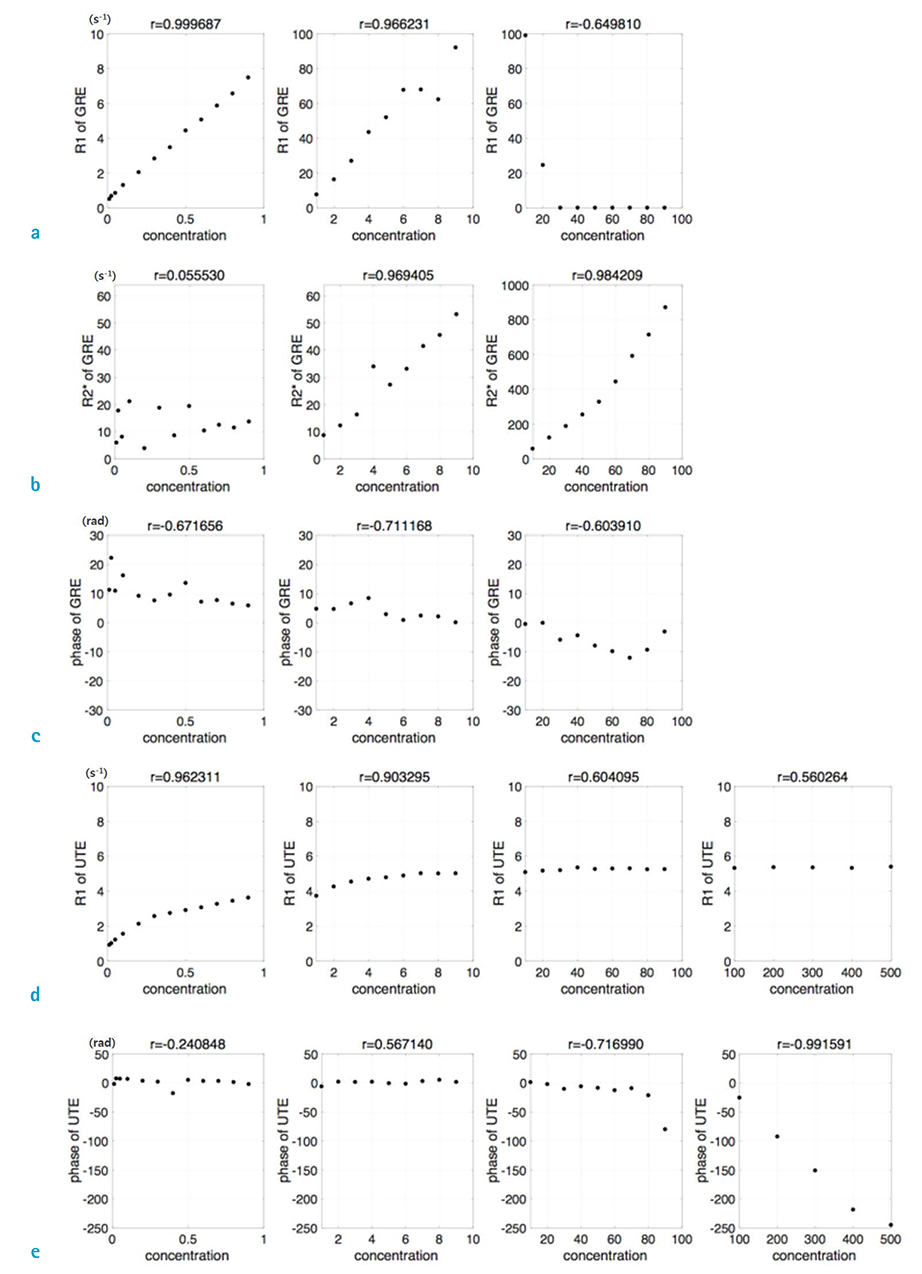
Fig. 2 The estimated R1, R2* and phase values for different concentrations of gadolinium contrast agents.
Cited by 1 articles
-
Efficient Experimental Design for Measuring Magnetic Susceptibility of Arbitrarily Shaped Materials by MRI
Seon-ha Hwang, Seung-Kyun Lee
Investig Magn Reson Imaging. 2018;22(3):141-149. doi: 10.13104/imri.2018.22.3.141.
Reference
-
1. Padhani AR, Husband JE. Dynamic contrast-enhanced MRI studies in oncology with an emphasis on quantification, validation and human studies. Clin Radiol. 2001; 56:607–620.2. Kuo PH, Kanal E, Abu-Alfa AK, Cowper SE. Gadolinium-based MR contrast agents and nephrogenic systemic fibrosis. Radiology. 2007; 242:647–649.3. Kanda T, Fukusato T, Matsuda M, et al. Gadolinium-based contrast agent accumulates in the brain Even in subjects without severe renal dysfunction: evaluation of autopsy brain specimens with inductively coupled plasma mass spectroscopy. Radiology. 2015; 276:228–232.4. Caravan P. Strategies for increasing the sensitivity of gadolinium based MRI contrast agents. Chem Soc Rev. 2006; 35:512–523.5. Trattnig S, Marlovits S, Gebetsroither S, et al. Three--dimensional delayed gadolinium-enhanced MRI of cartilage (dGEMRIC) for in vivo evaluation of reparative cartilage after matrix-associated autologous chondrocyte transplantation at 3.0T: Preliminary results. J Magn Reson Imaging. 2007; 26:974–998.6. Sasaki M, Shibata E, Kanbara Y, Ehara S. Enhancement effects and relaxivities of gadolinium-DTPA at 1.5 versus 3 Tesla: a phantom study. Magn Reson Med Sci. 2005; 4:145–149.7. Robson MD, Gatehouse PD, Bydder M, Bydder GM. Magnetic resonance: an introduction to ultrashort TE (UTE) imaging. J Comput Assist Tomogr. 2003; 27:825–846.8. Hittmair K, Gomiscek G, Langenberger K, Recht M, Imhof H, Kramer J. Method for the quantitative assessment of contrast agent uptake in dynamic contrast-enhanced MRI. Magn Reson Med. 1994; 31:567–571.9. Li W, Avram AV, Wu B, Xiao X, Liu C. Integrated Laplacian-based phase unwrapping and background phase removal for quantitative susceptibility mapping. NMR Biomed. 2014; 27:219–227.10. Poselt E, Kloust H, Tromsdorf U, et al. Relaxivity optimization of a PEGylated iron-oxide-based negative magnetic resonance contrast agent for T(2)-weighted spin-echo imaging. ACS Nano. 2012; 6:1619–1624.11. Sosnovik DE, Nahrendorf M, Weissleder R. Magnetic nanoparticles for MR imaging: agents, techniques and cardiovascular applications. Basic Res Cardiol. 2008; 103:122–130.
- Full Text Links
-
- Actions
-
Cited
- CITED
-
- Close
- Share
-
- Similar articles
-
- Advanced Cardiac MR Imaging for Myocardial Characterization and Quantification: T1 Mapping
- Generating Motion- and Distortion-Free Local Field Map Using 3D Ultrashort TE MRI: Comparison with Tâ‚‚* Mapping
- T1-weighted MR Imaging of the Neonatal Brain at 3.0 Tesla: Comparison of Spin Echo, Fast Inversion Recovery, and Magnetization-prepared Three Dimensional Gradient Echo Techniques
- Ultrashort Echo Time and Zero Echo Time MRI and Their Applications at High Magnetic Fields: A Literature Survey
- The Added Value of Double Dose Gadolinium Enhanced 3D T2 Fluid-Attenuated Inversion Recovery for Evaluating Small Brain Metastases
