Sirolimus and Metformin Synergistically Inhibits Colon Cancer In Vitro and In Vivo
- Affiliations
-
- 1Department of Surgery, Seoul National University College of Medicine, Seoul, Korea. kwleegs@gmail.com
- 2Department of General Surgery, Astana City Hospital #1, Astana, Kazakhstan.
- KMID: 2385943
- DOI: http://doi.org/10.3346/jkms.2017.32.9.1385
Abstract
- We estimated the effect of various immunosuppressants (ISs) and metformin (M) to provide theoretical background of optimal therapeutic strategy for de novo colon cancer after liver transplantation (LT). Three colon cancer cell lines (HT29, SW620, and HCT116) were used in in vitro studies. HT29 was also used in BALB/c-nude mice animal models. Following groups were used in both in vitro and in vivo studies: sirolimus (S), tacrolimus (T), cyclosporin A (CsA), M, metformin/sirolimus (Met/S), metformin/tacrolimus (Met/T), and metformin/cyclosporin A (Met/CsA). 3-(4,5-Dimethylthiazol-2-yl)-2,5-diphenyltetrazolium bromide (MTT) assay was performed and western blot analyses were performed for mTOR pathway proteins, apoptosis proteins, and epithelial-mesenchymal-transition (EMT) proteins. Tumor volume was measured for 4 weeks after inoculation. MTT-assay revealed significant cell viability inhibition in all 3 colon cancer cell lines in groups of S, M, and Met/S. Of note, group Met/S showed synergistic effect compare to M or S group. Western blot analysis showed significant low levels of all investigated proteins in groups of S and Met/S in both in vitro and in vivo experiment. Tumor growth was significantly inhibited only in the Met/S group. Combination of Met and S showed the most potent inhibition in all colon cancer cell lines. This finding might have application for de novo colon cancer.
MeSH Terms
Figure
-

Fig. 1 Measurement of tumor size. (A) Approximate tumor size in BALB/C nude animal models was calculated using the following formula: length (L) × width (W)2 × 0.5. Changes of tumors volume in experimental models. Data are representatives of in vivo experiment. (B) BALB/c nude mice with dissected tumors. (C) The sizes of tumors during 3 weeks of growth; On week 1, week 2, and week 3, the tumor volume in group of M + S showed significant reduction compare to that in the control group. Among lonely used regimens, the most potent one was S. CTL = control, S = sirolimus, T = tacrolimus, CsA = cyclosporin A, M = metformin, Met/S = metformin/sirolimus, Met/T = metformin/tacrolimus, Met/CsA = metformin/cyclosporine A. *P < 0.05 compared to control.
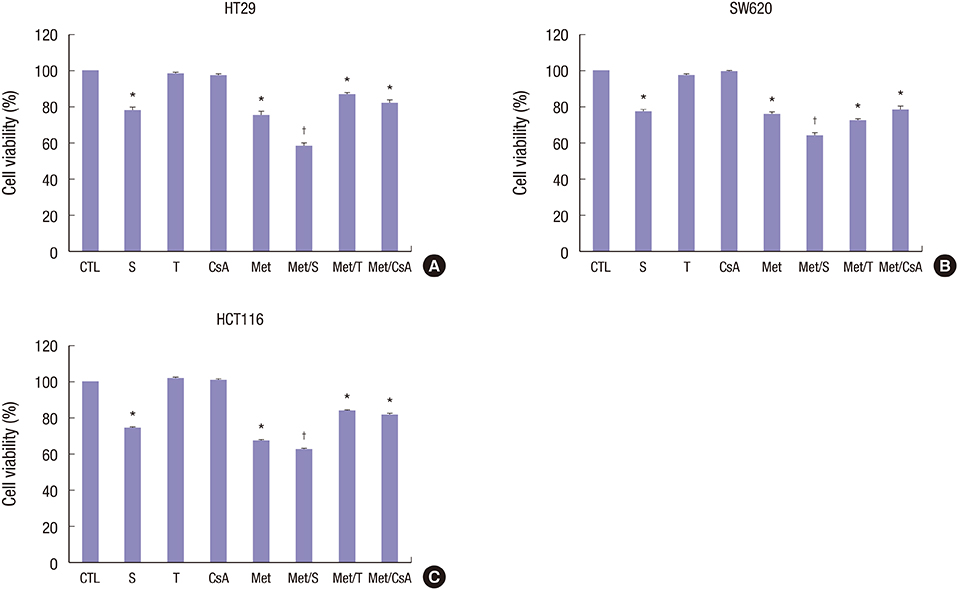
Fig. 2 Cell viabilities of HT29, SW620, and HCT116 cell lines after treatment. After 48 hours of incubation, cytotoxicity was analyzed by MTT assay. Percentages of cell viability were decreased in S and M treated groups in HT29 (A), SW620 (B), and HCT116 (C) cell lines. Of note, the combination of M and S appeared to have significant cell-suppressive effect, achieving significantly lower viability than S or M alone. No changes in cytotoxicity profile after treatment with T or CsA alone were observed in any of the 3 colon cancer cell lines. Data are expressed as mean ± SD. Data are representatives of 3 separate experiments. MTT = 3-(4,5-dimethylthiazol-2-yl)-2,5-diphenyltetrazolium bromide, CTL = control, S = sirolimus, T = tacrolimus, CsA = cyclosporin A, M = metformin, Met/S = metformin/sirolimus, Met/T = metformin/tacrolimus; Met/CsA = metformin/cyclosporin A, SD = standard deviation. *P < 0.05 compared to control group; †P < 0.05 compared to S, M.
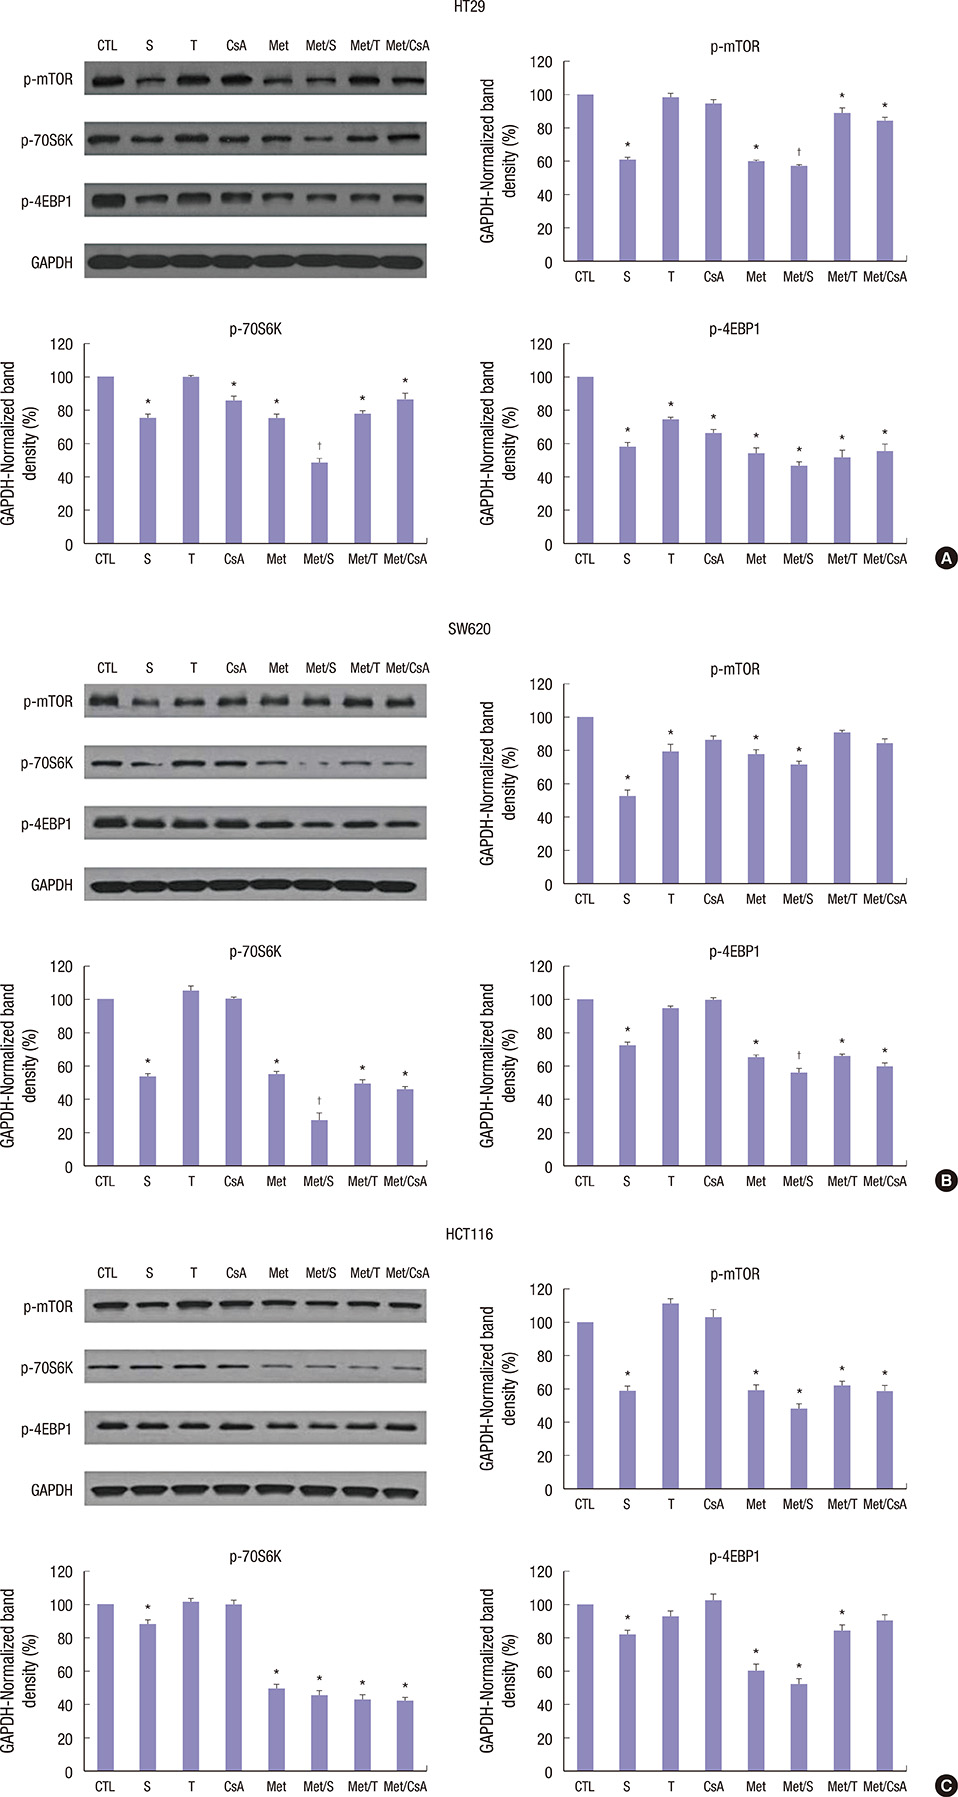
Fig. 3 Western blot analyses of proteins associated with mTOR signalling pathway. Representative Western blots and densitometric quantitative results of p-mTOR, p-70S6K, and p-4EBP1 protein expression in HT29 (A), SW620 (B), and HCT116 (C) cells after 48 hours of treatment. M and S treatment alone and the combination of Met/S significantly down-regulated p-mTOR, p-70S6K, and p-4EBP1 protein expression levels. T and CsA alone showed no such effect. GAPDH was used to show equal protein loading. Data are expressed as mean ± SD. Data are representatives of 3 separate experiments. CTL = control, S = sirolimus, T = tacrolimus, CsA = cyclosporin A, M = metformin, Met/S = metformin/sirolimus, Met/T = metfosrmin/tacrolimus, Met/CsA = metformin/cyclosporin A, GAPDH = glyceraldehyde 3-phosphate dehydrogenase, SD = standard deviation. *P < 0.05 compared to control group; †P < 0.05 compared to S, M.
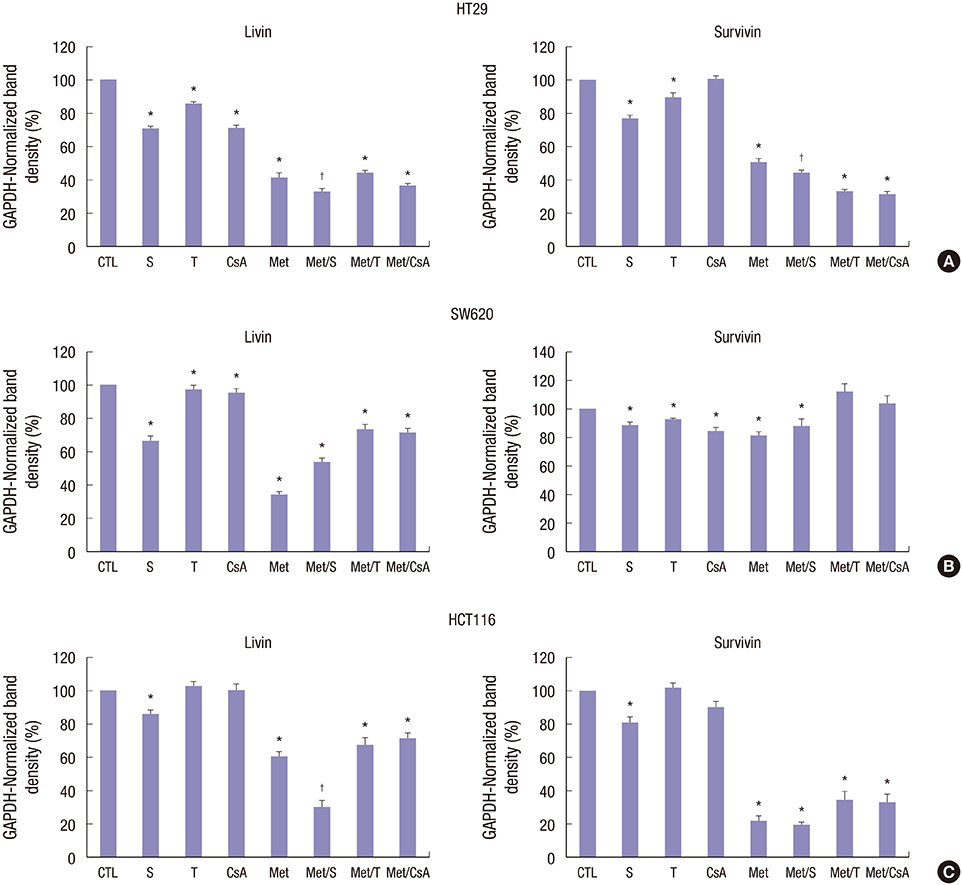
Fig. 4 Changes in the expression of apoptosis-related proteins in HT29, SW620, and HCT116 cells lines. M and S synergistically downregulated livin and survivin expression levels in HT29 (A), SW620 (B), and HCT116 (C) cells after 48 hours of incubation. Unlike M or S, T and CsA failed to alter the expression level of livin or survivin in HCT116 cell lines. Data are expressed as mean ± SD. Data are representatives of 3 separate experiments. CTL = control, S = sirolimus, T = tacrolimus, CsA = cyclosporin A, M = metformin, Met/S = metformin/sirolimus, Met/T = metformin/tacrolimus, Met/CsA = metformin/cyclosporin A, SD = standard deviation, GAPDH = glyceraldehyde 3-phosphate dehydrogenase. *P < 0.05 compared to control group; †P < 0.05 compared to S, M.
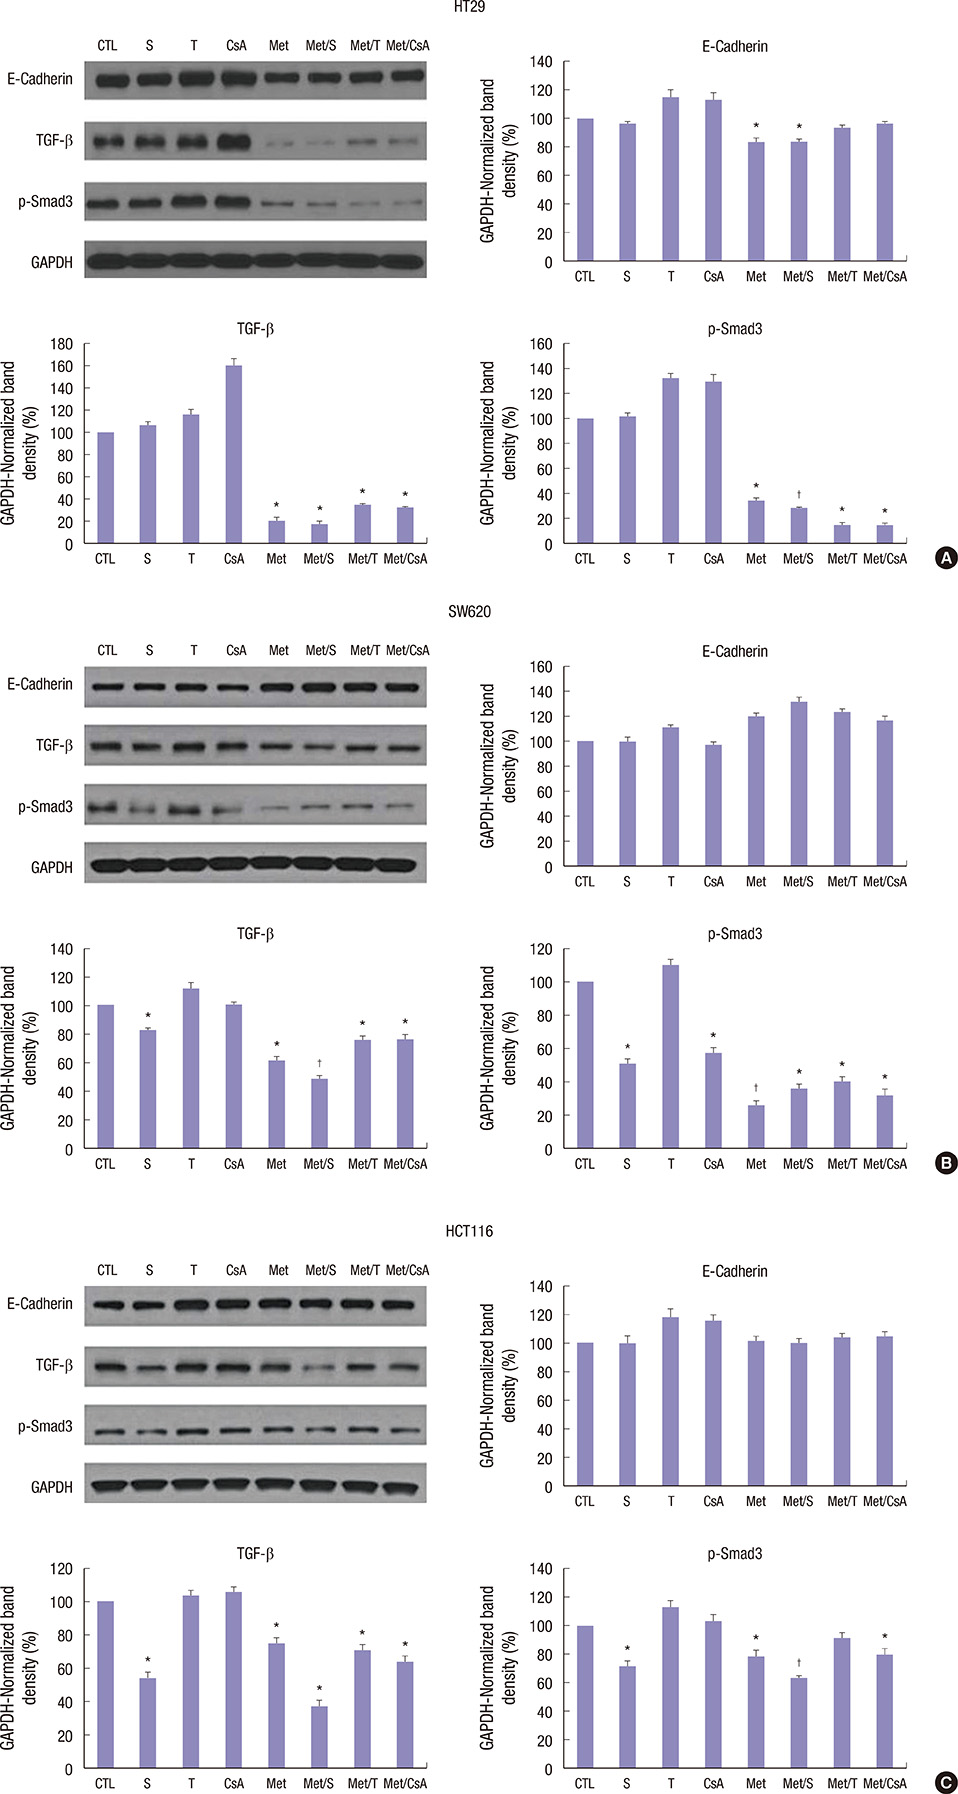
Fig. 5 Changes in expression levels of EMT-related proteins based on Western blot. TGF-β and p-Smad3 were effectively inhibited by M alone or in combination with S, CsA, and T in HT29 (A), SW620 (B) and HCT116 (C) cells. E-cadherin expression was significantly reduced in HT29 cells after treatment with M alone or in combination with S. The level of E-cadherin expression did not change in SW620 or HCT116 cells after treatment. Data are expressed as mean ± SD. Data are representatives of 3 separate experiments. CTL = control, S = sirolimus, T = tacrolimus, CsA = cyclosporin A, M = metformin, Met/S = metformin/sirolimus, Met/T = metformin/tacrolimus, Met/CsA = metformin/cyclosporin A, EMT = epithelial-mesenchymal-transition, SD = standard deviation, TGF = transforming growth factor, GAPDH = glyceraldehyde 3-phosphate dehydrogenase. *P < 0.05 compared to control group; †P < 0.05 compared to S, M.

Fig. 6 Western blot analysis for tissue samples from groups of S along and Met/S revealed significant decrease in the expression levels of all investigated proteins in HT29 cells. CsA had the weakest effect in this research. Data were representatives of animal experiment. CTL = control, S = sirolimus, T = tacrolimus, CsA = cyclosporin A, M = metformin, Met/S = metformin/sirolimus, Met/T = metformin/tacrolimus, Met/CsA = metformin/cyclosporin A, GAPDH = glyceraldehyde 3-phosphate dehydrogenase. *P < 0.05 compared to control group.
Reference
-
1. Doycheva I, Amer S, Watt KD. De novo malignancies after transplantation: risk and surveillance strategies. Med Clin North Am. 2016; 100:551–567.2. Mukthinuthalapati PK, Gotur R, Ghabril M. Incidence, risk factors and outcomes of de novo malignancies post liver transplantation. World J Hepatol. 2016; 8:533–544.3. Jain A, Patil VP, Fung J. Incidence of de novo cancer and lymphoproliferative disorders after liver transplantation in relation to age and duration of follow-up. Liver Transpl. 2008; 14:1406–1411.4. Vallejo GH, Romero CJ, de Vicente JC. Incidence and risk factors for cancer after liver transplantation. Crit Rev Oncol Hematol. 2005; 56:87–99.5. Tiao GM, Bobey N, Allen S, Nieves N, Alonso M, Bucuvalas J, Wells R, Ryckman F. The current management of hepatoblastoma: a combination of chemotherapy, conventional resection, and liver transplantation. J Pediatr. 2005; 146:204–211.6. Park HW, Hwang S, Ahn CS, Kim KH, Moon DB, Ha TY, Song GW, Jung DH, Park GC, Namgoong JM, et al. De novo malignancies after liver transplantation: incidence comparison with the Korean cancer registry. Transplant Proc. 2012; 44:802–805.7. Jung DH, Hwang S, Song GW, Ahn CS, Moon DB, Ha TY, Kim KH, Park GC, Kim BS, Park IJ, et al. Survival benefit of early cancer detection through regular endoscopic screening for de novo gastric and colorectal cancers in Korean liver transplant recipients. Transplant Proc. 2016; 48:145–151.8. Penn I. Occurrence of cancers in immunosuppressed organ transplant recipients. Clin Transpl. 1998; 147–158.9. Penn I. Post-transplant malignancy: the role of immunosuppression. Drug Saf. 2000; 23:101–113.10. Watt KD, Pedersen RA, Kremers WK, Heimbach JK, Charlton MR. Evolution of causes and risk factors for mortality post-liver transplant: results of the NIDDK long-term follow-up study. Am J Transplant. 2010; 10:1420–1427.11. Bosco JL, Antonsen S, Sørensen HT, Pedersen L, Lash TL. Metformin and incident breast cancer among diabetic women: a population-based case-control study in Denmark. Cancer Epidemiol Biomarkers Prev. 2011; 20:101–111.12. Kisfalvi K, Eibl G, Sinnett-Smith J, Rozengurt E. Metformin disrupts crosstalk between G protein-coupled receptor and insulin receptor signaling systems and inhibits pancreatic cancer growth. Cancer Res. 2009; 69:6539–6545.13. Hosono K, Endo H, Takahashi H, Sugiyama M, Sakai E, Uchiyama T, Suzuki K, Iida H, Sakamoto Y, Yoneda K, et al. Metformin suppresses colorectal aberrant crypt foci in a short-term clinical trial. Cancer Prev Res (Phila). 2010; 3:1077–1083.14. Azoulay L, Dell’Aniello S, Gagnon B, Pollak M, Suissa S. Metformin and the incidence of prostate cancer in patients with type 2 diabetes. Cancer Epidemiol Biomarkers Prev. 2011; 20:337–344.15. Ben Sahra I, Laurent K, Loubat A, Giorgetti-Peraldi S, Colosetti P, Auberger P, Tanti JF, Le Marchand-Brustel Y, Bost F. The antidiabetic drug metformin exerts an antitumoral effect in vitro and in vivo through a decrease of cyclin D1 level. Oncogene. 2008; 27:3576–3586.16. Shackelford DB, Shaw RJ. The LKB1-AMPK pathway: metabolism and growth control in tumour suppression. Nat Rev Cancer. 2009; 9:563–575.17. Aljada A, Mousa SA. Metformin and neoplasia: implications and indications. Pharmacol Ther. 2012; 133:108–115.18. Lee KW, Seo YD, Oh SC, Suh SW, Jeong J, Kim H, Yi NJ, Suh KS. What is the best immunosuppressant combination in terms of antitumor effect in hepatocellular carcinoma? Hepatol Res. 2016; 46:593–600.19. Liu ZN, Wang WT, Yan LN; Liver Surgery Group. De novo malignancies after liver transplantation with 14 cases at a single center. Transplant Proc. 2015; 47:2483–2487.20. Johnson EE, Leverson GE, Pirsch JD, Heise CP. A 30-year analysis of colorectal adenocarcinoma in transplant recipients and proposal for altered screening. J Gastrointest Surg. 2007; 11:272–279.21. Chandok N, Watt KD. Burden of de novo malignancy in the liver transplant recipient. Liver Transpl. 2012; 18:1277–1289.22. Yao FY, Gautam M, Palese C, Rebres R, Terrault N, Roberts JP, Peters MG. De novo malignancies following liver transplantation: a case-control study with long-term follow-up. Clin Transplant. 2006; 20:617–623.23. Campistol JM. Minimizing the risk of posttransplant malignancy. Transplant Proc. 2008; 40:S40–3.24. Ju WQ, Guo ZY, Liang WH, Wu LW, Tai Q, Hu AB, Han M, Zhu XF, He X. Sirolimus conversion in liver transplant recipients with calcineurin inhibitor-induced complications: efficacy and safety. Exp Clin Transplant. 2012; 10:132–135.25. Cholongitas E, Mamou C, Rodríguez-Castro KI, Burra P. Mammalian target of rapamycin inhibitors are associated with lower rates of hepatocellular carcinoma recurrence after liver transplantation: a systematic review. Transpl Int. 2014; 27:1039–1049.26. Rogers CC, Johnson SR, Mandelbrot DA, Pavlakis M, Horwedel T, Karp SJ, Egbuna O, Rodrigue JR, Chudzinski RE, Goldfarb-Rumyantzev AS, et al. Timing of sirolimus conversion influences recovery of renal function in liver transplant recipients. Clin Transplant. 2009; 23:887–896.27. Vivarelli M, Dazzi A, Cucchetti A, Gasbarrini A, Zanello M, Di Gioia P, Bianchi G, Tamè MR, Gaudio MD, Ravaioli M, et al. Sirolimus in liver transplant recipients: a large single-center experience. Transplant Proc. 2010; 42:2579–2584.28. He K, Zheng X, Li M, Zhang L, Yu J. mTOR inhibitors induce apoptosis in colon cancer cells via CHOP-dependent DR5 induction on 4E-BP1 dephosphorylation. Oncogene. 2016; 35:148–157.29. Sun Q, Zheng Y, Liu Q, Cao X. Rapamycin reverses TLR4 signaling-triggered tumor apoptosis resistance by disrupting Akt-mediated Bcl-xL upregulation. Int Immunopharmacol. 2008; 8:1854–1858.30. Duo J, Ma Y, Wang G, Han X, Zhang C. Metformin synergistically enhances antitumor activity of histone deacetylase inhibitor trichostatin a against osteosarcoma cell line. DNA Cell Biol. 2013; 32(9):–. 156–164.31. Saha A, Blando J, Tremmel L, DiGiovanni J. Effect of metformin, rapamycin, and their combination on growth and progression of prostate tumors in HiMyc mice. Cancer Prev Res (Phila). 2015; 8:597–606.32. Tan MH, Alquraini H, Mizokami-Stout K, MacEachern M. Metformin: from research to clinical practice. Endocrinol Metab Clin North Am. 2016; 45:819–843.33. Newman JC, Milman S, Hashmi SK, Austad SN, Kirkland JL, Halter JB, Barzilai N. Strategies and challenges in clinical trials targeting human aging. J Gerontol A Biol Sci Med Sci. 2016; 71:1424–1434.34. Bianchi C, Penno G, Romero F, Del Prato S, Miccoli R. Treating the metabolic syndrome. Expert Rev Cardiovasc Ther. 2007; 5:491–506.
- Full Text Links
-
- Actions
-
Cited
- CITED
-
- Close
- Share
-
- Similar articles
-
- High-Dose Metformin Plus Temozolomide Shows Increased Anti-tumor Effects in Glioblastoma In Vitro and In vivo Compared with Monotherapy
- Metformin displays in vitro and in vivo antitumor effect against osteosarcoma
- The Metformin Use and Gastric Cancer Risk
- Amiloride inhibits the growth of human colon cancer cells(HT-29) in vitro
- Effects and Mechanisms of Metformin on the Proliferation of Esophageal Cancer Cells In Vitro and In Vivo
