Changes in Fundus Autofluorescence after Anti-vascular Endothelial Growth Factor According to the Type of Choroidal Neovascularization in Age-related Macular Degeneration
- Affiliations
-
- 1Department of Ophthalmology, Konkuk University Medical Center, Konkuk University School of Medicine, Seoul, Korea. eyekim@kuh.ac.kr
- KMID: 2363886
- DOI: http://doi.org/10.3341/kjo.2016.30.1.17
Abstract
- PURPOSE
To describe the changes of fundus autofluorescence (FAF) in patients with age-related macular degeneration before and after intravitreal injection of anti-vascular endothelial growth factor according to the type of choroidal neovascularization (CNV) and to evaluate the correlation of FAF with spectral domain optical coherence tomography (SD-OCT) parameters and vision.
METHODS
This was a retrospective study. Twenty-one treatment-naive patients with neovascular age-related macular degeneration were included. Study eyes were divided into two groups according to the type of CNV. Fourteen eyes were type 1 CNV and seven eyes were type 2 CNV. All eyes underwent a complete ophthalmologic examination, including an assessment of best-corrected visual acuity, SD-OCT, fluorescein angiography, and FAF imaging, before and 3 months after intravitreal anti-vascular endothelial growth factor injection. Gray scales of FAF image for CNV areas, delineated as in fluorescein angiography, were analyzed using the ImageJ program, which were adjusted by comparison with normal background areas. Correlation of changes in FAF with changes in SD-OCT parameters, including CNV thickness, photoreceptor inner and outer segment junction disruption length, external limiting membrane disruption length, central macular thickness, subretinal fluid, and intraretinal fluid were analyzed.
RESULTS
Eyes with both type 1 and type 2 CNV showed reduced FAF before treatment. The mean gray scales (%) of type 1 and type 2 CNV were 52.20% and 42.55%, respectively. The background values were 106.72 and 96.86. After treatment, the mean gray scales (%) of type 1 CNV and type 2 CNV were changed to 57.61% (p = 0.005) and 57.93% (p = 0.008), respectively. After treatment, CNV thickness, central macular thickness, and inner and outer segment junction disruption length were decreased while FAF increased.
CONCLUSIONS
FAF was noted to be reduced in eyes with newly diagnosed wet age-related macular degeneration, but increased after anti-vascular endothelial growth factor therapy regardless of CNV lesion type.
Keyword
MeSH Terms
-
Aged
Angiogenesis Inhibitors/*therapeutic use
Choroidal Neovascularization/classification/diagnostic imaging/*drug therapy
Female
Fluorescein Angiography
Fundus Oculi
Humans
Intravitreal Injections
Male
Middle Aged
Optical Imaging
Ranibizumab/*therapeutic use
Retrospective Studies
Tomography, Optical Coherence
Vascular Endothelial Growth Factor A/*antagonists & inhibitors
Visual Acuity
Wet Macular Degeneration/classification/diagnostic imaging/*drug therapy
Angiogenesis Inhibitors
Ranibizumab
Vascular Endothelial Growth Factor A
Figure
-

Fig. 1 (A) A total of 50 neovascular age-related macular degeneration (nAMD) patients visited our clinic, and 27 patients were excluded. (B) All patients in this study underwent a complete ophthalmologic examination, including an assessment of best-corrected visual acuity (BCVA), spectral domain optical coherence tomography (SD-OCT), fluorescein angiography (FA), indocyanine green angiography (ICGA) and fundus autofluorescence (FAF) imaging before the first intravitreal anti-vascular endothelial growth factor injection (pre-treatment) and BCVA, SD-OCT, and FA 1 month after the initial three intravitreal anti-vascular endothelial growth factor injections. Post-treatment gray scale of FAF (%) was measured in the test that was performed 1 month after the last injection (post-treatment). PED = pigment epithelial detachment; SRH = subretinal hemorrhage; RAP = retinal angiomatous proliferation; FU = follow-up; CNV = choroidal neovascularization.

Fig. 2 Gray scale measurements of fundus autofluorescence (FAF) images for choroidal neovascularization (CNV) areas delineated in fluorescein angiography (FA) and spectral domain optical coherence tomography (SD-OCT) were analyzed using the ImageJ program. (A) FAF image of CNV. White line indicates the boundary of CNV. (B) FA image of CNV. White line indicates the boundary of CNV. (C) SD-OCT image of CNV. White vertical lines indicate the diameter of CNV.
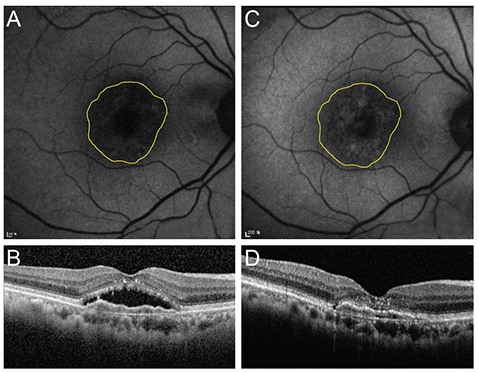
Fig. 3 Changes in fundus autofluorescence and spectral domain optical coherence tomography (SD-OCT) after intravitreal anti-vascular endothelial growth factor injection in an exudative age-related macular degeneration patient with type 1 choroidal neovascularization (CNV). After treatment, as subretinal fluid was absorbed as shown on SD-OCT, the brightness of autofluorescence in the area of CNV was increased. (A) Fundus autofluorescence of pre-treatment CNV. Initial best-corrected visual acuity (BCVA) was 20 / 100. (B) SD-OCT of pre-treatment CNV. CNV with subretinal fluid was seen. (C) Fundus autofluorescence of post-treatment CNV. Final BCVA was 20 / 60. (D) Post-treatment SD-OCT. Subretinal fluid was completely absorbed.
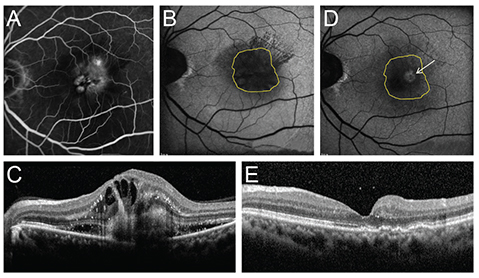
Fig. 4 Changes in fundus autofluorescence and spectral domain optical coherence tomography (SD-OCT) after intravitreal anti-vascular endothelial growth factor injection in an exudative age-related macular degeneration patient with type 2 choroidal neovascularization (CNV). After treatment, CNV size was decreased and macular edema disappeared. Also, the brightness of fundus autofluorescence was increased after treatment. (A) Fluorescein angiography of pre-treatment type 2 CNV patient. (B) Fundus autofluorescence of pre-treatment type 2 CNV patient. (C) SD-OCT image of pre-treatment type 2 CNV patient. CNV, intraretinal fluid, and subretinal fluid were seen. (D) Fundus autofluorescence of post-treatment type 2 CNV patient. The arrow indicates increased fundus autofluorescence in CNV area. (E) SD-OCT image of post-treatment type 2 CNV patient. CNV, intraretinal fluid, and subretinal fluid were absorbed.
Reference
-
1. Klaver CC, Wolfs RC, Vingerling JR, et al. Age-specific prevalence and causes of blindness and visual impairment in an older population: the Rotterdam Study. Arch Ophthalmol. 1998; 116:653–658.2. Attebo K, Mitchell P, Smith W. Visual acuity and the causes of visual loss in Australia: the Blue Mountains Eye Study. Ophthalmology. 1996; 103:357–364.3. Veritti D, Sarao V, Lanzetta P. Neovascular age-related macular degeneration. Ophthalmologica. 2012; 227:Suppl 1. 11–20.4. Grossniklaus HE, Green WR. Choroidal neovascularization. Am J Ophthalmol. 2004; 137:496–503.5. Lim JI. Choroidal neovascularization. In : Lim JI, editor. Age-related macular degeneration. 2nd ed. Boca Raton: CC Press;2007. p. 87–96.6. Rosenfeld PJ, Brown DM, Heier JS, et al. Ranibizumab for neovascular age-related macular degeneration. N Engl J Med. 2006; 355:1419–1431.7. Abraham P, Yue H, Wilson L. Randomized, double-masked, sham-controlled trial of ranibizumab for neovascular age-related macular degeneration: PIER study year 2. Am J Ophthalmol. 2010; 150:315–324.e1.8. Brown DM, Michels M, Kaiser PK, et al. Ranibizumab versus verteporfin photodynamic therapy for neovascular age-related macular degeneration: two-year results of the ANCHOR study. Ophthalmology. 2009; 116:57–65.e5.9. Comparison of Age-related Macular Degeneration Treatments Trials (CATT) Research Group. Martin DF, Maguire MG, et al. Ranibizumab and bevacizumab for treatment of neovascular age-related macular degeneration: two-year results. Ophthalmology. 2012; 119:1388–1398.10. Schmitz-Valckenberg S, Fleckenstein M, Scholl HP, Holz FG. Fundus autofluorescence and progression of age-related macular degeneration. Surv Ophthalmol. 2009; 54:96–117.11. Delori FC, Dorey CK, Staurenghi G, et al. In vivo fluorescence of the ocular fundus exhibits retinal pigment epithelium lipofuscin characteristics. Invest Ophthalmol Vis Sci. 1995; 36:718–729.12. Boulton M, McKechnie NM, Breda J, et al. The formation of autofluorescent granules in cultured human RPE. Invest Ophthalmol Vis Sci. 1989; 30:82–89.13. von Ruckmann A, Fitzke FW, Bird AC. In vivo fundus autofluorescence in macular dystrophies. Arch Ophthalmol. 1997; 115:609–615.14. Feeney-Burns L, Berman ER, Rothman H. Lipofuscin of human retinal pigment epithelium. Am J Ophthalmol. 1980; 90:783–791.15. Framme C, Bunse A, Sofroni R, et al. Fundus autofluorescence before and after photodynamic therapy for choroidal neovascularization secondary to age-related macular degeneration. Ophthalmic Surg Lasers Imaging. 2006; 37:406–414.16. Vaclavik V, Vujosevic S, Dandekar SS, et al. Autofluorescence imaging in age-related macular degeneration complicated by choroidal neovascularization: a prospective study. Ophthalmology. 2008; 115:342–346.17. Dandekar SS, Jenkins SA, Peto T, et al. Autofluorescence imaging of choroidal neovascularization due to age-related macular degeneration. Arch Ophthalmol. 2005; 123:1507–1513.18. Shin HJ, Chung H, Kim HC. Association between foveal microstructure and visual outcome in age-related macular degeneration. Retina. 2011; 31:1627–1636.19. Hayashi H, Yamashiro K, Tsujikawa A, et al. Association between foveal photoreceptor integrity and visual outcome in neovascular age-related macular degeneration. Am J Ophthalmol. 2009; 148:83–89.e1.20. McBain VA, Forrester JV, Lois N. Fundus autofluorescence in the diagnosis of cystoid macular oedema. Br J Ophthalmol. 2008; 92:946–949.
- Full Text Links
-
- Actions
-
Cited
- CITED
-
- Close
- Share
-
- Similar articles
-
- Treatment of Exudative Age-Related Macular Degeneration
- Up-to-date knowledge on age-related macular degeneration
- Comparison of Real-world Treatment Outcomes between Type 1 and Type 2 Choroidal Neovascularization
- Peripapillary Choroidal Thickness Change of Polypoidal Choroidal Vasculopathy after Anti-vascular Endothelial Growth Factor
- Anti-Vascular Endothelial Growth Factor Therapy for Choroidal Neovascularization Secondary to Optic Nerve Head Drusen
