Difference of the Nuclear Green Light Intensity between Papillary Carcinoma Cells Showing Clear Nuclei and Non-neoplastic Follicular Epithelia in Papillary Thyroid Carcinoma
- Affiliations
-
- 1Department of Pathology, Eulji University Hospital, Eulji University School of Medicine, Daejeon, Korea.
- 2Medical Examiner's Office, National Forensic Service, Wonju, Korea.
- 3Department of Occupational Medicine, Eulji University Hospital, Eulji University School of Medicine, Daejeon, Korea. kimsooy@eulji.ac.kr
- KMID: 2353597
- DOI: http://doi.org/10.4132/jptm.2016.05.19
Abstract
- BACKGROUND
There is subjective disagreement regarding nuclear clearing in papillary thyroid carcinoma. In this study, using digital instruments, we were able to quantify many ambiguous pathologic features and use numeric data to express our findings.
METHODS
We examined 30 papillary thyroid carcinomas. For each case, we selected representative cancer cells showing clear nuclei and surrounding non-neoplastic follicular epithelial cells and evaluated objective values of green light intensity (GLI) for quantitative analysis of nuclear clearing in papillary thyroid carcinoma.
RESULTS
From 16,274 GLI values from 600 cancer cell nuclei and 13,752 GLI values from 596 non-neoplastic follicular epithelial nuclei, we found a high correlation of 94.9% between GLI and clear nuclei. GLI between the cancer group showing clear nuclei and non-neoplastic follicular epithelia was statistically significant. The overall average level of GLI in the cancer group was over two times higher than the non-neoplastic group despite a wide range of GLI. On a polygonal line graph, there was a fluctuating unique difference between both the cancer and non-neoplastic groups in each patient, which was comparable to the microscopic findings.
CONCLUSIONS
Nuclear GLI could be a useful factor for discriminating between carcinoma cells showing clear nuclei and non-neoplastic follicular epithelia in papillary thyroid carcinoma.
Keyword
MeSH Terms
Figure
-
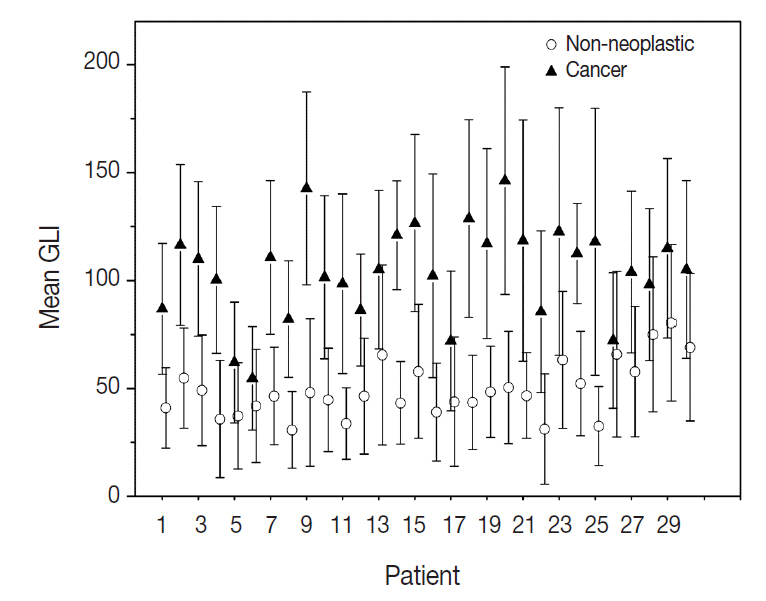
Fig. 1. Plot box graph of green light intensity (GLI) of cancer cells and non-neoplastic cells in 30 papillary thyroid carcinoma patients. Error bar, 5th and 95th percentiles; line, central 50th percentile; triangle for cancer, circle for non-neoplastic group, mean GLI.
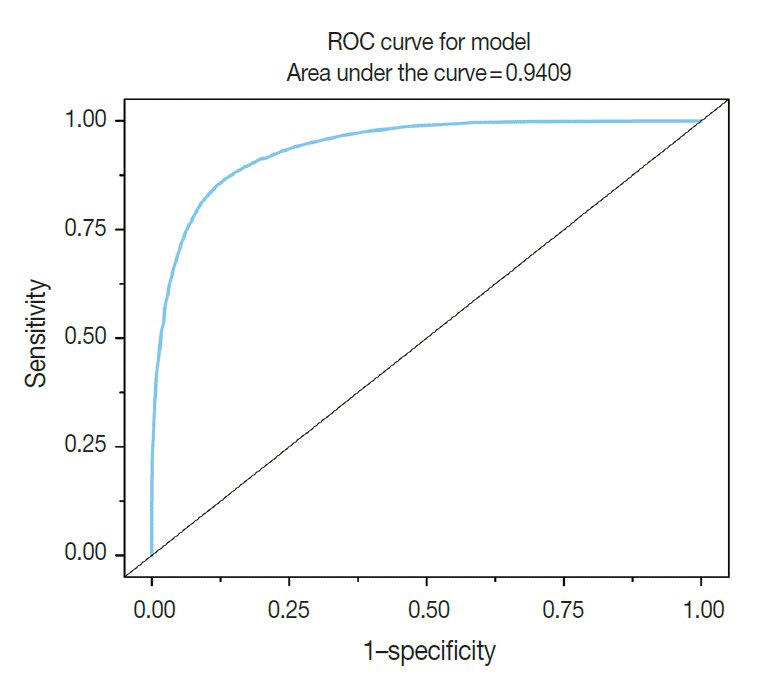
Fig. 2. High correlation of green light intensity with nuclear clearing in receiver operating characteristic curve (ROC).

Fig. 3. Comparison of green light intensity (GLI) between papillary thyroid carcinoma showing clear nuclei and surrounding non-neoplastic follicular epithelial cells.
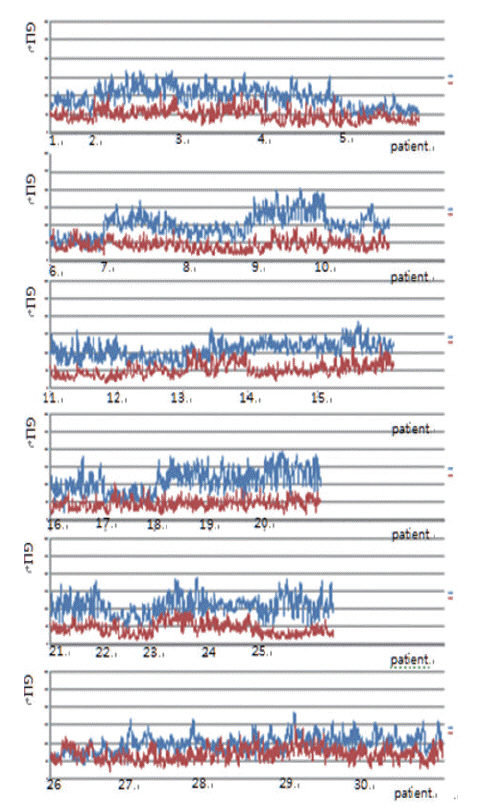
Fig. 4. Fluctuating difference of green light intensity (GLI) in both cancer and non-neoplastic groups between each patient on polygonal line graph (red, non-neoplastic cells; blue, cancer).

Fig. 5. (A) Comparison of green light intensity (GLI) of cancer cells and non-neoplastic cells in case 25, which shows a large difference (left, cancer; right, non-neoplastic cells). (B) Comparison of GLI of cancer cells and non-neoplastic cells in case 26, where there is no significant difference (left, cancer; right, non-neoplastic cells). Note the similarity in red, green, and blue light intensities of non-neoplastic follicular epithelial cells in panel A and B.
Reference
-
1. LiVolsi VA. Papillary thyroid carcinoma: an update. Mod Pathol. 2011; 24 Suppl 2:S1–9.
Article2. Neltner JH, Abner EL, Schmitt FA, et al. Digital pathology and image analysis for robust high-throughput quantitative assessment of Alzheimer disease neuropathologic changes. J Neuropathol Exp Neurol. 2012; 71:1075–85.
Article3. El Hallani S, Guillaud M, Korbelik J, Marginean EC. Evaluation of quantitative digital pathology in the assessment of Barrett eophagus-associated dysplasia. Am J Clin Pathol. 2015; 144:151–64.4. Guillaud M, Zhang L, Poh C, Rosin MP, MacAulay C. Potential use of quantitative tissue phenotype to predict malignant risk for oral premalignant lesions. Cancer Res. 2008; 68:3099–107.
Article5. Huang W, Hennrick K, Drew S. A colorful future of quantitative pathology: validation of Vectra technology using chromogenic multiplexed immunohistochemistry and prostate tissue microarrays. Hum Pathol. 2013; 44:29–38.
Article6. Kayser K, Görtler J, Goldmann T, Vollmer E, Hufnagl P, Kayser G. Image standards in tissue-based diagnosis (diagnostic surgical pathology). Diagn Pathol. 2008; 3:17.
Article7. Park M, Baek T, Baek J, et al. Nuclear image analysis study of neuroendocrine tumors. Korean J Pathol. 2012; 46:38–41.
Article8. Yagi Y. Color standardization and optimization in whole slide imaging. Diagn Pathol. 2011; 6 Suppl 1:S15.
Article9. Bautista PA, Hashimoto N, Yagi Y. Color standardization in whole slide imaging using a color calibration slide. J Pathol Inform. 2014; 5:4.
Article10. Johannessen JV, Gould VE, Jao W. The fine structure of human thyroid cancer. Hum Pathol. 1978; 9:385–400.
Article11. Fischer AH, Taysavang P, Weber CJ, Wilson KL. Nuclear envelope organization in papillary thyroid carcinoma. Histol Histopathol. 2001; 16:1–14.12. Lin MH, Akera T. Increased (Na+,K+)-ATPase concentrations in various tissues of rats caused by thyroid hormone treatment. J Biol Chem. 1978; 253:723–6.
Article13. Kamitani T, Ikeda U, Muto S, et al. Regulation of Na,K-ATPase gene expression by thyroid hormone in rat cardiocytes. Circ Res. 1992; 71:1457–64.
Article14. Liu Y, Levine B. Autosis and autophagic cell death: the dark side of autophagy. Cell Death Differ. 2015; 22:367–76.
Article15. Garner MH. Na,K-ATPase in the nuclear envelope regulates Na+: K+ gradients in hepatocyte nuclei. J Membr Biol. 2002; 187:97–115.
Article16. Louis DN, Gerber GK, Baron JM, et al. Computational pathology: an emerging definition. Arch Pathol Lab Med. 2014; 138:1133–8.
Article17. Louis DN, Feldman M, Carter AB, et al. Computational pathology: a path ahead. Arch Pathol Lab Med. 2016; 140:41–50.
Article
- Full Text Links
-
- Actions
-
Cited
- CITED
-
- Close
- Share
-
- Similar articles
-
- Grooved Nuclei in Thyroid Papillary Carcinoma
- Oxyphilic Papillary Carcinoma of the Thyroid in Fine Needle Aspiration
- Warthin-like Tumor Variant of Papillary Thyroid Carcinoma: A Case Report
- A Case of Mixed Follicular-Papillary Thyroid Carcinoma
- A study of Digital Image Analysis of Chromatin Texture for Discrimination of Thyroid Neoplastic Cells
