Korean J Ophthalmol.
2014 Aug;28(4):323-329.
Depth and Area of Retinal Nerve Fiber Layer Damage and Visual Field Correlation Analysis
- Affiliations
-
- 1Department of Ophthalmology, Dongtan Hallym University Sacred Heart Hospital, Hallym University College of Medicine, Hwaseong, Korea.
- 2Kong Eye Clinic, Seoul, Korea.
- 3Department of Ophthalmology, Samsung Medical Center, Sungkyunkwan University School of Medicine, Seoul, Korea. ckee@skku.edu
Abstract
- PURPOSE
To evaluate the relationship between the structural damage as assessed by time-domain optical coherence tomography (OCT) and functional changes in glaucoma.
METHODS
In total, 190 patients with normal tension glaucoma or primary open angle glaucoma were included in this study. The thickness of retinal nerve fiber layer (RNFL) around the optic disc and the area of RNFL defect were determined using OCT scans. The relationships between the RNFL thickness or area of the defect and visual field (VF) indices were assessed using the Lowess function, regression analysis and partial Spearman correlation. The differences between these associations depending on the stage of VF damage were further analyzed. Age, optic disc size, refraction, central corneal thickness and the presence of systemic disease were corrected for in order to exclude confounding factors.
RESULTS
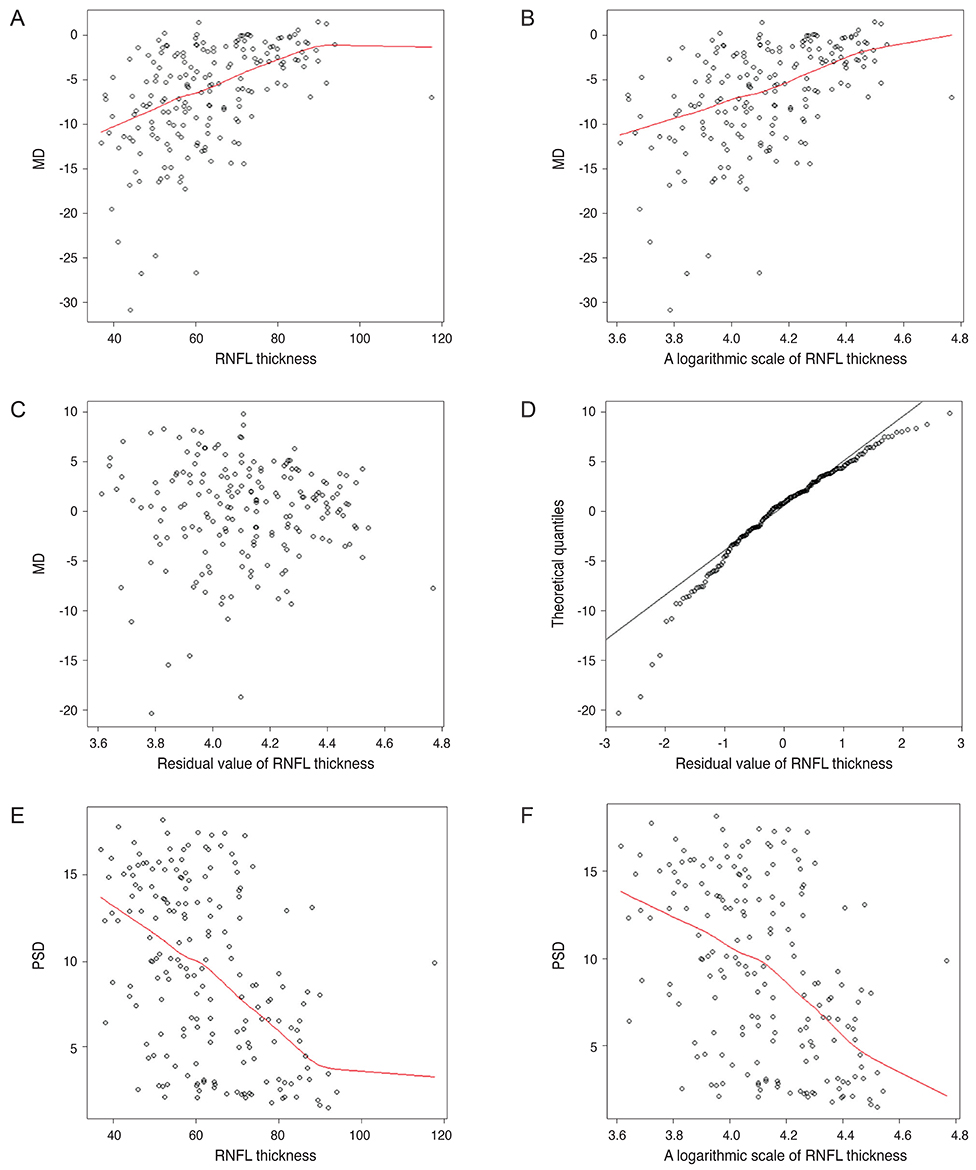
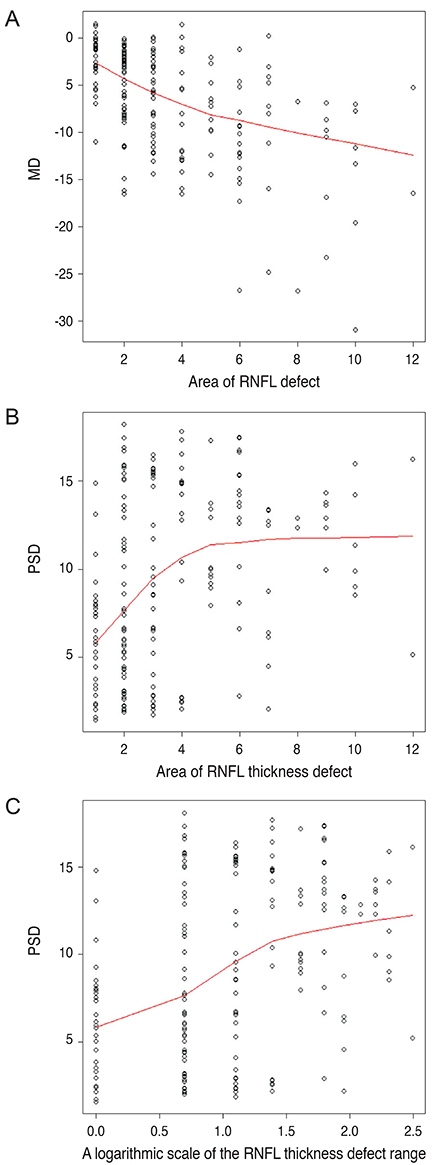
A logarithmic scale of RNFL thickness showed a negative linear relationship with VF indices. The area of the RNFL defect showed a weak correlation with the pattern of standard deviation, whereas the remnant RNFL thickness was moderately correlated with the pattern of standard deviation (partial Spearman correlation coefficient, 0.39, -0.47, respectively; p < 0.0001). Many outliers were detected in the Lowess-plotted graphs. Multiplication of the area and the inverted RNFL thickness showed a moderately correlated logarithmic relationship with the VF indices (partial Spearman correlation coefficient, 0.46; 95% confidence interval, 0.34 to 0.57; p < 0.0001). In the severe stage of VF damage, correlation between the area of the RNFL defect and mean deviation was significantly greater than in other stages (partial Spearman correlation coefficient, -0.66; p = 0.02).
CONCLUSIONS
The thickness of the RNFL had a negative logarithmic correlation with the VF indices and was more relevant to the VF indices than the area of the RNFL defect, as measured by OCT.
Keyword
MeSH Terms
Figure
Reference
-
1. Hood DC, Kardon RH. A framework for comparing structural and functional measures of glaucomatous damage. Prog Retin Eye Res. 2007; 26:688–710.2. Leung CK, Chan WM, Hui YL, et al. Analysis of retinal nerve fiber layer and optic nerve head in glaucoma with different reference plane offsets, using optical coherence tomography. Invest Ophthalmol Vis Sci. 2005; 46:891–899.3. Leung CK, Chong KK, Chan WM, et al. Comparative study of retinal nerve fiber layer measurement by StratusOCT and GDx VCC, II: structure/function regression analysis in glaucoma. Invest Ophthalmol Vis Sci. 2005; 46:3702–3711.4. Garway-Heath DF, Holder GE, Fitzke FW, Hitchings RA. Relationship between electrophysiological, psychophysical, and anatomical measurements in glaucoma. Invest Ophthalmol Vis Sci. 2002; 43:2213–2220.5. Hodapp E, Parrish RK, Anderson DR. Clinical decisions in glaucoma. St Louis: Mosby;1993. p. 84–126.6. Chauhan BC, Blanchard JW, Hamilton DC, LeBlanc RP. Technique for detecting serial topographic changes in the optic disc and peripapillary retina using scanning laser tomography. Invest Ophthalmol Vis Sci. 2000; 41:775–782.7. Harwerth RS, Carter-Dawson L, Shen F, et al. Ganglion cell losses underlying visual field defects from experimental glaucoma. Invest Ophthalmol Vis Sci. 1999; 40:2242–2250.8. Bellezza AJ, Rintalan CJ, Thompson HW, et al. Deformation of the lamina cribrosa and anterior scleral canal wall in early experimental glaucoma. Invest Ophthalmol Vis Sci. 2003; 44:623–637.9. Sommer A, Katz J, Quigley HA, et al. Clinically detectable nerve fiber atrophy precedes the onset of glaucomatous field loss. Arch Ophthalmol. 1991; 109:77–83.10. Quigley HA, Katz J, Derick RJ, et al. An evaluation of optic disc and nerve fiber layer examinations in monitoring progression of early glaucoma damage. Ophthalmology. 1992; 99:19–28.11. Cioffi GA, Liebmann JM, Johnson CA, Weinreb RN. Structural-functional relationships of the optic nerve in glaucoma. J Glaucoma. 2000; 9:3–4.12. Kanamori A, Nakamura M, Escano MF, et al. Evaluation of the glaucomatous damage on retinal nerve fiber layer thickness measured by optical coherence tomography. Am J Ophthalmol. 2003; 135:513–520.13. Leite MT, Zangwill LM, Weinreb RN, et al. Structure-function relationships using the Cirrus spectral domain optical coherence tomograph and standard automated perimetry. J Glaucoma. 2012; 21:49–54.14. Lee JR, Jeoung JW, Choi J, et al. Structure-function relationships in normal and glaucomatous eyes determined by time- and spectral-domain optical coherence tomography. Invest Ophthalmol Vis Sci. 2010; 51:6424–6430.15. Sihota R, Sony P, Gupta V, et al. Diagnostic capability of optical coherence tomography in evaluating the degree of glaucomatous retinal nerve fiber damage. Invest Ophthalmol Vis Sci. 2006; 47:2006–2010.16. Gramer E, Althaus G, Leydhecker W. Site and depth of glaucomatous visual field defects in relation to the size of the neuroretinal edge zone of the optic disk in glaucoma without hypertension, simple glaucoma, pigmentary glaucoma. A clinical study with the Octopus perimeter 201 and the optic nerve head analyzer. Klin Monbl Augenheilkd. 1986; 189:190–198.
- Full Text Links
- Actions
-
Cited
- CITED
-
- Close
- Share
- Similar articles
-
- Comparison of Postoperative Visual Field and Nerve Fiber Layer Change in Rhegmatogenous Retinal Detachment
- Computer Densitometry of Retinal Nerve Fiber layer Photographs
- Progressive Localized Retinal Nerve Fiber Layer Defect Following Cotton Wool Spots and a Dot Hemorrhage
- Topographic Measurements of the Optic Nerve Head with Confocal Scanning Laser Tomography in Normal Subjects and Patients with Glaucoma
- Reproducibility of Retinal Nerve Fiber Layer Thickness Evaluation by Nerve Fiber Analyzer


