J Korean Ophthalmol Soc.
2008 Mar;49(3):479-486. 10.3341/jkos.2008.49.3.479.
Multifocal Electroretinography After Reattachment of Macula-Off Retinal Detachment
- Affiliations
-
- 1Department of Ophthalmology, Dankook University College of Medicine, Cheonan, Korea. changmh@dankook.ac.kr
- KMID: 2211322
- DOI: http://doi.org/10.3341/jkos.2008.49.3.479
Abstract
-
PURPOSE: To assess macular function by multifocal electroretinography after reattachment of macula-off retinal detachment and to evaluate relationship between duration of macular detachment (DMD) and functional recovery.
METHODS
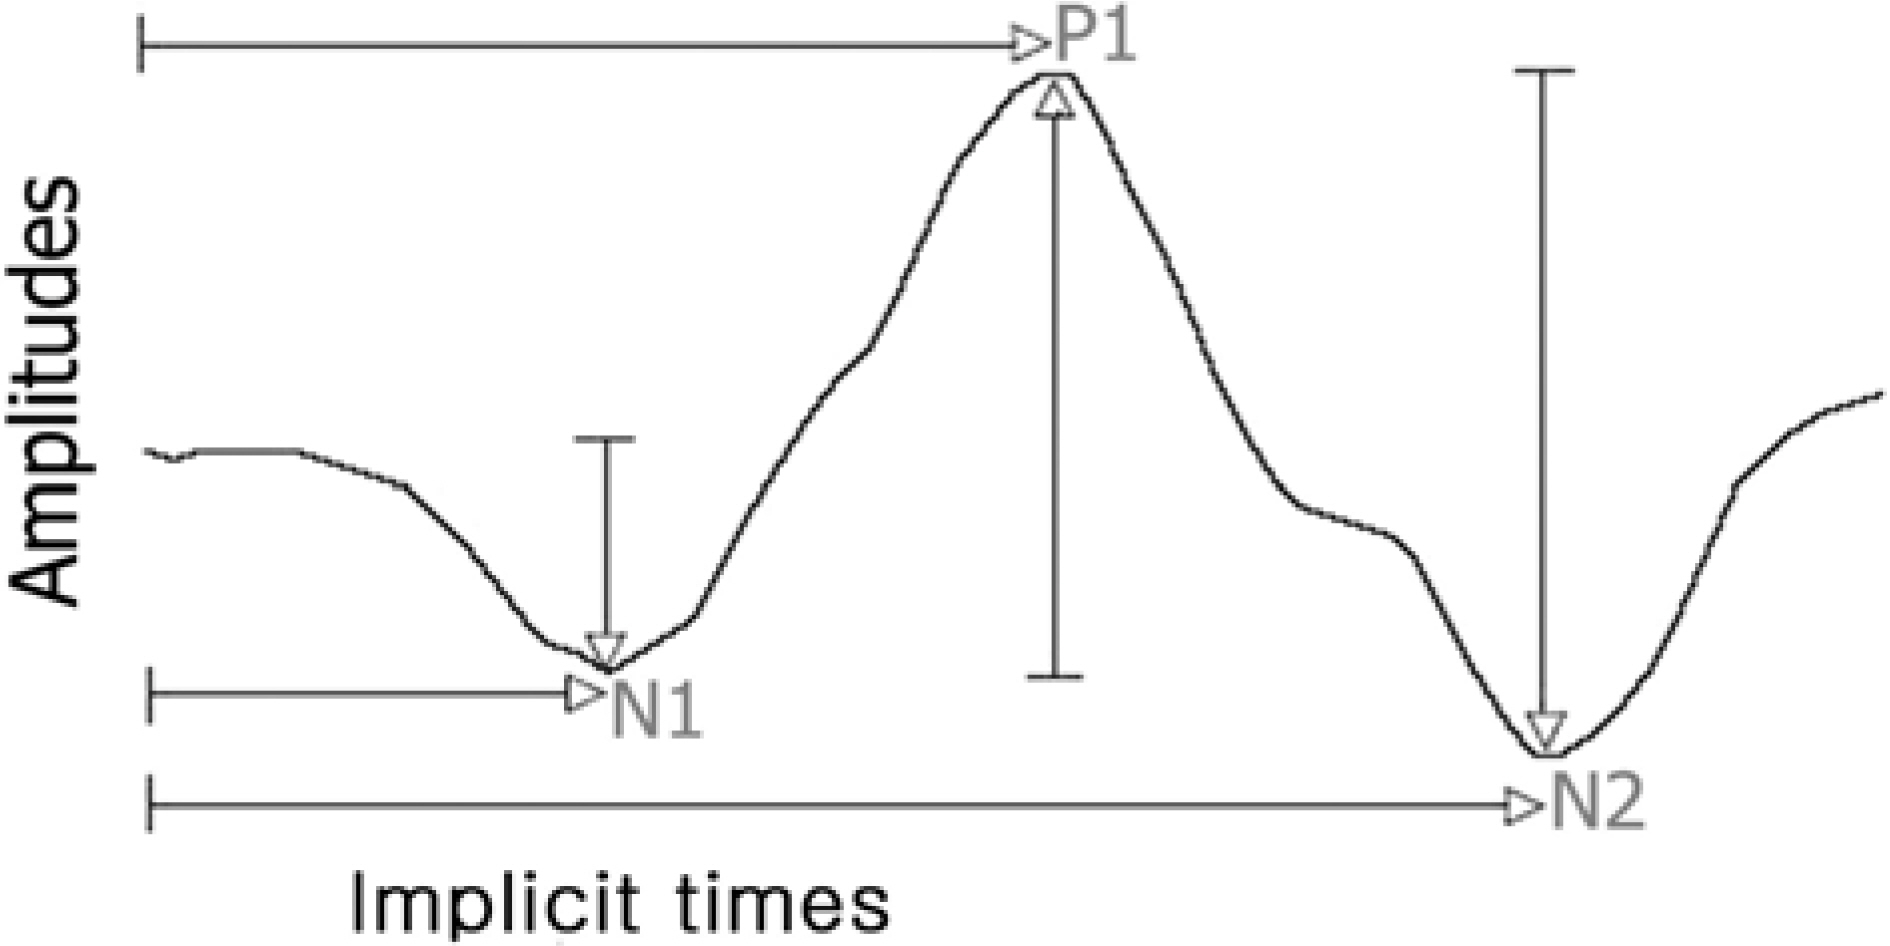
Nineteen patients (19 eyes) with macula-off rhegmatogenous retinal detachment underwent pneumatic retinopexy or scleral buckling. Retinal reattachment was obtained successfully in all patients. Duration of follow-up of all patients is at least more than 12 months. Eyes were divided into 2 groups, corresponding to the DMD : Group A (within 7 days, n=9 eyes), Group B (>7 days, n=10 eyes). The amplitudes and implicit times of N1-wave and P1-wave of mfERGs in Area 1 (Ring 1), Area 2 (Ring 1+2) were compared between Group A and B and between Group A and control group.
RESULTS
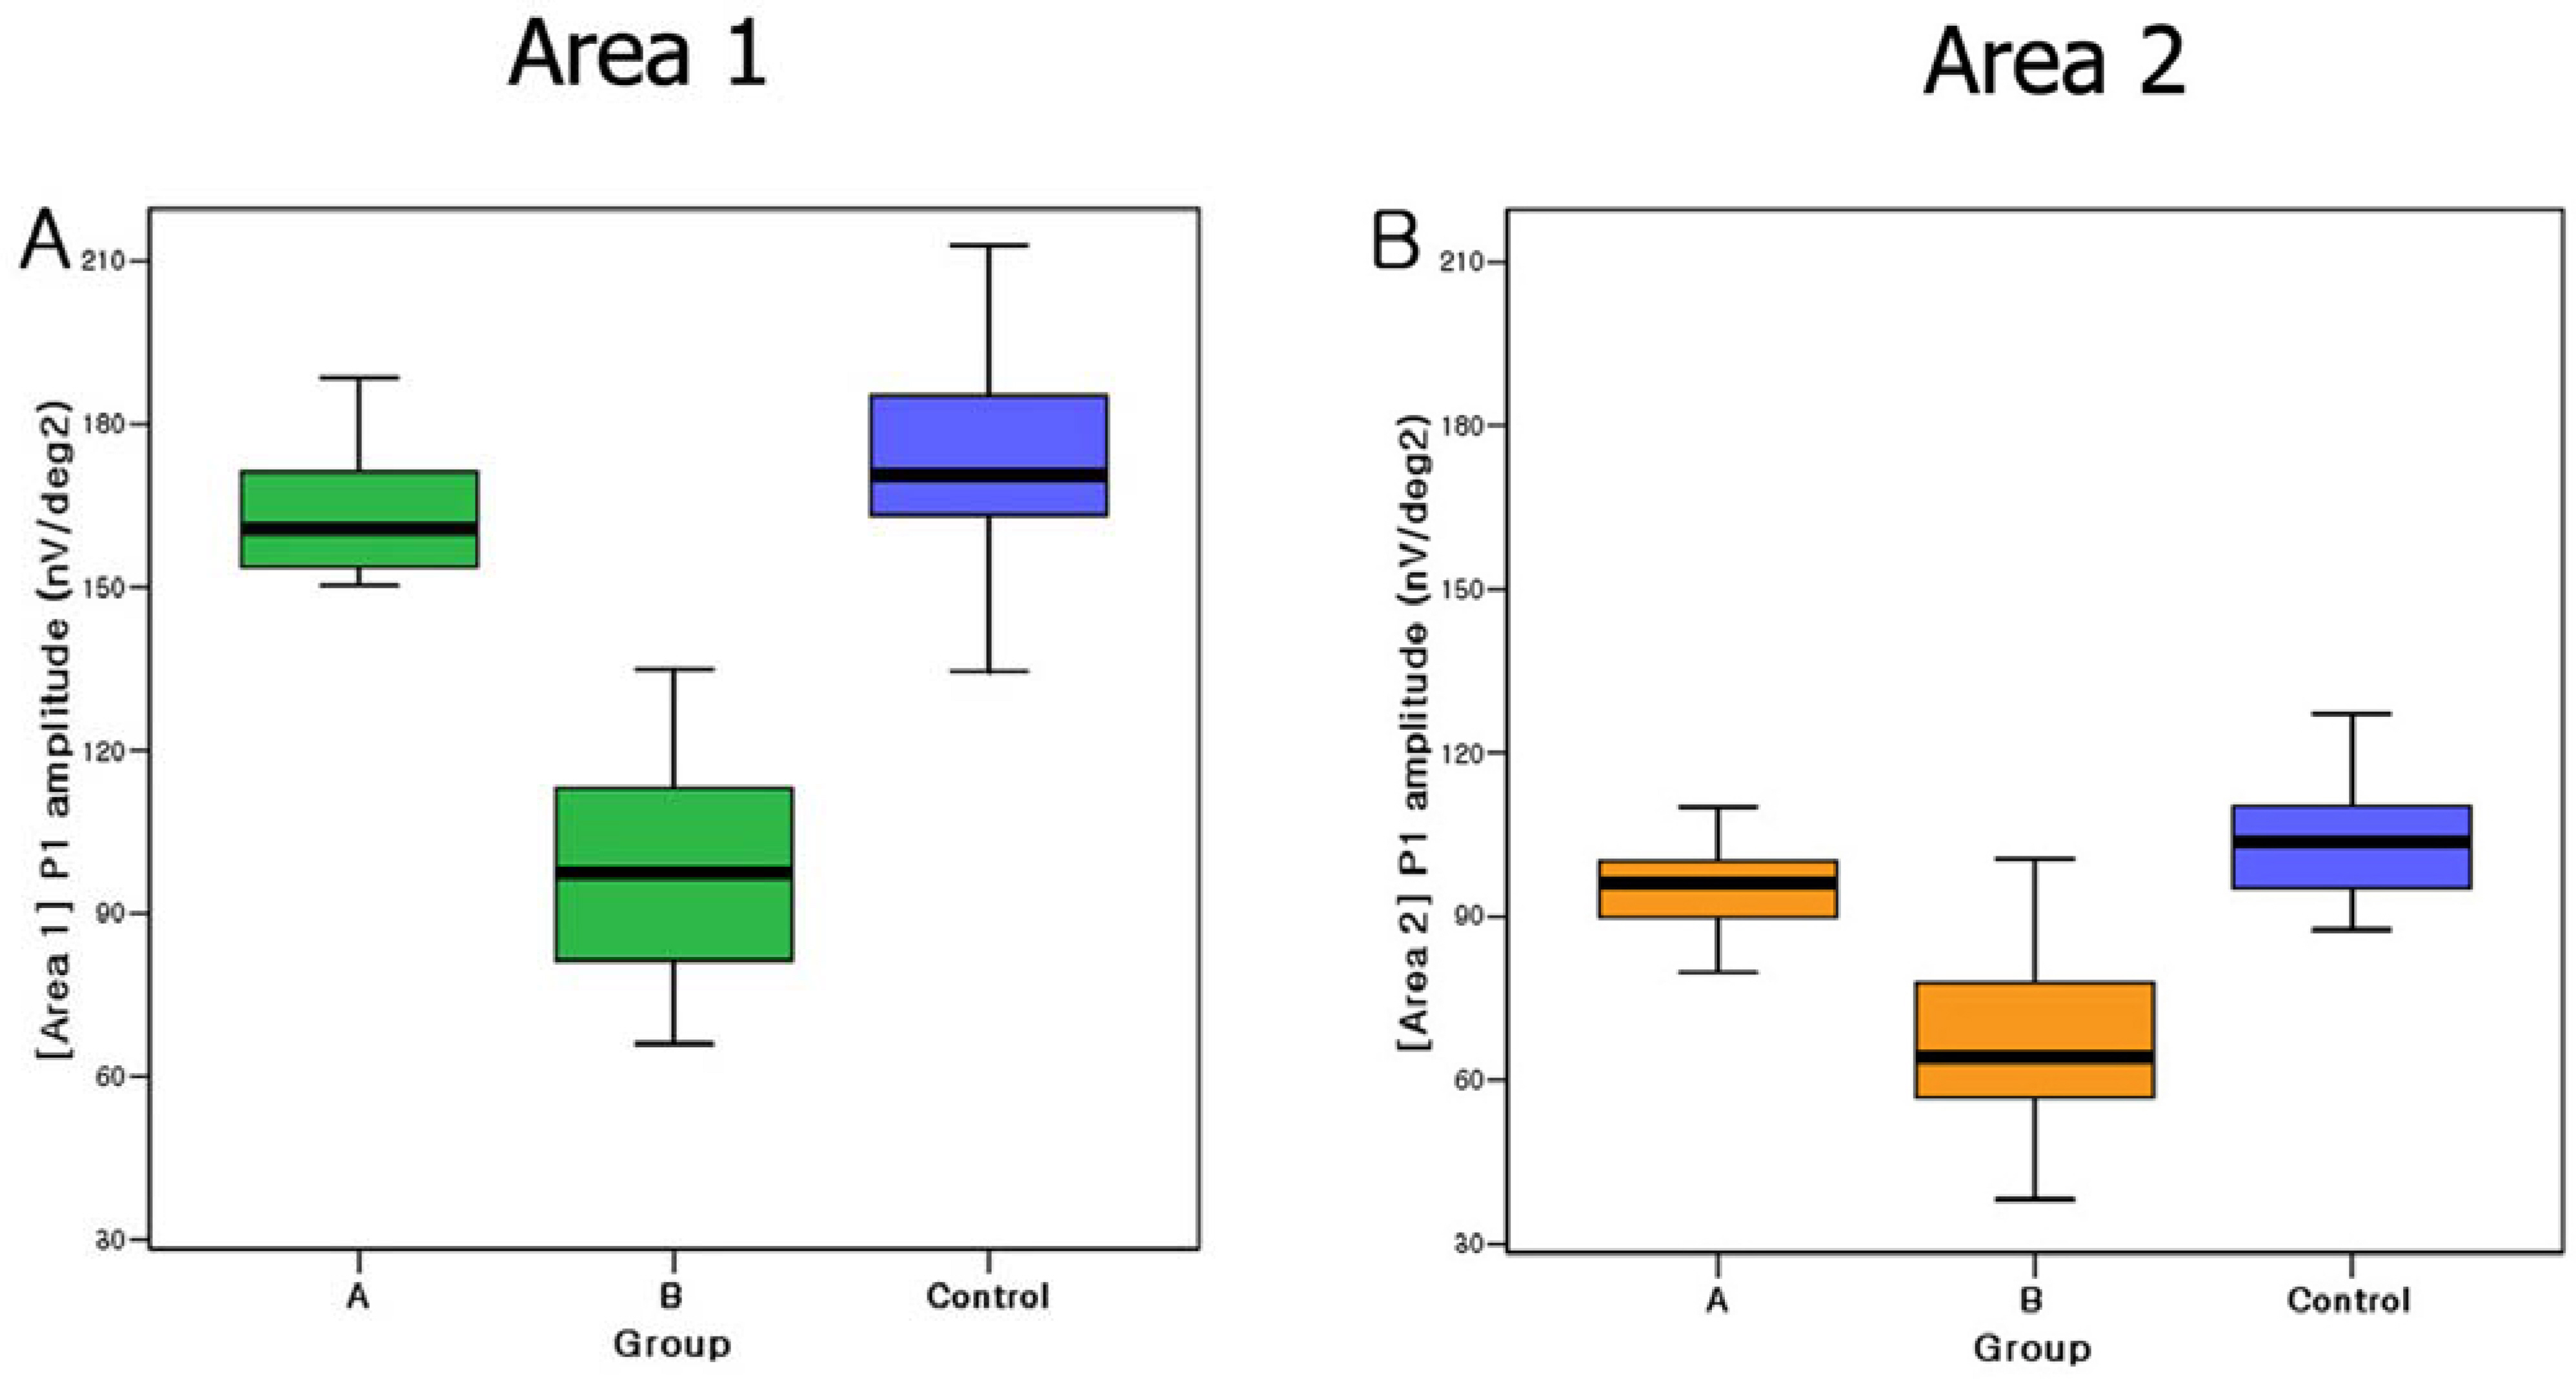
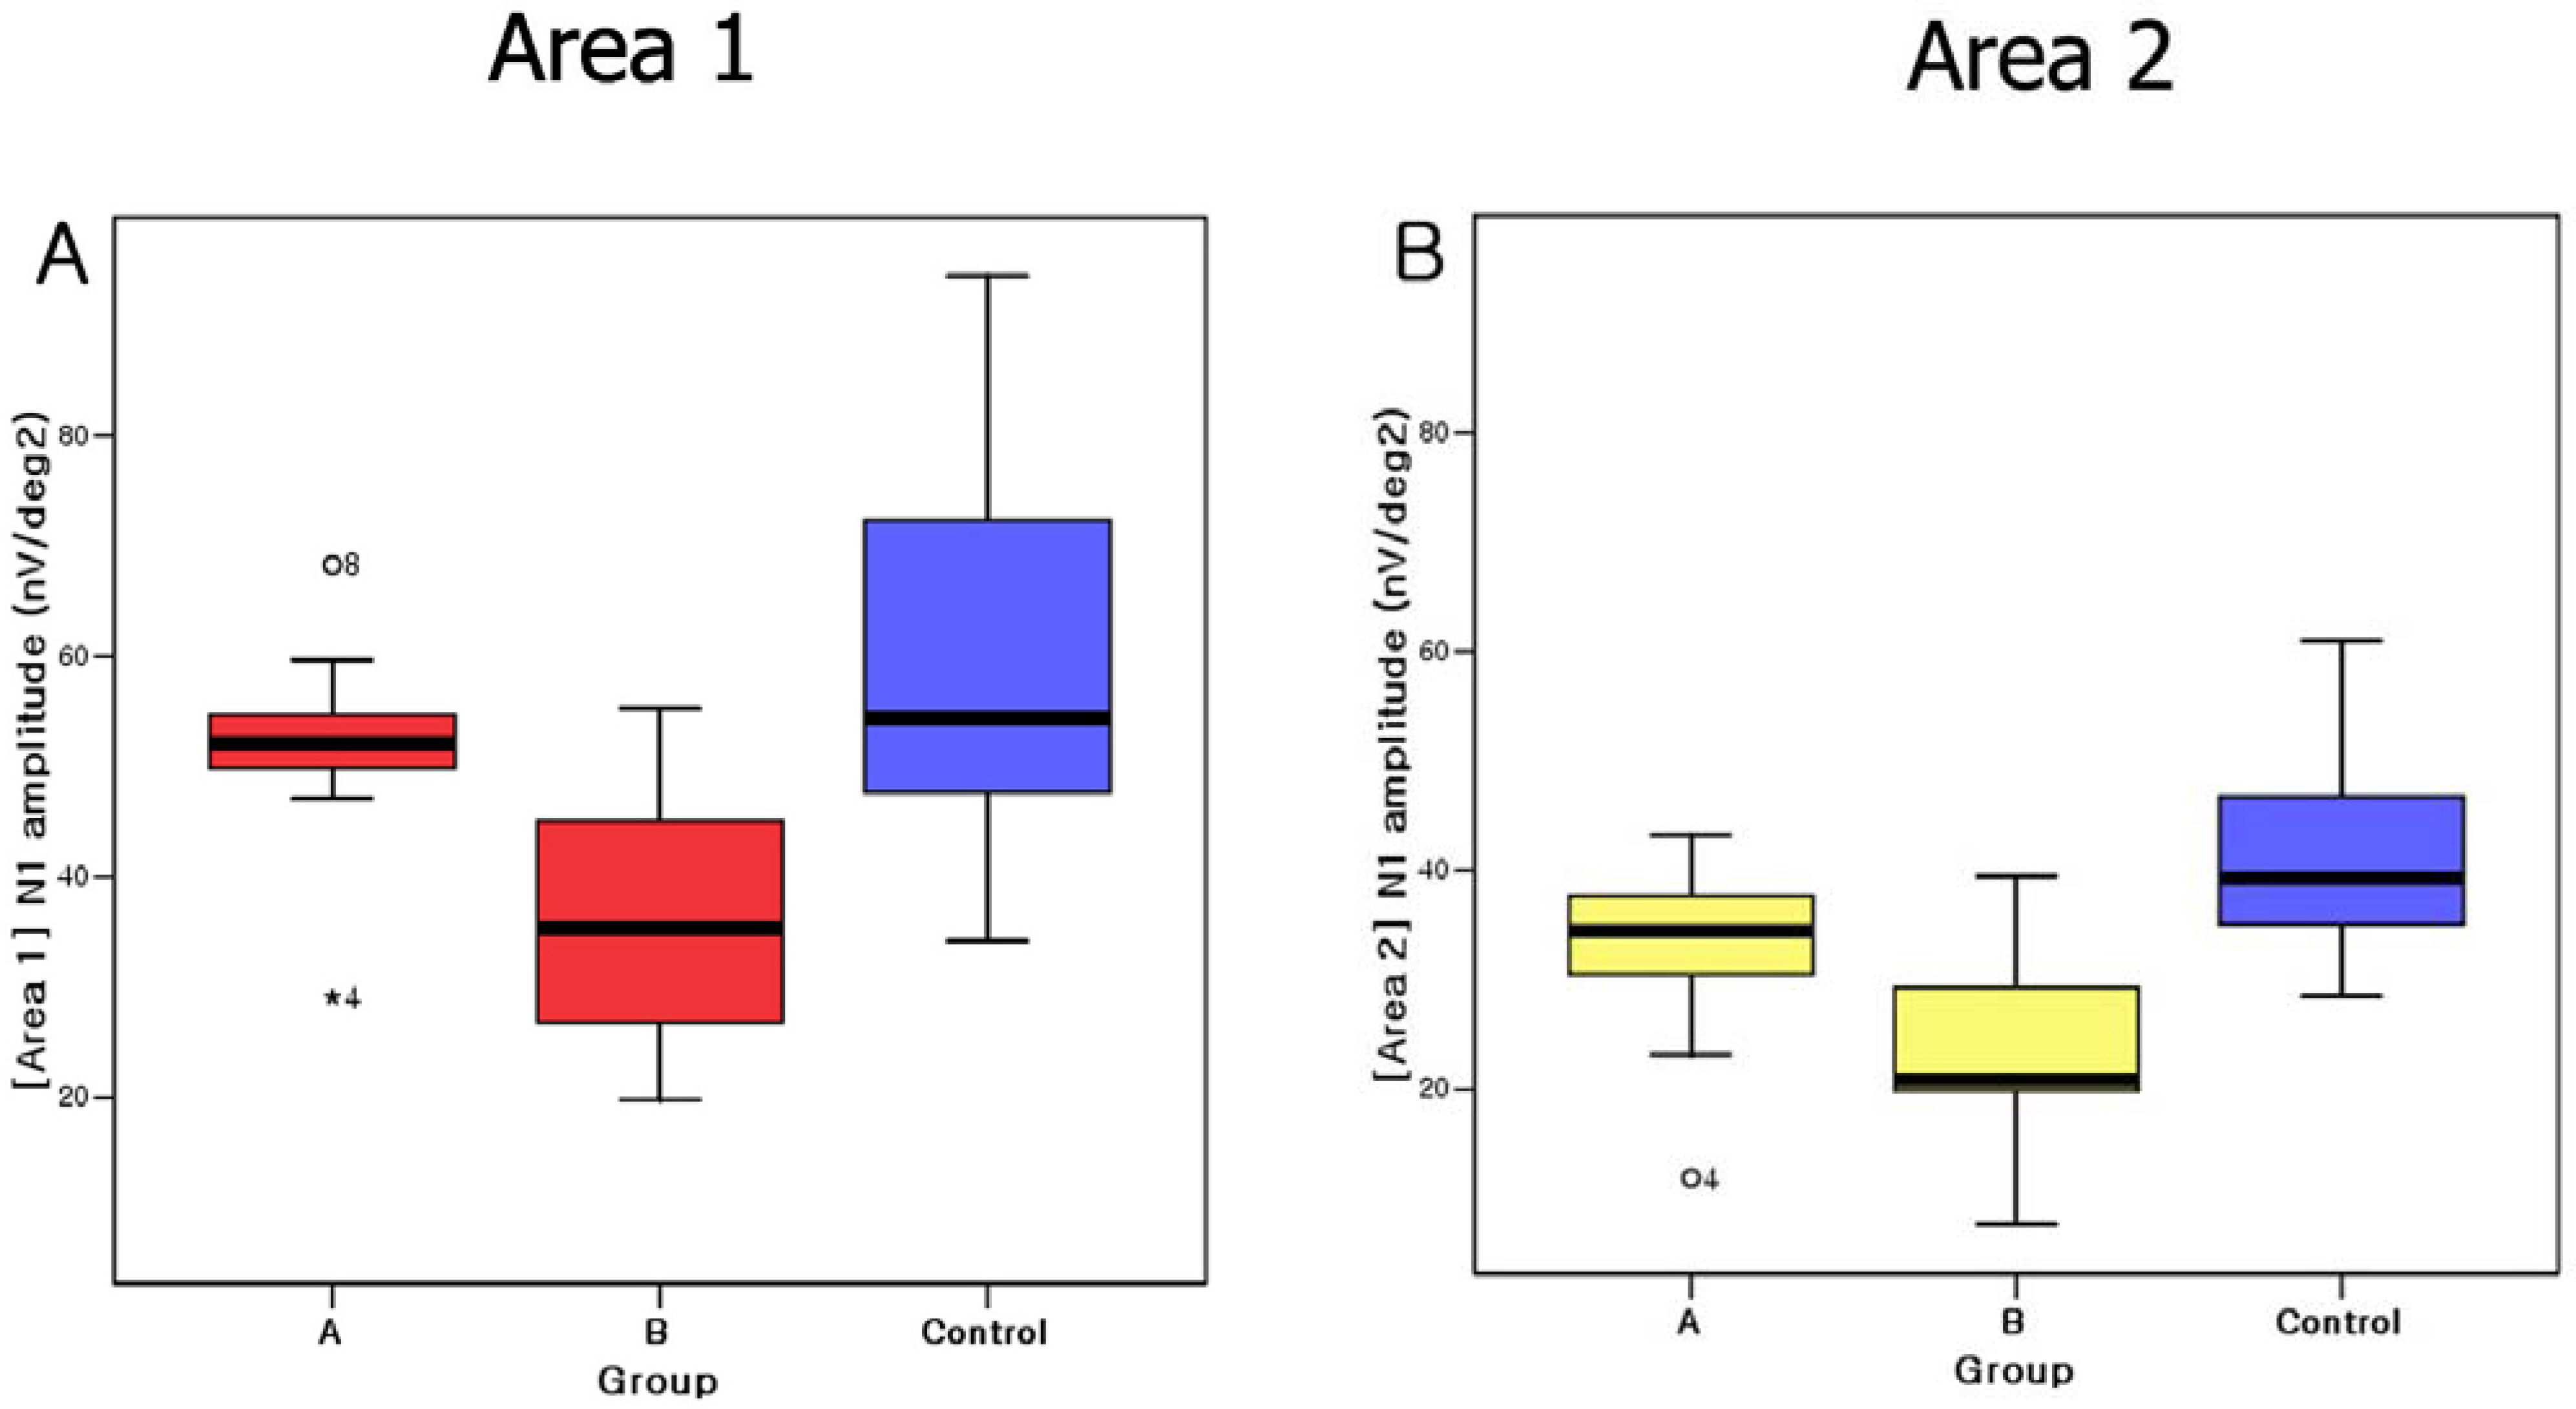
The P1 amplitudes in Area 1 and 2 were significantly different between Group A and B (P<0.05). N1 amplitudes in Area 1 were significantly different between Group A and B (P<0.05), but no significant difference of P1 amplitudes in Area 2 between Group A and B (P>0.05). There were no significant difference of all data between Group A and control in Area 1 and 2 (P>0.05) The implicit times of N1, P1 were not significantly different between Group A and B.
CONCLUSIONS
The DMD plays a key role in recovery of visual function after reattachment. The mfERG is a useful tool to evaluate the recovery of macular function after reattachment of macula-off retinal detachments.
MeSH Terms
Figure
Cited by 1 articles
-
An Analysis of Metamorphopsia Using Preferential Hyperacuity Perimeter Following Macular-off RRD Surgical Repair
Hyun Jun Park, Seung Wook Lee, Kyung Ho Kim, Jung Hyun Lee, Ji Eun Lee, Boo Sup Oum
J Korean Ophthalmol Soc. 2010;51(4):552-557. doi: 10.3341/jkos.2010.51.4.552.
Reference
-
References
1. Burton TC. Recovery of visual acuity after retinal detachments involving the macula. Trans Am Ophthalmol Soc. 1982; 80:475–97.2. Berson EL. Electrical phenomena in the retina. In: Hart WM. Adler's Physiology of the Eye. 9th ed.St, Louis: Mosby Year Book;1992. chap. 21.3. Sutter EE, Tran D. The field topography of ERG components in man-1. The photopic luminance response. Vision Res. 1992; 32:433–46.4. Min WK. Clinical electroretinography in the retinal detachment. J Korean Ophthalmol Soc. 1983; 24:157–64.5. Kim IT, Ha SM, Yoon KC. Electroretinographic studies in rhegmatogenous retinal detachment before and after reattachment surgery. Korean J Ophthalmol. 2001; 15:118–27.
Article6. Kim SD, Maruiwa F, Nao-I N, Sawada A. Focal ERG changes during experimental retinal detachment and spontaneous reattachment in the rabbit. J Korean Ophthalmol Soc. 1992; 33:698–703.7. Anderson DH, Stern WH, Fisher SK, et al. Retinal detachment in the cat: the pigment epithelial-photoreceptor interface. Invest Ophthalmol Vis Sci. 1983; 24:906–26.8. Anderson DH, Stern WH, Fisher SK, et al. The onset of pigment epithelial proliferation after retinal detachment. Invest Ophthalmol Vis Sci. 1981; 21:10–6.9. Anderson DH, Guerin CJ, Erickson PA, et al. Morphological recovery in the reattached retina. Invest Ophthalmol Vis Sci. 1986; 27:168–83.
Article10. Kroll AJ, Machemer R. Experimental retinal detachment in the owl monkey. III. Electron microscopy of retina and pigment epithelium. Am J Ophthalmol. 1968; 66:410–27.11. Cunha-Vaz JG, Fonseca JR, Vieira R. Retinal blood flow in retinal detachment. Mod Probl Ophthalmol. 1979; 20:89–91.12. Tagawa H, Feke GT, Goger DG, et al. Retinal blood flow changes in eyes with rhegmatogenous retinal detachments and scleral buckling procedures. Nippon Ganka Gakkai Zasshi. 1992; 96:259–64.13. Lewis GP, Charteris DG, Sethi CS, et al. The ability of rapid retinal reattachment to stop or reverse the cellular and molecular events initiated by detachment. Invest Ophthalmol Vis Sci. 2002; 43:2412–20.14. Lewis GP, Sethi CS, Linberg KA, et al. Experimental retinal reattachment: a new perspective. Mol Neurobiol. 2003; 28:159–75.
Article15. Kretschmann U, Bock M, Gockeln R, Zrenner E. Clinical applications of multifocal electroretinography. Doc Ophthalmol. 2000; 100:99–113.16. Schatz P, Holm K, Andreasson S. Retinal function after scleral buckling for recent onset rhegmatogenous retinal detachment: assessment with electroretinography and optical coherence tomography. Retina. 2007; 27:30–6.17. Wu D, Gao R, Zhang G, Wu L. Comparison of pre- and post-operational multifocal electroretinograms of retinal detachment. Chin Med J. 2002; 115:1560–3.18. Moschos M, Mallias J, Ladas I, et al. Multifocal ERG in retinal detachment surgery. Eur J Ophthalmol. 2001; 11:296–300.19. Davies EW. Factors affecting recovery of visual acuity following detachment of the retina. Trans Ophthalmol Soc U K. 1972; 92:335–44.20. Gundry MF, Davies EW. Recovery of visual acuity after retinal detachment surgery. Am J Ophthalmol. 1974; 77:310–4.
Article21. Kreissig I. Prognosis of return of macular function after retinal reattachment. Mod Probl Ophthalmol. 1977; 18:415–29.22. Grupposo SS. Visual acuity following surgery for retinal detachment. Arch Ophthalmol. 1975; 93:327–30.
Article23. Ross WH, Kozy DW. Visual recovery in macula-off rhegmatogenous retinal detachments. Ophthalmology. 1998; 105:2149–53.
Article24. Lee YD, Bae SR. Normal values of positive wave in the multifocal electroretinography in Korean. J Korean Ophthalmol Soc. 2000; 44:850–6.25. Liem AT, Keunen JE, van Meel GJ, van Norren D. Serial foveal densitometry and visual function after retinal detachment surgery with macular involvement. Ophthalmology. 1994; 101:1945–52.
Article
- Full Text Links
- Actions
-
Cited
- CITED
-
- Close
- Share
- Similar articles
-
- Visual Prognosis and Foveal Reattachment After Reattachment Surgery in Macula-off Retinal Detachment
- Factors Affecting the Visual Outcome after Successful Retinal Reattachment Surgery in Rhegmatogenous Retinal Detachment Involving the Macula
- Foveal Reattachment After Scleral Buckling vs Vitrectomy for Macula-Off Retinal Detachment
- The Usefulness of Optical Coherence Tomography in Macula-off Retinal Detachment
- Rhegmatogenous Retinal Detachment with Spared Macula


