Current Status of 3-Dimensional Speckle Tracking Echocardiography: A Review from Our Experiences
- Affiliations
-
- 1Cardiovascular Division, Faculty of Clinical Medicine, University of Tsukuba, Tsukuba, Japan. yo-seo@md.tsukuba.ac.jp
- KMID: 2177459
- DOI: http://doi.org/10.4250/jcu.2014.22.2.49
Abstract
- Cardiac function analysis is the main focus of echocardiography. Left ventricular ejection fraction (LVEF) has been the clinical standard, however, LVEF is not enough to investigate myocardial function. For the last decade, speckle tracking echocardiography (STE) has been the novel clinical tool for regional and global myocardial function analysis. However, 2-dimensional imaging methods have limitations in assessing 3-dimensional (3D) cardiac motion. In contrast, 3D echocardiography also has been widely used, in particular, to measure LV volume measurements and assess valvular diseases. Joining the technology bandwagon, 3D-STE was introduced in 2008. Experimental studies and clinical investigations revealed the reliability and feasibility of 3D-STE-derived data. In addition, 3D-STE provides a novel deformation parameter, area change ratio, which have the potential for more accurate assessment of overall and regional myocardial function. In this review, we introduced the features of the methodology, validation, and clinical application of 3D-STE based on our experiences for 7 years.
Figure
-
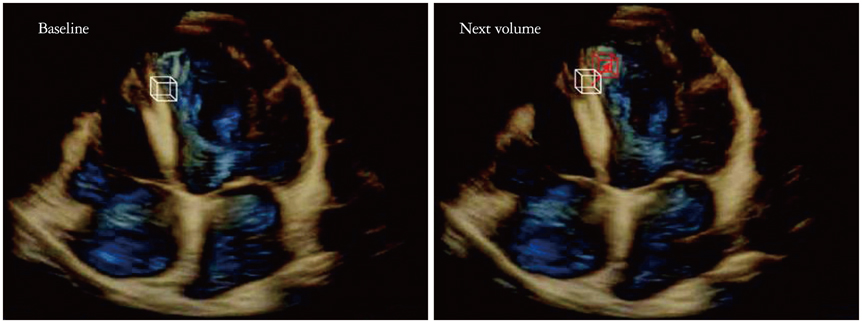
Fig. 1 Speckle tracking with cubic template. The 3-dimensional speckle tracking method of the volume of interest (white line cubic template) from one volume (baseline volume) to the next volume (red line cubic template).
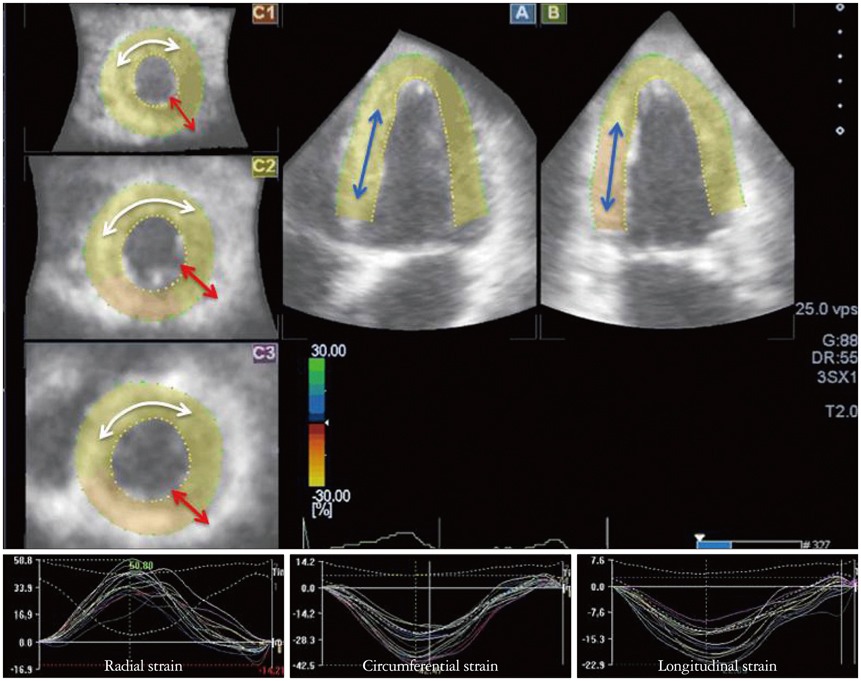
Fig. 2 Parametric images of multiplanar reconstruction (MPR) and strain-time curves. On MPR images (upper panel), radial (red arrow), circumferential (white arrow), and longitudinal strain (blue arrow) are shown. Under panels show each strain-time curve.
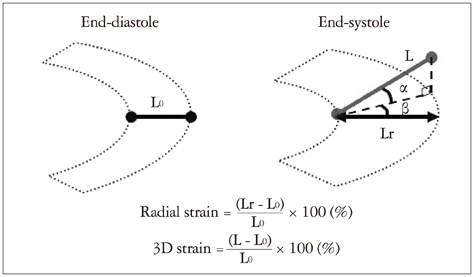
Fig. 3 3D-strain. The figures show deformation including shear strain. L0 means a baseline length between endo- and epicardium. Radial strain is calculated as (Lr - L0) / L0. If the shear (α degree) is caused between radial and longitudinal direction, the shear (β degree) is caused between radial and circumferential direction, and without shear between circumferential and longitudinal direction, the length between estimated endo- and epicardial points at end-systole is L. The novel parameter 3D-strain is calculated as (L - L0) / L0, then, 3D-strain is greater than 3D-radial strain because L is longer than Lr.
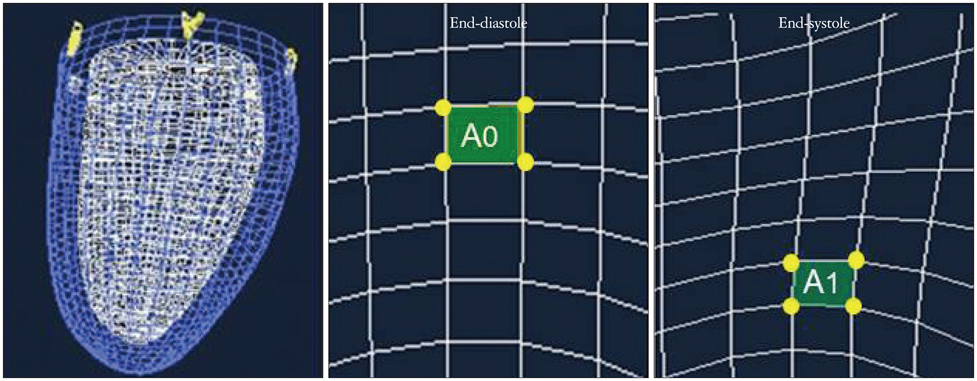
Fig. 4 Area change ratio. The mid and right panels are the endocardial surface at end-diastole and systole, respectively. An area A0 is relocated and deformed to an area A1 by various wall motions including apical translation, regional rotation that causes shear strain, and longitudinal and circumferential contractions. The area change ratio is calculated as (A1 - A0) / A0.
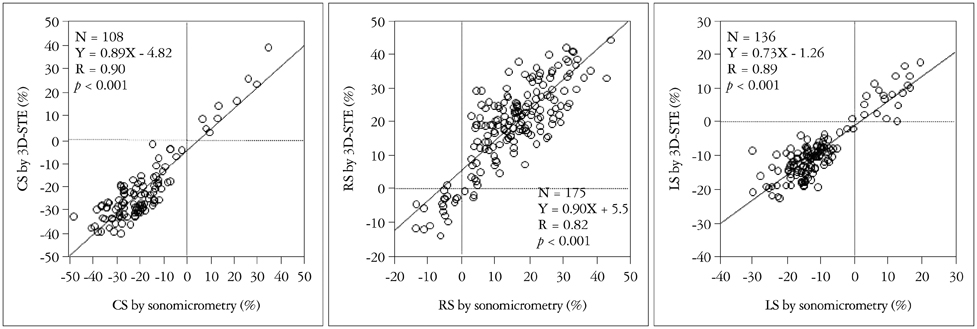
Fig. 5 The relation between strain by sonomicrometry and 3-dimensional speckle tracking echocardiography (3D-STE). CS: circumferential strain, RS: radial strain, LS: longitudinal strain.
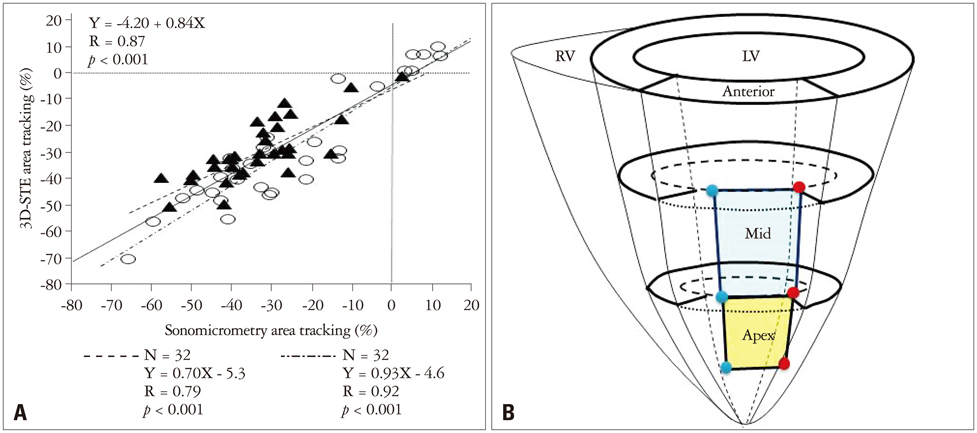
Fig. 6 The relation between area change ratio by sonomicrometry and 3-dimensional speckle tracking echocardiography. A: Scatter plot showing the relation between all measurements of area tracking by sonomicrometry and 3-dimensional speckle tracking echocardiography (3D-STE). The solid line shows a regression line of all measurements. The dashed dotted line shows a regression line at apex area (○). The dashed line shows a regression line at mid area (▴). B: Scheme of implanted positions of sonomicrometry crystals. Red and blue dots show each crystal position, and the blue area is a region area of mid anterior wall, and the yellow one is a region of apical one.
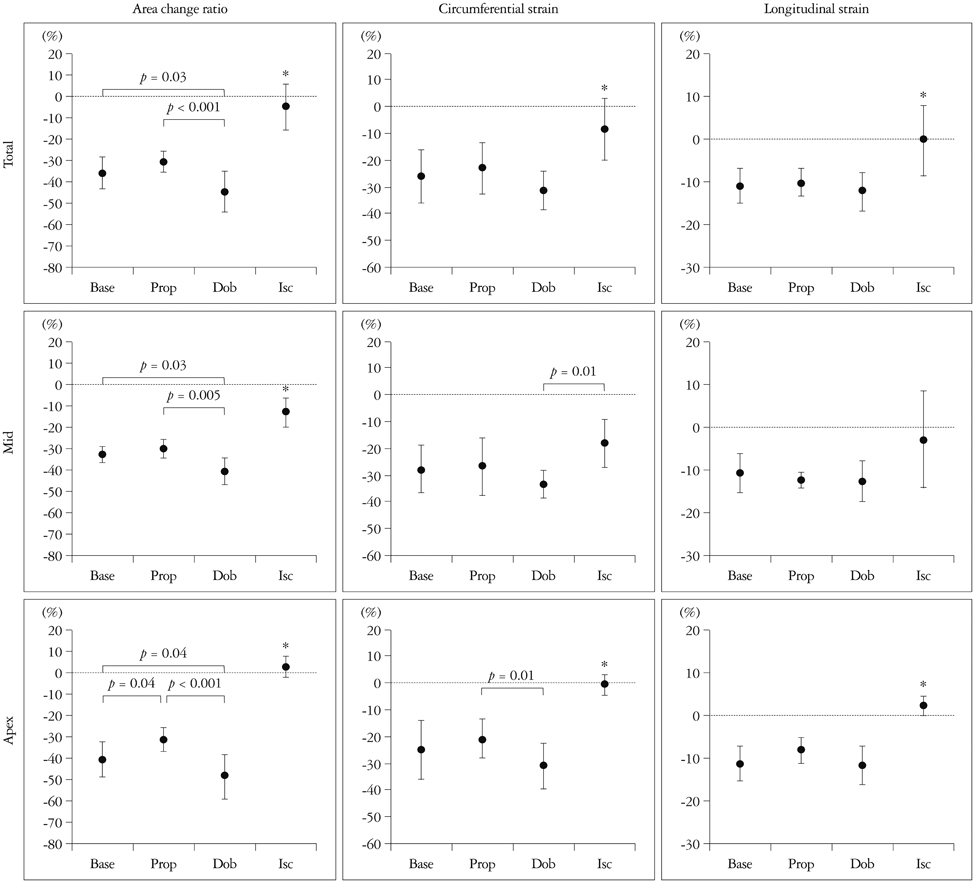
Fig. 7 Comparisons of area change ratio, circumferential strain, and longitudinal strain during baseline (Base), propranolol infusion (Prop), dobutamine infusion (Dob), and acute ischemia (Isc). Upper panels are corresponding to total data (Total), mid ones to mid anterior wall (Mid), and bottom ones to apical anterior wall (Apex). Area change ratio clearly distinguished changes in myocardial function induced by pharmacological stress and acute ischemia in both mid and apical anterior wall. *p < 0.001 vs. others.
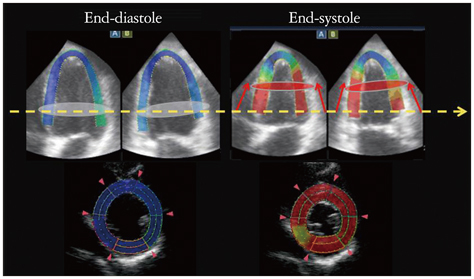
Fig. 8 Out of plane phenomenon. Upper panels are 4 chamber and 2 chamber views at end-diastole and systole in a healthy subject. The color shows degree of longitudinal displacements during systole. White discs at end-diastole are moved to red discs level at end-systole, which distance is about 15 mm (red arrows). Lower panels show the 2-dimensional speckle tracking echocardiography (2D-STE) images at yellow dash arrow level. Since the white disc level is moved to apex at end-systole, the 2D-STE image at end-systole is changed to another plane of a basal level at end-diastole. Such changing of the plane of interest through a cardiac cycle is called as out of plane phenomenon.
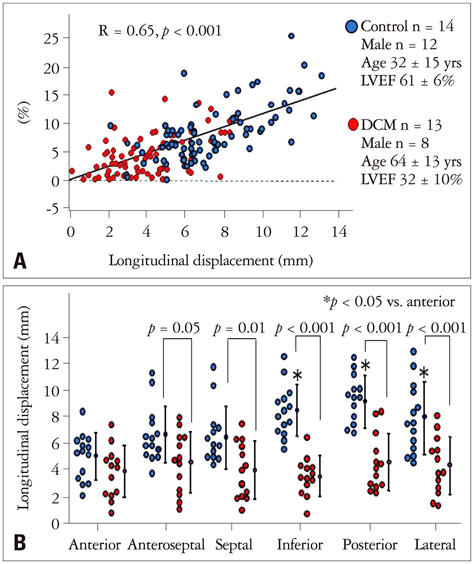
Fig. 9 The affects of longitudinal displacements for the 2D- and 3D-circumferential strain (CS). Panel A shows the correlation between longitudinal displacement and the absolute differences between 2D- and 3D-CS. Panel B shows left ventricular segmental comparisons of longitudinal displacements between control (blue dots) and DCM (red dots). DCM: idiopathic dilated cardiomyopathy, LVEF: left ventricular ejection fraction.
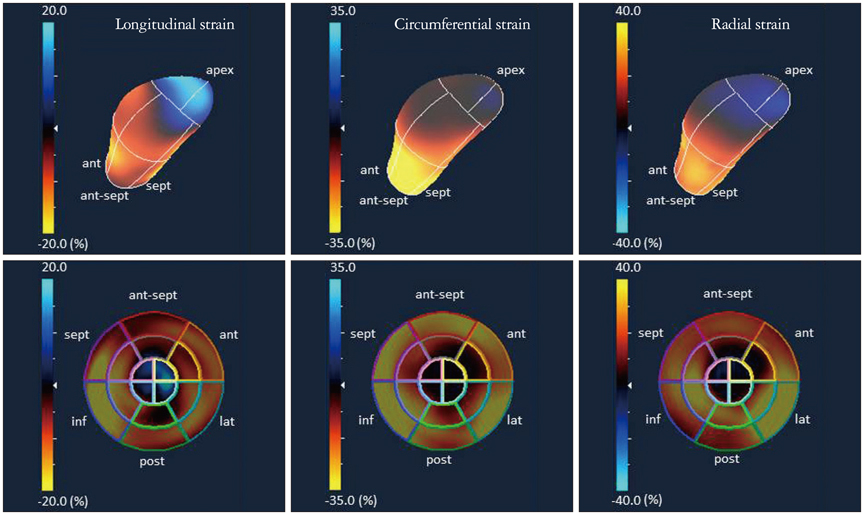
Fig. 10 Regional wall motion abnormalities with 3-dimensional speckle tracking echocardiography. These images were obtained at experimental studies. Upper panels show plastic bag images and lower ones show polar map images at end-systole showing longitudinal strain (left panel), circumferential strain (central panel), and radial strain (right panel) during a coronary artery occlusion study. The blue area in the apex in each panel corresponds to dyskinetic motion induced by coronary artery occlusion.
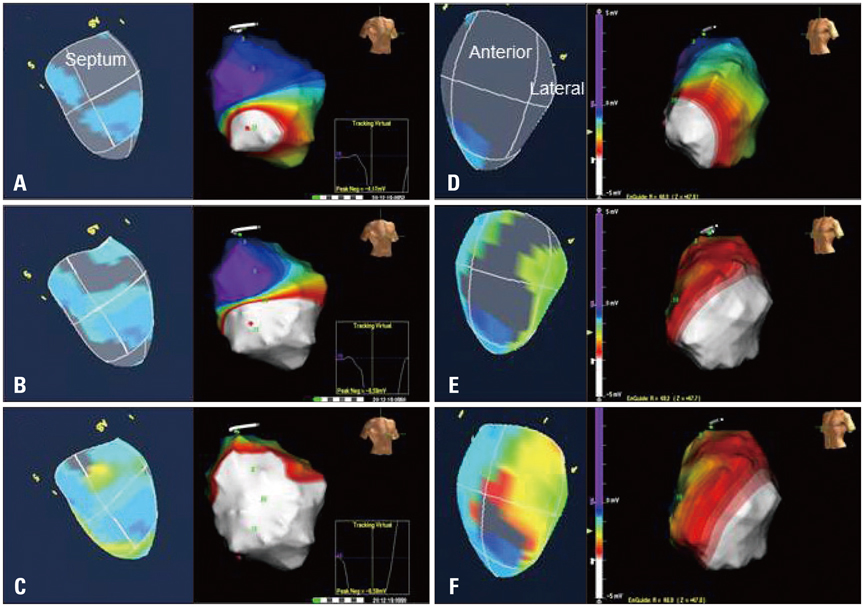
Fig. 11 Comparisons of activation propagation in left bundle branch block. Left figures show activation images by 3-dimensional speckle tracking echocardiography (3D-STE) and right ones show propagation images by Ensite voltage mapping system in each panel from A to F. Panels A to C show the images from septum, and blue areas in the 3D-STE are the earliest contraction sites. White areas in the Ensite images are the electrical activation area. Panels D to F show the images from free wall, and yellow or orange areas are the latest contraction sites. Note the U shape propagation with functional block area in anterior wall.
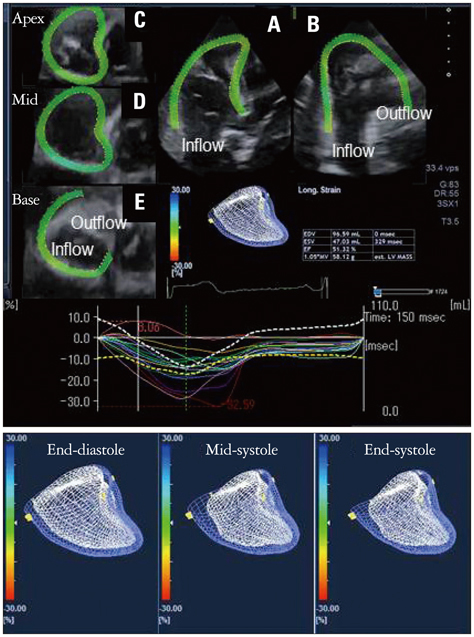
Fig. 12 Right ventricular 3-dimensional speckle tracking echocardi-ography (3D-STE) images. Panels A to E show right ventricular (RV) multiplanar reconstruction images in a healthy subject; short axis view of apex (C), mid (D), base (E), apical 4 chamber view (A) and its orthogonal view (B). 3D-STE images using mesh imaging, and time area change ratio curves also are shown. The lower left panel shows the RV-STE at end-diastole, the center panel at mid-systole, and the right panel at end-systole.
Reference
-
1. Leitman M, Lysyansky P, Sidenko S, Shir V, Peleg E, Binenbaum M, Kaluski E, Krakover R, Vered Z. Two-dimensional strain-a novel software for real-time quantitative echocardiographic assessment of myocardial function. J Am Soc Echocardiogr. 2004; 17:1021–1029.
Article2. Perk G, Tunick PA, Kronzon I. Non-Doppler two-dimensional strain imaging by echocardiography--from technical considerations to clinical applications. J Am Soc Echocardiogr. 2007; 20:234–243.
Article3. Kawagishi T. Speckle tracking for assessment of cardiac motion and dyssynchrony. Echocardiography. 2008; 25:1167–1171.
Article4. Elen A, Choi HF, Loeckx D, Gao H, Claus P, Suetens P, Maes F, D'hooge J. Three-dimensional cardiac strain estimation using spatio-temporal elastic registration of ultrasound images: a feasibility study. IEEE Trans Med Imaging. 2008; 27:1580–1591.
Article5. Crosby J, Amundsen BH, Hergum T, Remme EW, Langeland S, Torp H. 3-D speckle tracking for assessment of regional left ventricular function. Ultrasound Med Biol. 2009; 35:458–471.
Article6. Takeguchi T, Nishiura M, Abe Y, Ohuchi H, Kawagishi T. Practical considerations for a method of rapid cardiac function analysis based on three-dimensional speckle tracking in a three-dimensional diagnostic ultrasound system. J Med Ultrason. 2010; 37:41–49.
Article7. Geyer H, Caracciolo G, Abe H, Wilansky S, Carerj S, Gentile F, Nesser HJ, Khandheria B, Narula J, Sengupta PP. Assessment of myocardial mechanics using speckle tracking echocardiography: fundamentals and clinical applications. J Am Soc Echocardiogr. 2010; 23:351–369. quiz 453-5.
Article8. Seo Y, Ishizu T, Enomoto Y, Sugimori H, Yamamoto M, Machino T, Kawamura R, Aonuma K. Validation of 3-dimensional speckle tracking imaging to quantify regional myocardial deformation. Circ Cardiovasc Imaging. 2009; 2:451–459.
Article9. Duan Q, Parker KM, Lorsakul A, Angelini ED, Hyodo E, Homma S, Holmes JW, Laine AF. Quantitative validation of optical flow based myocardial strain measures using sonomicrometry. Proc IEEE Int Symp Biomed Imaging. 2009; 2009:454–457.
Article10. Yodwut C, Weinert L, Klas B, Lang RM, Mor-Avi V. Effects of frame rate on three-dimensional speckle-tracking-based measurements of myocardial deformation. J Am Soc Echocardiogr. 2012; 25:978–985.
Article11. Lang RM, Bierig M, Devereux RB, Flachskampf FA, Foster E, Pellikka PA, Picard MH, Roman MJ, Seward J, Shanewise JS, Solomon SD, Spencer KT, Sutton MS, Stewart WJ. Chamber Quantification Writing Group. American Society of Echocardiography's Guidelines and Standards Committee. European Association of Echocardiography. Recommendations for chamber quantification: a report from the American Society of Echocardiography's Guidelines and Standards Committee and the Chamber Quantification Writing Group, developed in conjunction with the European Association of Echocardiography, a branch of the European Society of Cardiology. J Am Soc Echocardiogr. 2005; 18:1440–1463.
Article12. Jasaityte R, Heyde B, D'hooge J. Current state of three-dimensional myocardial strain estimation using echocardiography. J Am Soc Echocardiogr. 2013; 26:15–28.
Article13. Seo Y, Ishizu T, Enomoto Y, Sugimori H, Aonuma K. Endocardial surface area tracking for assessment of regional LV wall deformation with 3D speckle tracking imaging. JACC Cardiovasc Imaging. 2011; 4:358–365.
Article14. Heyde B, Bouchez S, Thieren S, Vandenheuvel M, Jasaityte R, Barbosa D, Claus P, Maes F, Wouters P, D'Hooge J. Elastic image registration to quantify 3-D regional myocardial deformation from volumetric ultrasound: experimental validation in an animal model. Ultrasound Med Biol. 2013; 39:1688–1697.
Article15. Ashraf M, Zhou Z, Nguyen T, Ashraf S, Sahn DJ. Apex to base left ventricular twist mechanics computed from high frame rate two-dimensional and three-dimensional echocardiography: a comparison study. J Am Soc Echocardiogr. 2012; 25:121–128.
Article16. Kawamura R, Seo Y, Ishizu T, Atsumi A, Yamamoto M, Machino-Ohtsuka T, Nakajima H, Sakai S, Tanaka YO, Minami M, Aonuma K. Feasibility of left ventricular volume measurements by three-dimensional speckle tracking echocardiography depends on image quality and degree of left ventricular enlargement: validation study with cardiac magnetic resonance imaging. J Cardiol. 2014; 63:230–238.
Article17. Nesser HJ, Mor-Avi V, Gorissen W, Weinert L, Steringer-Mascherbauer R, Niel J, Sugeng L, Lang RM. Quantification of left ventricular volumes using three-dimensional echocardiographic speckle tracking: comparison with MRI. Eur Heart J. 2009; 30:1565–1573.
Article18. Saito K, Okura H, Watanabe N, Hayashida A, Obase K, Imai K, Maehama T, Kawamoto T, Neishi Y, Yoshida K. Comprehensive evaluation of left ventricular strain using speckle tracking echocardiography in normal adults: comparison of three-dimensional and two-dimensional approaches. J Am Soc Echocardiogr. 2009; 22:1025–1030.
Article19. Maffessanti F, Nesser HJ, Weinert L, Steringer-Mascherbauer R, Niel J, Gorissen W, Sugeng L, Lang RM, Mor-Avi V. Quantitative evaluation of regional left ventricular function using three-dimensional speckle tracking echocardiography in patients with and without heart disease. Am J Cardiol. 2009; 104:1755–1762.
Article20. Hayat D, Kloeckner M, Nahum J, Ecochard-Dugelay E, Dubois-Randé JL, Jean-François D, Guéret P, Lim P. Comparison of real-time three-dimensional speckle tracking to magnetic resonance imaging in patients with coronary heart disease. Am J Cardiol. 2012; 109:180–186.
Article21. Matsumoto K, Tanaka H, Kaneko A, Ryo K, Fukuda Y, Tatsumi K, Kawai H, Hirata K. Contractile reserve assessed by three-dimensional global circumferential strain as a predictor of cardiovascular events in patients with idiopathic dilated cardiomyopathy. J Am Soc Echocardiogr. 2012; 25:1299–1308.
Article22. Wu VC, Takeuchi M, Otani K, Haruki N, Yoshitani H, Tamura M, Abe H, Lin FC, Otsuji Y. Effect of through-plane and twisting motion on left ventricular strain calculation: direct comparison between two-dimensional and three-dimensional speckle-tracking echocardiography. J Am Soc Echocardiogr. 2013; 26:1274–1281.e4.
Article23. Luo XX, Fang F, Lee AP, Sun JP, Li S, Zhang ZH, Sanderson JE, Kwong JS, Zhang Q, Wang J, Yu CM. What can three-dimensional speckle-tracking echocardiography contribute to evaluate global left ventricular systolic performance in patients with heart failure? Int J Cardiol. 2014; 172:132–137.
Article24. Seo Y, Ishizu T, Atsumi A, Kawamura R, Aonuma K. Three-dimensional speckle tracking echocardiography. Circ J. 2014; 78:1290–1301.
Article25. Ishizu T, Seo Y, Kameda Y, Kawamura R, Kimura T, Shimojo N, Xu D, Murakoshi N, Aonuma K. Left ventricular strain and transmural distribution of structural remodeling in hypertensive heart disease. Hypertension. 2014; 63:500–506.
Article26. Galderisi M, Esposito R, Schiano-Lomoriello V, Santoro A, Ippolito R, Schiattarella P, Strazzullo P, de Simone G. Correlates of global area strain in native hypertensive patients: a three-dimensional speckle-tracking echocardiography study. Eur Heart J Cardiovasc Imaging. 2012; 13:730–738.
Article27. Li CM, Li C, Bai WJ, Zhang XL, Tang H, Qing Z, Li R. Value of three-dimensional speckle-tracking in detecting left ventricular dysfunction in patients with aortic valvular diseases. J Am Soc Echocardiogr. 2013; 26:1245–1252.
Article28. Miyoshi T, Tanaka H, Kaneko A, Tatsumi K, Matsumoto K, Minami H, Kawai H, Hirata KI. Left Ventricular Endocardial Dysfunction in Patients with Preserved Ejection Fraction after Receiving Anthracycline. Echocardiography. 2013; {Epub ahead of print}.
Article29. Kleijn SA, Aly MF, Terwee CB, van Rossum AC, Kamp O. Three-dimensional speckle tracking echocardiography for automatic assessment of global and regional left ventricular function based on area strain. J Am Soc Echocardiogr. 2011; 24:314–321.
Article30. Baccouche H, Maunz M, Beck T, Fogarassy P, Beyer M. Echocardiographic assessment and monitoring of the clinical course in a patient with Tako-Tsubo cardiomyopathy by a novel 3D-speckle-tracking-strain analysis. Eur J Echocardiogr. 2009; 10:729–731.
Article31. Seo Y, Yamasaki H, Kawamura R, Ishizu T, Igarashi M, Sekiguchi Y, Tada H, Aonuma K. Left ventricular activation imaging by 3-dimensional speckle-tracking echocardiography. Comparison with electrical activation mapping. Circ J. 2013; 77:2481–2489.
Article32. Auricchio A, Fantoni C, Regoli F, Carbucicchio C, Goette A, Geller C, Kloss M, Klein H. Characterization of left ventricular activation in patients with heart failure and left bundle-branch block. Circulation. 2004; 109:1133–1139.
Article33. Kjaergaard J, Akkan D, Iversen KK, Køber L, Torp-Pedersen C, Hassager C. Right ventricular dysfunction as an independent predictor of short- and long-term mortality in patients with heart failure. Eur J Heart Fail. 2007; 9:610–616.
Article34. Chrysohoou C, Antoniou CK, Kotrogiannis I, Metallinos G, Aggelis A, Andreou I, Brili S, Pitsavos C, Stefanadis C. Role of right ventricular systolic function on long-term outcome in patients with newly diagnosed systolic heart failure. Circ J. 2011; 75:2176–2181.
Article35. Guendouz S, Rappeneau S, Nahum J, Dubois-Randé JL, Gueret P, Monin JL, Lim P, Adnot S, Hittinger L, Damy T. Prognostic significance and normal values of 2D strain to assess right ventricular systolic function in chronic heart failure. Circ J. 2012; 76:127–136.
Article36. Atsumi A, Ishizu T, Kameda Y, Yamamoto M, Harimura Y, Machino-Ohtsuka T, Kawamura R, Enomoto M, Seo Y, Aonuma K. Application of 3-dimensional speckle tracking imaging to the assessment of right ventricular regional deformation. Circ J. 2013; 77:1760–1768.
Article37. Gayat E, Ahmad H, Weinert L, Lang RM, Mor-Avi V. Reproducibility and inter-vendor variability of left ventricular deformation measurements by three-dimensional speckle-tracking echocardiography. J Am Soc Echocardiogr. 2011; 24:878–885.
Article
- Full Text Links
-
- Actions
-
Cited
- CITED
-
- Close
- Share
-
- Similar articles
-
- Two-Dimensional Speckle-Tracking Echocardiography in Normal Korean Population: Is Now to Start Using in Routine Clinical Practice?
- Two-dimensional speckle-tracking of antral contraction in dogs
- Morning blood pressure surge in the early stage of hypertensive patients impacts three-dimensional left ventricular speckle tracking echocardiography
- Speckle-tracking analysis of myocardial deformation in correlation to age in healthy horses
- The Clinical Application of ThreeDimensional Speckle Tracking Echocardiography and Two-Dimensional Echocardiography for Left Ventricular and Right Ventricular Assessment in Patients With Septic Cardiomyopathy
