Comparison of Superparamagnetic Iron Oxide Labeling Efficiency between Poly-L-Lysine and Protamine Sulfate for Human Mesenchymal Stem Cells: Quantitative Analysis Using Multi-Echo T2* Magnetic Resonance Imaging
- Affiliations
-
- 1Department of Radiology and Research Institute of Radiology, University of Ulsan College of Medicine, Asan Medical Center, Seoul, Korea. jeonghlee@hanmir.com
- 2MRI Team, Korea Basic Science Institute, Daejeon, Korea.
- KMID: 2097996
- DOI: http://doi.org/10.3348/jksr.2013.68.2.175
Abstract
- PURPOSE
To quantify in vitro labeling efficiency of protamine sulfate (PS) and poly-L-lysine (PLL) for labeling of human mesenchymal stem cells (hMSCs) with superparamagnetic iron oxide (SPIO) using multi-echo T2* magnetic resonance (MR) imaging at 4.7 T.
MATERIALS AND METHODS
The hMSCs were incubated with SPIO-PS or SPIO-PLL complexes. Their effects on the cell metabolism and differentiation capability were evaluated, respectively. The decrease of iron concentrations in the labeled cells were assessed immediately, and at 4 d after labeling using multi-echo T2* MR imaging at 4.7 T. The results were compared with those of Prussian blue colorimetry.
RESULTS
The hMSCs were labeled more efficiently by SPIO-PLL than SPIO-PS without any significant effect on cell metabolism and differentiation capabilities. It was feasible to quantify the iron concentrations in SPIO-agarose-phantoms and in agarose mixture with the labeled cells from T2* maps obtained from multi-echo T2* MRI. However, the iron concentration of the labeled cells was significantly higher by T2*-maps than the results of Prussian blue colorimetry.
CONCLUSION
The hMSCs can be effectively labeled with SPIO-PLL complexes more than with SPIO-PS without significant change in cell metabolism and differentiation. In vitro quantification of the iron concentrations of the labeled is feasible from multi-echo T2* MRI, but needs further investigation.
MeSH Terms
Figure
-
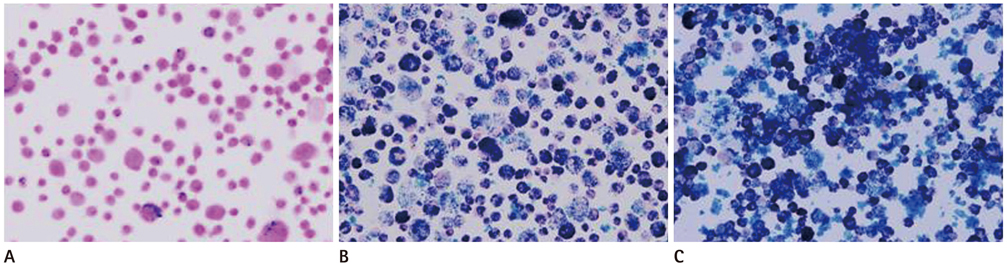
Fig. 1 Photomicrographs of Prussian blue stained labeled hMSCs with different molecular weight PLLs. A, Labeling with low molecular PLL (1-4 kDa, 2 µg/mL), B, moderate molecular weight PLL (4-15 kDa, 2 µg/mL), and C, with high molecular PLL (> 300 kDa, 2 µg/mL). In contrast to low molecular weight (A) and high molecular weight (C) PLLs, moderate molecular weight PLL labels hMSCs effectively without contamination of extracellular SPIO complexes (B) (Prussian blue staining, × 400 magnification). Note.-hMSCs = human mesenchymal stem cells, PLL = poly-L-lysine, SPIO = superparamagnetic iron oxide
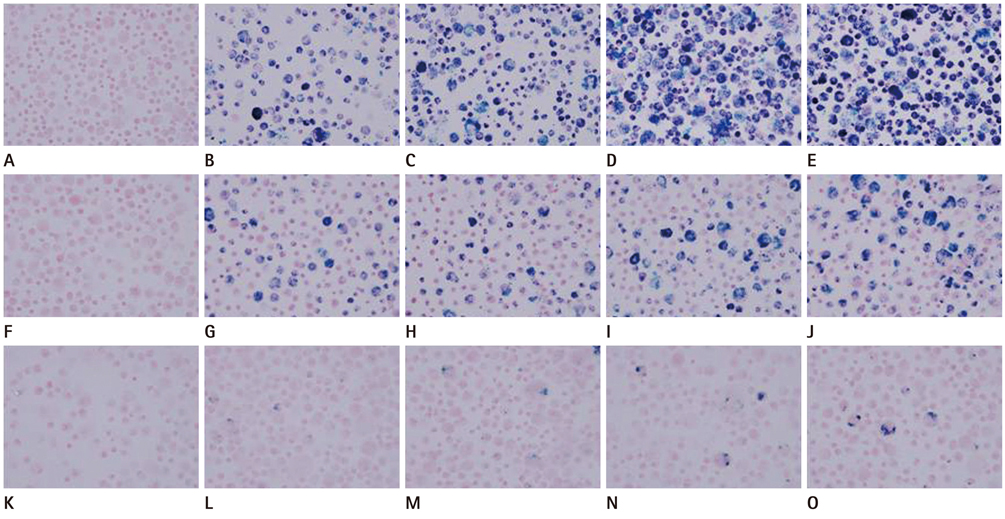
Fig. 2 Photomicrographs after Prussian blue staining of SPIO-labeled hMSCs. The photographs immediately after labeling (at the 1st subculture) were located at the upper row, while those 4 days (at the 2nd subculture) and 8 days (at the 3rd subculture) after labeling at the middle and bottom rows, respectively (A, F, K: control; B, G, L: 10 µg/mL of PS; C, H, M: 15 µg/mL of PS; D, I, N: 1.5 µg/mL of PLL; E, J, O: 2 µg/mL of PLL). Note that significant decrease in the amount of stained SPIOs within labeled cells and the increase in the number of unlabeled cells in either cases by PS or PLL with repeated subcultures (Prussian blue staining, × 400). Note.-hMSCs = human mesenchymal stem cells, PLL = poly-L-lysine, PS = protamine sulfate, SPIO = superparamagnetic iron oxide
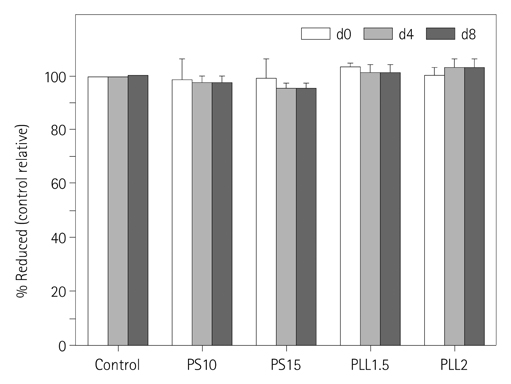
Fig. 3 Bar graph of relative rates per control determined by Alamar Blue assay immediately (white), 4 days (gray) and 8 days (black) after labeling. As shown in this figure, the viability immediately after labeling and the proliferating ability after two repeated subcultures were not significantly changed from the controls (p > 0.05). PS10, 10 µg/mL of PS; PS15, 15 µg/mL of PS; PLL1.5, 1.5 µg/mL of PLL; PLL2.0, 2.0 µg/mL of PLL. Note.-PLL = poly-L-lysine, PS = protamine sulfate
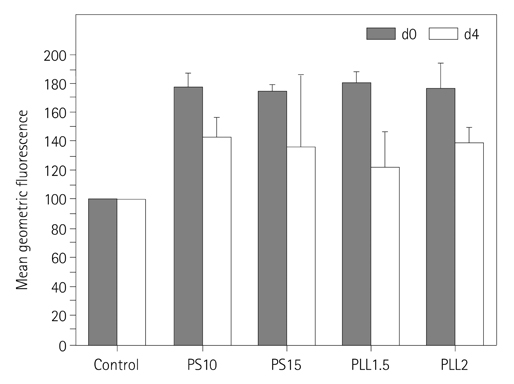
Fig. 4 Graph shows the relative production of ROS in the labeled cells expressed as means of the average percentage of ROS in the control cells immediately (black) and 4 days (white) after labeling. Data were derived from three independent experiments. PS10, 10 µg/mL of PS; PS15, 15 µg/mL of PS; PLL1.5, 1.5 µg/mL of PLL; PLL2.0, 2.0 µg/mL of PLL. Note.-PLL = poly-L-lysine, PS = protamine sulfate, ROS = reactive oxygen species
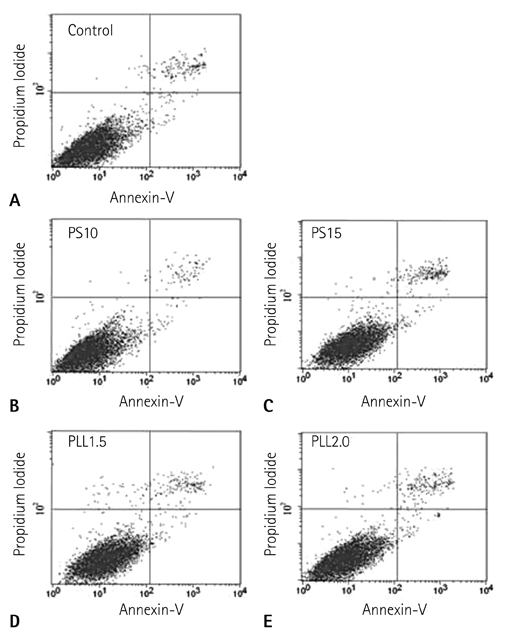
Fig. 5 Graphs (A-E) show results of analysis of apoptotic and dead cells in samples of control (i.e., nonlabeled) (A), SPIO-PS complex-labeled (B, C), and SPIO-PLL complex-labeled (D, E) hMSCs, conducted with fluorescent-activated cell sorting. There is no significant increase in the number of apoptotic or dead cells as compared with the number of apoptotic or dead cells in the control. PS10, 10 µg/mL of PS; PS15, 15 µg/mL of PS; PLL1.5, 1.5 µg/mL of PLL; PLL2.0, 2.0 µg/mL of PLL. Note.-hMSCs = human mesenchymal stem cells, PLL = poly-L-lysine, PS = protamine sulfate, SPIO = superparamagnetic iron oxide
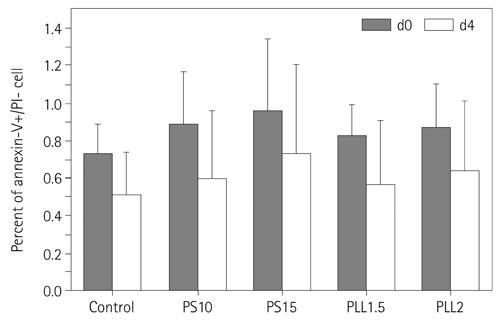
Fig. 6 Graph shows the rates of apoptotic cells per total number of cells at the right lower quadrant in the dot graphs immediately (black) and 4 days (white) after labeling. There was no significant difference in the apoptosis rates among the five groups immediate and 4 days after labeling. PS10, 10 µg/mL of PS; PS15, 15 µg/mL of PS; PLL1.5, 1.5 µg/mL of PLL; PLL2.0, 2.0 µg/mL of PLL. Note.-PLL = poly-L-lysine, PS = protamine sulfate
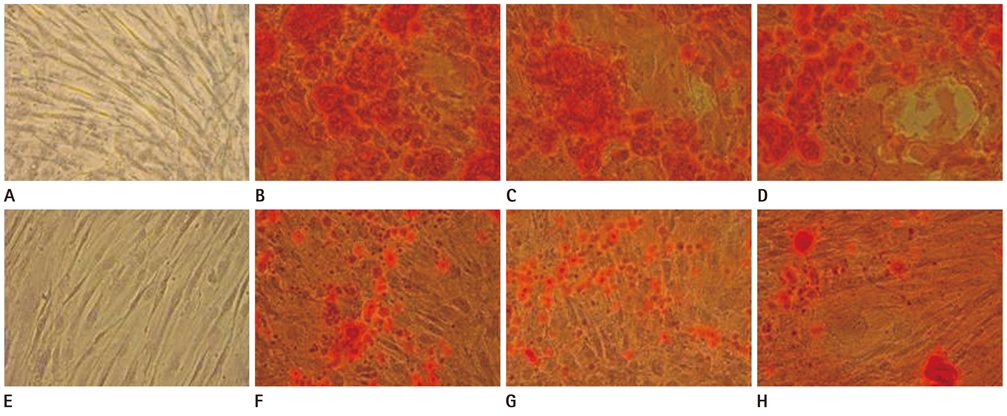
Fig. 7 Photomicrographs showing the results of osteogenic induction of hMSCs immediately (A-D) and 4-days (E-H) after labeling by the SPIO-PS (C, G) and the SPIO-PLL (D, H) complexes. A and E are negative and B and F are positive controls, respectively. Osteogenesis is demonstrated with Alizarin red S stain by detection of calcium or calcium salts. Note calcium derivatives stained red and microscopic alteration in cell morphology, gap formation and delamination, as they differentiate and mineralize (Alizarin red S stain, × 100). Note.-hMSCs = human mesenchymal stem cells, PLL = poly-L-lysine, PS = protamine sulfate, SPIO = superparamagnetic iron oxide
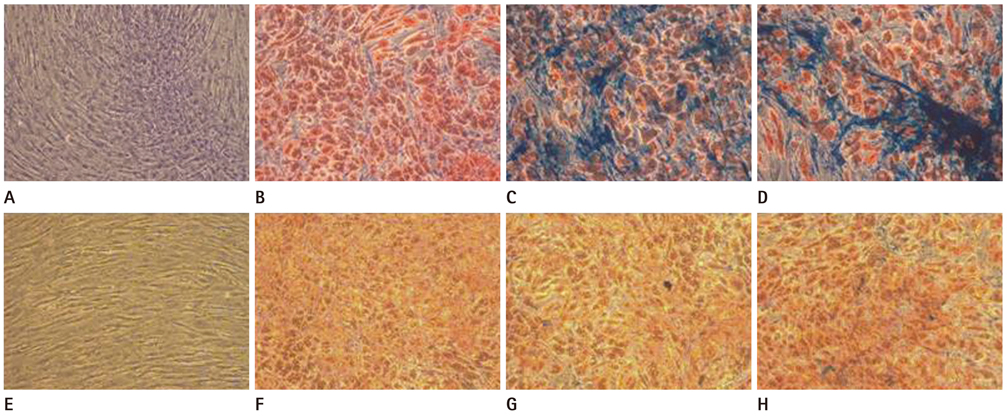
Fig. 8 Photomicrographs showing the results of adipogenic induction of hMSCs immediately (A-D) and 4-days (E-H) after labeling by the SPIO-PS (C, G) and the SPIO-PLL (D, H) complexes. A and E are negative and B and F are positive controls, respectively. Oil red O stain for lipid vacuoles and Prussian blue stain for SPIO particles were co-performed to demonstrate adipogenesis induction and iron deposition. Note the lipid vacuoles stained red and the morphological change from spindle to cuboial in shape suggesting adipocyte differentiation of the hMSCs. Prussian blue stained SPIOs are markedly decreased within the adipogenic cells after 2nd subculture (G, H) (Oil red O and Prussian blue staining, × 100). Note.-hMSCs = human mesenchymal stem cells, PLL = poly-L-lysine, PS = protamine sulfate, SPIO = superparamagnetic iron oxide

Fig. 9 Graph showing the calculated iron concentration of the hMSCs immediately after labeling from the colorimetric assay. Note.-hMSCs = human mesenchymal stem cells, PLL = poly-L-lysine, PS = protamine sulfate

Fig. 10 Graphs showing the calibration curves from cellular magnetic resonance imaging of the SPIO-agarose phantoms mixed with the same amount of labeled cells by PS or PLL. A is the calibration curve for the determination of iron quantity per cell at immediately after labeling, 3 × 10⁶ of unlabeled cells were mixed with 1% agarose solution. While 1.5 × 10⁷ of unlabeled cells were added for the calibration curve to examine the iron concentration within the cells at the 4 days after labeling (B). The graphs show significant correlation between the iron concentration of the T2* values. Note.-PLL = poly-L-lysine, PS = protamine sulfate, SPIO = superparamagnetic iron oxide
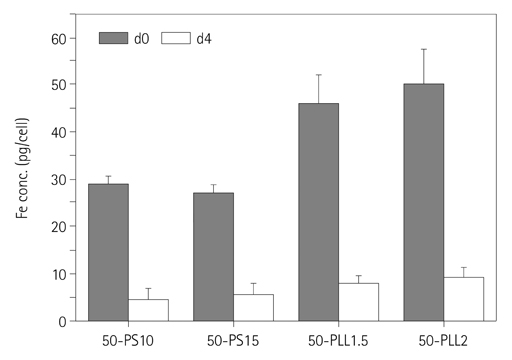
Fig. 11 Graph showing the iron concentrations of the labeled cells by the quantitative T2* magnetic resonance imaging (50-PS10, 10 µg/mL of PS; 50-PS15, 15 µg/mL of PS; 50-PLL1.5, 1.5 µg/mL of PLL; 50-PLL2.0, 2.0 µg/mL of PLL). Gray bars indicate the iron concentrations of the cells immediately after labeling, and white bars those of the cells 4 days after labeling. Although the iron concentrations of the labeled cells were overestimated compared with the results of the colorimetry, those clearly show the relative amount of the intracellular iron between the PS and PLL groups. Note.-PLL = poly-L-lysine, PS = protamine sulfate
Reference
-
1. Dazzi F, Horwood NJ. Potential of mesenchymal stem cell therapy. Curr Opin Oncol. 2007. 19:650–655.2. Serakinci N, Keith WN. Therapeutic potential of adult stem cells. Eur J Cancer. 2006. 42:1243–1246.3. Mowat P, Franconi F, Chapon C, Lemaire L, Dorat J, Hindré F, et al. Evaluating SPIO-labelled cell MR efficiency by three-dimensional quantitative T2* MRI. NMR Biomed. 2007. 20:21–27.4. Bulte JW, Duncan ID, Frank JA. In vivo magnetic resonance tracking of magnetically labeled cells after transplantation. J Cereb Blood Flow Metab. 2002. 22:899–907.5. Arbab AS, Yocum GT, Kalish H, Jordan EK, Anderson SA, Khakoo AY, et al. Efficient magnetic cell labeling with protamine sulfate complexed to ferumoxides for cellular MRI. Blood. 2004. 104:1217–1223.6. Walczak P, Kedziorek DA, Gilad AA, Barnett BP, Bulte JW. Applicability and limitations of MR tracking of neural stem cells with asymmetric cell division and rapid turnover: the case of the shiverer dysmyelinated mouse brain. Magn Reson Med. 2007. 58:261–269.7. Oude Engberink RD, van der Pol SM, Döpp EA, de Vries HE, Blezer EL. Comparison of SPIO and USPIO for in vitro labeling of human monocytes: MR detection and cell function. Radiology. 2007. 243:467–474.8. Oppitz M, Pintaske J, Kehlbach R, Schick F, Schriek G, Busch C. Magnetic resonance imaging of iron-oxide labeled SK-Mel 28 human melanoma cells in the chick embryo using a clinical whole body MRI scanner. MAGMA. 2007. 20:1–9.9. Ju S, Teng GJ, Lu H, Zhang Y, Zhang A, Chen F, et al. In vivo MR tracking of mesenchymal stem cells in rat liver after intrasplenic transplantation. Radiology. 2007. 245:206–215.10. Ju S, Teng G, Zhang Y, Ma M, Chen F, Ni Y. In vitro labeling and MRI of mesenchymal stem cells from human umbilical cord blood. Magn Reson Imaging. 2006. 24:611–617.11. Hauger O, Frost EE, van Heeswijk R, Deminière C, Xue R, Delmas Y, et al. MR evaluation of the glomerular homing of magnetically labeled mesenchymal stem cells in a rat model of nephropathy. Radiology. 2006. 238:200–210.12. Unger EC. How can superparamagnetic iron oxides be used to monitor disease and treatment? Radiology. 2003. 229:615–616.13. Frank JA, Miller BR, Arbab AS, Zywicke HA, Jordan EK, Lewis BK, et al. Clinically applicable labeling of mammalian and stem cells by combining superparamagnetic iron oxides and transfection agents. Radiology. 2003. 228:480–487.14. Arbab AS, Bashaw LA, Miller BR, Jordan EK, Lewis BK, Kalish H, et al. Characterization of biophysical and metabolic properties of cells labeled with superparamagnetic iron oxide nanoparticles and transfection agent for cellular MR imaging. Radiology. 2003. 229:838–846.15. Bos C, Delmas Y, Desmoulière A, Solanilla A, Hauger O, Grosset C, et al. In vivo MR imaging of intravascularly injected magnetically labeled mesenchymal stem cells in rat kidney and liver. Radiology. 2004. 233:781–789.
- Full Text Links
-
- Actions
-
Cited
- CITED
-
- Close
- Share
-
- Similar articles
-
- Evaluation of Optimal Combination of Commercially Available Superparamagnetic Iron Oxide Nanoparticles and Transfection Agents for Labelling of Human Mesenchymal Stem Cells
- Labeling Efficacy of Superparamagnetic Iron Oxide Nanoparticles to Human Neural Stem Cells: Comparison of Ferumoxides, Monocrystalline Iron Oxide, Cross-linked Iron Oxide (CLIO)-NH2 and tat-CLIO
- Histologic Monitoring of the Transplanted Superparamagnetic Iron Oxide Labelled Human Mesenchymal Stem Cells in the Rat Bladder
- In vivo Tracking of Mesenchymal Stem Cells Labeled with a Novel Chitosan-coated Superparamagnetic Iron Oxide Nanoparticles using 3.0T MRI
- Evaluation of Engraftment of Superparamagnetic Iron Oxide-Labeled Mesenchymal Stem Cells Using Three-Dimensional Reconstruction of Magnetic Resonance Imaging in Photothrombotic Cerebral Infarction Models of Rats
