Infrared thermographic analysis of temperature rise on the surface of buchanan plugger
- Affiliations
-
- 1Department of Conservative Dentistry, College of Dentistry, DSRI, Chonnam National University, Korea.
- 2School of Mechanical Systems Engineering College of Engineering, Chonnam National University, Korea.
- 3Department of Dentistry, College of Medicine, Seonam University, Korea.
- KMID: 1987292
- DOI: http://doi.org/10.5395/JKACD.2002.27.4.370
Abstract
- This study was performed to evaluate the temperature rise on various position of the Buchanan plugger, the peak temperature of plugger's type and the temperature change by its touching time of heat control spring. The heat carrier system 'System B'(Model 1005, Analytic Technologies, USA) and the Buchanan's pluggers of F, FM, M and ML sizes are used for this study. The temperature was set to 200degrees C which Dr. Buchanan's "continuous wave of condensation" technique recommended on digital display and the power level on it was set to 10. In order to apply heat on the Buchanan's pluggers, the heat control spring was touched for 1, 2, 3, 4 and 5 seconds respectively. The temperature rise on the surface of the pluggers were measured at 0.5 mm intervals from tip to 20 mm length of shank using the infrared thermography (Radiation Thermometer-IR Temper, NEC San-ei Instruments, Ltd, Japan) and TH31-702 Data capture software program (NEC San-ei Instruments, Ltd, Japan). Data were analyzed using a one way ANOVA followed by Duncan's multiple range test and linear regression test. The results as follows. 1. The position at which temperature peaked was approximately at 0.5 mm to 1.5 mm far from the tip of Buchanan's pluggers (p<0.001). The temperature was constantly decreased toward the shank from the tip of it (p<0.001). 2. When the pluggers were heated over 5 seconds, the peak temperature by time of measurement revealed from 253.3+/-10.5degrees C to 192.1+/-3.3degrees C in a touch for 1 sec, from 218.6+/-5.0degrees C to 179.5+/-4.2degrees C in a touch for 2 sec, from 197.5+/-3.0degrees C to 167.6+/-3.7degrees C in a touch for 3 sec, from 183.7+/-2.5degrees C to 159.8+/-3.6degrees C in a touch for 4 sec and from 164.9+/-2.0degrees C to 158.4+/-1.8degrees C in a touch for 5 sec. A touch for 1 sec showed the highest peak temperature, followed by, in descending order, 2 sec, 3 sec, 4 sec. A touch for 5 sec showed the lowest peak temperature (p<0.001). 3. A each type of pluggers showed different peak temperatures. The peak temperature was the highest in F type and followed by, in descending order, M type, ML type. FM type revealed the lowest peak temperature (p<0.001). The results of this study indicated that pluggers are designed to concentrate heat at around its tip, its actual temperature does not correlate well with the temperature which Buchanan's "continuous wave of condensation" technique recommend, and finally a quick touch of heat control spring for 1sec reveals the highest temperature rise.
MeSH Terms
Figure
-
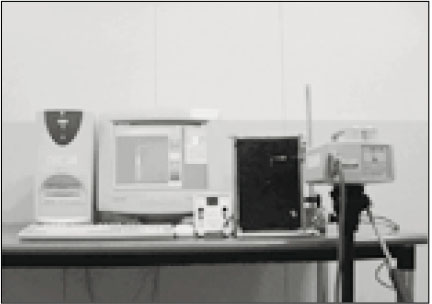
Fig. 1 Infrared thermal imaging system.
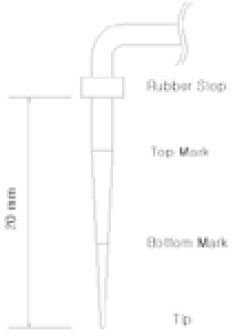
Fig. 2 Schematic illustration of Buchanan plugger.
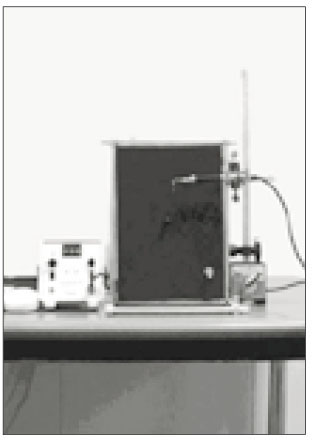
Fig. 3 The fixation device of heat carrier of System B HeatSource and System B Heat Source.
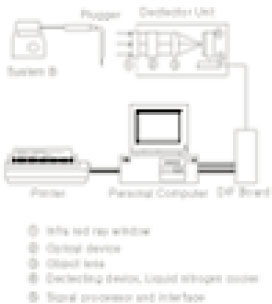
Fig. 4 Schematic illustration of the whole system.
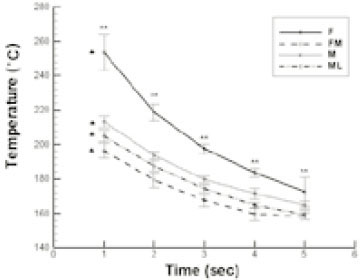
Fig. 5 Maximum temperature at time of measurement. Time(sec):heating time of heat control spring **:represents significant difference by plugger type (p<0.001). ♣:represents significant difference by time of measurement(p<0.001).
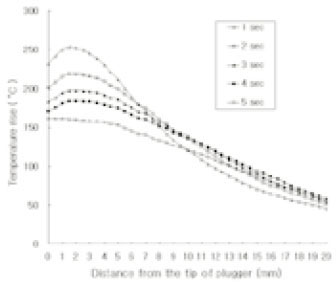
Fig. 6 Temperature changes on the surface of Buchanan plugger(F). (setting temperature: 200℃, power level: 10) 0:Tip of plugger, 20:Shank of plugger
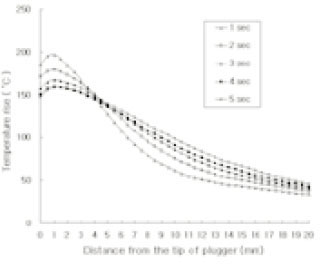
Fig. 7 Temperature changes on the surface of Buchanan plugger(FM). (setting temperature: 200℃, power level: 10) 0:Tip of plugger, 20:Shank of plugger

Fig. 8 Temperature changes on the surface of Buchanan plugger(M). (setting temperature: 200℃, power level: 10) 0:Tip of plugger, 20:Shank of plugger

Fig. 9 Temperature changes on the surface of Buchanan plugger(ML). (setting temperature: 200℃, power level: 10) 0:Tip of plugger , 20:Shank of plugger

Fig. 10 Representative thermographic image of F type (1 sec)

Fig. 11 Representative thermographic image of F type (2 sec)

Fig. 12 Representative thermographic image of F type (3 sec)
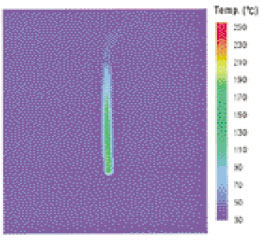
Fig. 13 Representative thermographic image of F type (4 sec)
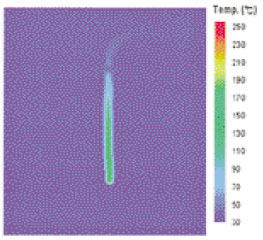
Fig. 14 Representative thermographic image of F type (5 sec)

Fig. 15 Representativ thermographic image of FM type (1 sec)
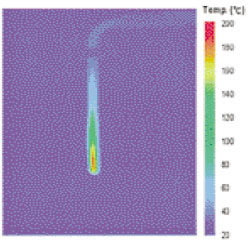
Fig. 16 Representative thermographic image of FM type (2 sec)

Fig. 17 Representative thermographic image of FM type (3 sec)
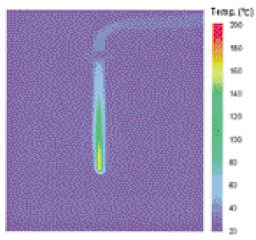
Fig. 18 Representative thermographic image of FM type (4 sec)

Fig. 19 Representative thermographic image of FM type (5 sec)
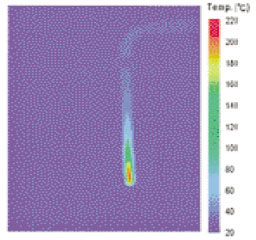
Fig. 20 Representative thermographic image of M type (1 sec)

Fig. 21 Representative thermographic image of M type (2 sec)
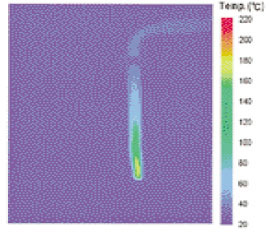
Fig. 22 Representative thermographic image of M type (3 sec)

Fig. 23 Representative thermographic image of M type (4 sec)
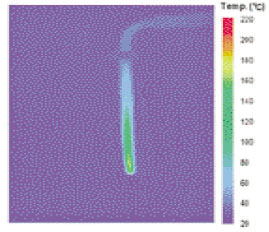
Fig. 24 Representative thermographic image of M type (5 sec)
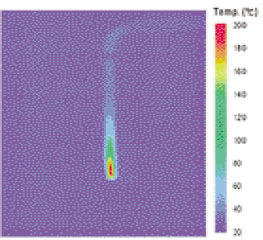
Fig. 25 Representative thermographic image of ML type (1 sec)

Fig. 26 Representative thermographic image of ML type (2 sec)

Fig. 27 Representative thermographic image of ML type (3 sec)
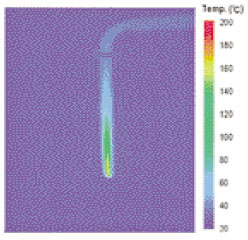
Fig. 28 Representative thermographic image of ML type (4 sec)

Fig. 29 Representative thermographic image of ML type (5 sec)
Cited by 3 articles
-
Analysis of temperature rise on the root surface during continuous wave of condensation technique
Young-Ju Kim, Yun-Chan Hwang, Sun-Ho Kim, In-Nam Hwang, Bo-Young Choi, Young-Jin Jeong, Woo-Nam Juhng, Won-Mann Oh
J Korean Acad Conserv Dent. 2003;28(4):341-347. doi: 10.5395/JKACD.2003.28.4.341.Analysis of temperature rise on the surface of buchanan plugger using thermocouple
Jin-Suk Cho, Yun-Chan Hwang, Sun-Ho Kim, In-Nam Hwang, Bo-Young Choi, Young-Jin Jeong, Woo-Nam Juhng, Won-Mann Oh
J Korean Acad Conserv Dent. 2003;28(4):334-340. doi: 10.5395/JKACD.2003.28.4.334.Plugger temperature of cordless heat carriers according to the time elapsed
Hoon-Sang Chang, Se-Hee Park, Kyung-Mo Cho, Jin-Woo Kim
Restor Dent Endod. 2018;43(1):. doi: 10.5395/rde.2018.43.e12.
Reference
-
1. Schilder H. Filling root canals in three dimensions. Dent Clin North Am. 1967. 11:723–744.
Article2. Nguyen NT. Obturation of the Root Canal System. Pathways of the Pulp. 1994. 6th ed. St. Louis: Mosby Co.;219–271.3. Hand RE, Hugel EF, Tsaknis PJ. Effect of a warm gutta-percha technique on the lateral periodontium. Oral Surg. 1976. 42:395–401.4. Marlin J, Schilder H. Physicial properties of gutta-percha when subjected to heat and vertical condensation. Oral Surg. 1973. 36:872–879.
Article5. Barkhordar RA, Goodis HE, Watanabe L, Koundjian J. Evaluation of teeth during root canal obturation technique. Quintessence Int. 1990. 21:585–588.6. Eriksson A, Albrektsson T, Grane B, McQueen D. Thermal injury to bone : a vital-microscopic description of heat effect. Int J Oral Surg. 1982. 11:115–121.7. Eriksson RA, Albrektsson T. The effect of heat on bone regeneration. J Oral Maxillofac Surg. 1984. 42:705–711.8. Eriksson AR, Albrektsson T. Temperature threshold levels for heat-induced bone tissue injury : a vital-microscopic study in the rabbit. J Prosthet Dent. 1983. 50:101–107.
Article9. Lee FS, Van Cura JE, BeGole E. A comparison of root surface temperatures using different obturation heat sources. J Endod. 1998. 24:617–620.
Article10. Weller RN, Jurcak JJ, Donley DL, Kulild JC. A new model system for measuring intracanal temperatures. J Endod. 1991. 17:491–494.
Article11. Floren JW, Weller RN, Pashley DH, Kimbrough WF. Changes in root surface temperatures with in vitro use of the system B HeatSource. J Endod. 1999. 25:593–595.
Article12. Mc Cullagh JJ, Setchell DJ, Gulabivala K, Hussey DL, Biagioni P, Lamey PJ, Bailey G. A comparison of thermocouple and infrared thermographic analysis of temperature rise on the root surface during the continuous wave of condensation technique. Int Endod J. 2000. 33:326–332.
Article13. Biagioni PA, Longmore RB, McGimpsey JG, Lamey P-J. Infrared thermography - its role in dental research with particular reference to craniomandibular disorders. Dentomaxillofac Radiol. 1996. 25:119–124.
Article14. Buchanan LS. Continuous wave technique. Dent Today. 1996. 1:60–64.15. Analytic Technology Corp. Instruction guidelines for system B HeatSource model 1005. 1997. Redmond, WA: Analytic Technology Corp..16. Jurcak JJ, Weller RN, Kulild JC, Donley DL. In vitro intracanal temperatures produced during warm lateral condensation of gutta-percha. J Endod. 1992. 18:1–3.
Article
- Full Text Links
-
- Actions
-
Cited
- CITED
-
- Close
- Share
-
- Similar articles
-
- Analysis of temperature rise on the surface of buchanan plugger using thermocouple
- Digital Infrared Thermographic Imaging(D.I.T.I.) in Herniated Lumbar Disc Patients
- Analysis of temperature rise on the root surface during continuous wave of condensation technique
- Postoperative Evaluation of Lumbar Disc Herniation Using Digital Infrared Thermographic Imaging
- A study of insertion depth of buchanan plugger after shaping using NI-TI rotary files in simulated resin root canals
