The Role of Popliteal Lymph Nodes in Differentiating Rheumatoid Arthritis from Osteoarthritis by Using CE 3D-FSPGR MR Imaging: Relationship of the Inflamed Synovial Volume
- Affiliations
-
- 1Department of Diagnostic Radiology, Yonsei University, College of Medicine, Korea. jss@yumc.yonsei.ac.kr
- 2Department of Biostatistics, Yonsei University, College of Medicine, Korea.
- 3Department of Orthopedic Surgery, Yonsei University, College of Medicine, Korea.
- KMID: 1783185
- DOI: http://doi.org/10.3348/kjr.2005.6.2.117
Abstract
OBJECTIVE
We wanted to assess the role of the popliteal lymph nodes for differentiating rheumatoid arthritis (RA) from osteoarthritis (OA), and we also wanted to investigate the relationship between the popliteal lymph nodes and the inflamed synovial volume (ISV) by using contrast enhanced (CE), fat suppressed, three dimensional-fast spoiled gradient echo (3D-FSPGR) MR imaging. MATERIALS AND METHODS: Contrast enhanced 3D-FSGPR MR imaging of 94 knees (21 with RA and 73 with OA) was analyzed. A lymph node was defined as being 'observed' if it could be seen in at least two planes of the three orthogonal reformatted planes. The number of observed lymph nodes, the mean of the smallest dimension of each lymph node and the existence of central fatty change were recorded. The OA group was graded according to the ISV calculated by a segmentation method: grade I was < 20 cm3; grade II ranged from 20 cm3 to 40 cm3; and grade III was > 40 cm3. Statistical analysis of the number and the mean size of the popliteal lymph nodes among the four groups (the RA group and the grade I-III OA groups) was performed. RESULTS: The prevalence of the observed popliteal lymph nodes was significantly different between all the OA groups or between the grade III OA group and the RA group (p < 0.0001, 0.0001, respectively). The popliteal lymph node was observed in 32 out of 73 OA cases, whereas it was visible in all of the 21 RA cases. The number (mean+/-standard deviation) of lymph nodes in the grade I OA group, the grade II OA group, the grade III OA group and the RA group was 1.2+/-0.4, 1.2+/-0.4, 1.3+/-0.5, and 2.7+/-1.1, respectively. The mean size (mean+/-standard deviation) of the lymph nodes was 3.8+/-1.0 mm, 3.6+/-1.1 mm, 4.1+/-0.8 mm, and 5.4+/-1.3 mm, respectively. The incidence of central fatty changes was significantly lower in the RA group than in all the OA groups and the grade III OA group. When differentiating RA from OA, and when the differentiation was confined to the RA group and grade III OA group, respectively, the criteria of the number of lymph nodes, their size, their central fatty change and a combination of all these three criteria showed statistical significance (Az values for the former were 0.869, 0.847, 0.776, and 0.942; Az values for the latter were 0.855, 0.799, 0.712, and 0.916). The number and mean size of the lymph nodes correlated with the ISVs (r = 0.49, p < 0.001; 0.50, 0.001, respectively). CONCLUSION: The number, size and central fatty changes in the popliteal lymph nodes observed on the MR images might serve as simple and useful markers in differentiating RA disease from OA disease. These markers would be particular helpful in cases of severe synovial enhancement where the ISVs of both RA and OA overlap. The number and mean size of the lymph nodes also correlated well with the ISV.
Keyword
MeSH Terms
Figure
-

Fig. 1 A 75-year-old woman with osteoarthritis Coronal contrast enhanced, fat suppressed, 3D FSPGR image (A) and its reformatted (B) sagittal and (C) axial images in a separate workstation show the marked synovial membrane enhancement. Hence, this case was grouped with the Grade III osteoarthritis. The popliteal lymph node was not visible on all the knee MR images.
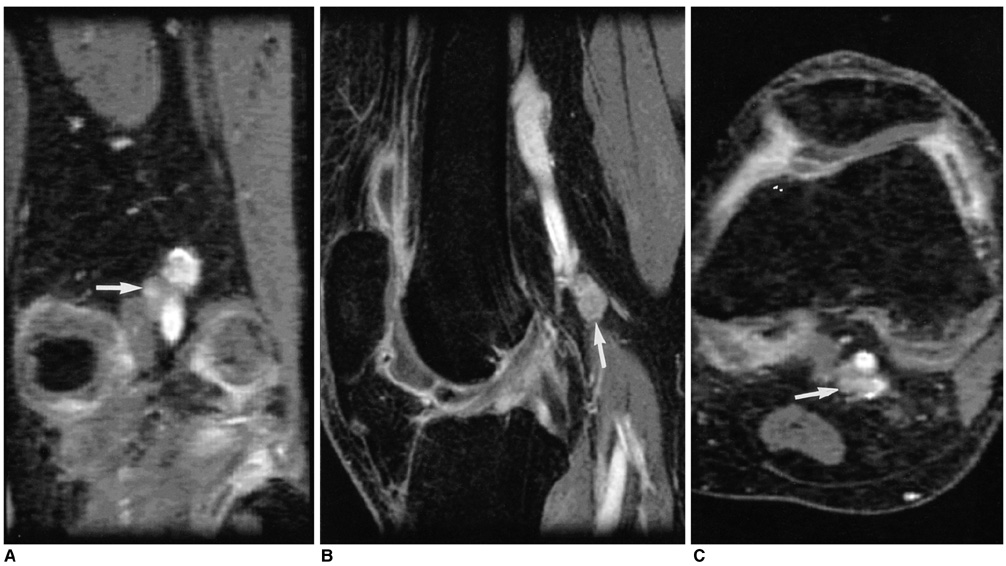
Fig. 2 A 41-year-old woman with rheumatoid arthritis. Coronal contrast enhanced, fat suppressed, 3D FSPGR image (A) and its reformatted (B) sagittal and (C) axial images in a separate workstation show an 8.6 mm sized (shortest diameter) lymph node (arrows) adjacent to the popliteal vessels. Central fatty changes cannot be seen. There was extensive synovial membrane enhancement in the knee joint.
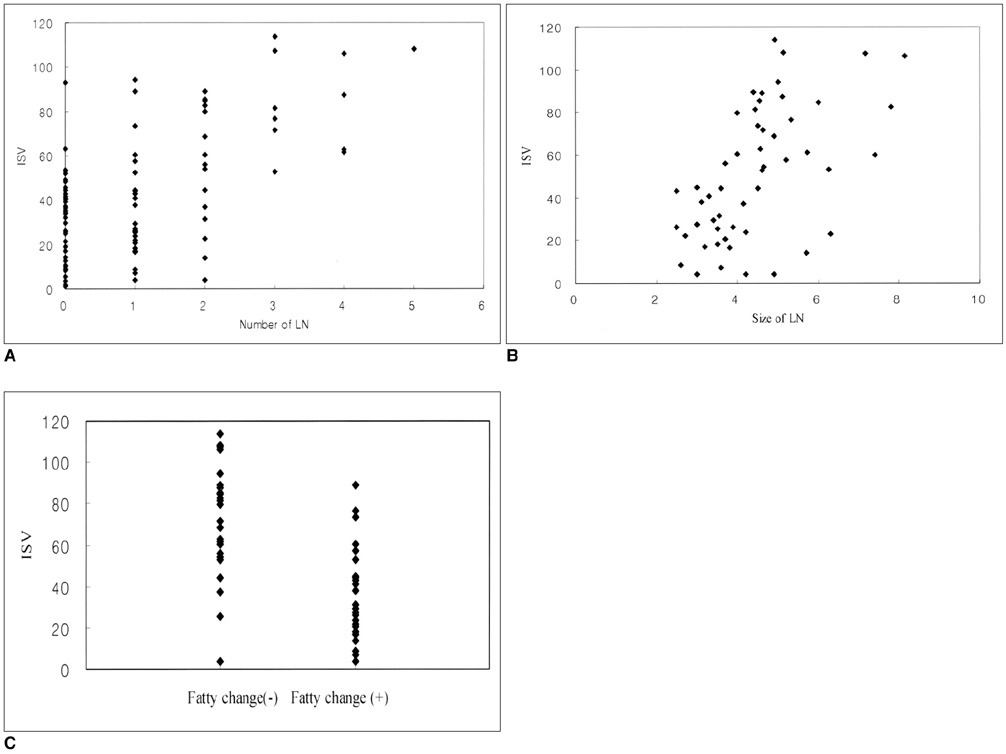
Fig. 3 Scatter plots of (A) the number, (B) the mean size and (C) the central fatty changes in a popliteal lymph node as graphed against the inflamed synovial volumes (cm3). Each of these factors is statistically correlated with the inflamed synovial volume of the knee joint. The number and size of the lymph node means the number and mean size (mm) of the popliteal lymph nodes, respectively. Fatty changes (-) and (+) the mean absence and presence of central fatty changes in the popliteal lymph node, respectively.
Reference
-
1. Netter Frank H.. The Ciba collection of medical illustrations. 1987. 3rd ed. Newjersey: Ciba-Geigy Corp;121.2. William PL, Warwick R, Dyson M, Bannister LH. Gray's Anatomy. 1989. 37th ed. London: Churchill Livingstone;848–849.3. Luscieti P, Hubschmid T, Cottier H, Hess MW, Sobin LH. Human lymph node morphology as a function of age and site. J Clin Pathol. 1980. 33:454–461.4. Moon HJ, Suh JS, Lee SH. Magnetic resonance appearance of normal popliteal lymph nodes: location and relationship of number, fatty change, and size of the lymph nodes with aging. J Korean Radiol Soc. 2002. 47:665–671.5. Huh YM, Suh JS, Jeong EK, Lee SK, Lee JS, Choi BW, et al. Role of the inflamed synovial volume of the wrist in defining remission of rheumatoid arthritis with gadolinium-enhanced 3D-SPGR MR imaging. J Magn Reson Imaging. 1999. 10:202–208.6. Palmer WE, Rosenthal DI, Schoenberg OI, Fischman AJ, Simon LS, Rubin RH, et al. Quantification of inflammation in the wrist with gadolinium-enhanced MR imaging and PET with 2-[F-18]-fluoro-2-deoxy-D-glucose. Radiology. 1995. 196:647–655.7. Ostergaard M, Hansen M, Stoltenberg M, Lorenzen I. Quantitative assessment of the synovial membrane in the rheumatoid wrist: an easily obtained MRI score reflects the synovial volume. Br J Rheumatol. 1996. 35:965–971.8. Ostergaard M, Hansen M, Stoltenberg M, Gideon P, Klarlund M, Jensen KE, et al. Magnetic resonance imaging-determined synovial membrane volume as a marker of disease activity and a predictor of progressive joint destruction in the wrists of patients with rheumatoid arthritis. Arthritis Rheum. 1999. 42:918–929.9. Ostergaard M, Stoltenberg M, Lovgreen-Nielsen P, Volck B, Jensen CH, Lorenzen I. Magnetic resonance imagingdetermined synovial membrane and joint effusion volumes in rheumatoid arthritis and osteoarthritis. Comparison with the macroscopic and microscopic appearance of the synovium. Arthritis Rheum. 1997. 40:1856–1867.10. Conaghan P, Edmonds J, Emery P, Genant H, Gibbon W, Klarlund M, et al. Magnetic resonance imaging in rheumatoid arthritis: summary of OMERACT activities, current status, and plans. J Rheumatol. 2001. 28:1158–1162.11. Cooper NS, Soren A, McEwen C, Rosenberger JL. Diagnostic specificity of synovial lesions. Hum Pathol. 1981. 12:314–328.12. Gibson T, Fagg N, Highton J, Wilton M, Dyson M. The diagnostic value of synovial biopsy in patients with arthritis of unknown cause. Br J Rheumatol. 1985. 24:232–241.13. Goldenberg DL, Cohen AS. Synovial membrane histopathology in the differential diagnosis of rheumatoid arthritis of rheumatoid arthritis, gout, pseudogout, systemic lupus erythematosus, infectious arthritis and degenerative joint disease. Medicine (Baltimore). 1978. 57:239–252.14. Goldenberg DL, Egan MS, Cohen AS. Inflammatory synovitis in degenerative joint disease. J Rheumatol. 1982. 9:204–209.15. Fernandez-Madrid F, Karvonen RL, Teitge RA, Miller PR, An T, Negendank WG. Synovial thickening detected by MR imaging in osteoarthritis of the knee confirmed by biopsy as synovitis. Magn Reson Imaging. 1995. 13:177–183.16. Arnett FC, Edworthy SM, Bloch DA, McShane DJ, Fries JF, Cooper NS, et al. The American Rheumatism Association 1987 revised criteria for the classification of rheumatoid arthritis. Arthritis Rheum. 1988. 31:315–324.17. Altman R, Asch E, Bloch D, Bole G, Borenstein D, Brandt K, et al. Diagnostic and Therapeutic Criteria Committee of the American Rheumatism Association. Development of criteria for the classification and reporting of osteoarthritis: classification of osteoarthritis of the knee. Arthritis Rheum. 1986. 29:1039–1049.18. Grey AC, Carrington BM, Hulse PA, Swindell R, Yates W. Magnetic resonance appearance of normal inguinal nodes. Clin Radiol. 2000. 55:124–130.19. Ingram CE, Belli AM, Lewars MD, Reznek RH, Husband JE. Normal lymph node size in the mediastinum: a retrospective study in two patient groups. Clin Radiol. 1989. 40:35–39.20. Dooms GC, Hericak H, Crooks LE, Higgins CB. Magnetic resonance imaging of the lymph nodes: comparison with CT. Radiology. 1984. 153:719–728.21. Dorfman RE, Alpern MB, Gross BH, Sandler MA. Upper abdominal lymph nodes: criteria for normal size determined with CT. Radiology. 1991. 180:319–322.22. Vinnicombe SJ, Norman AR, Nicholson V, Husband JE. Normal pelvic lymph nodes: evaluation with CT after bipedal lymphangioraphy. Radiology. 1995. 194:349–355.23. Huh YM, Suh JS, Lee JW, Song HT. Synovitis and soft tissue impingement of the ankle: assessment with enhanced 3D-FSPGR MR imaging. J Magn Reson Imaging. 2004. 19:108–116.24. Steinbach LS, Palmer WE, Schweitzer ME. Special focus session. MR arthrography. Radiographics. 2002. 22:1223–1246.
- Full Text Links
-
- Actions
-
Cited
- CITED
-
- Close
- Share
-
- Similar articles
-
- Volumetric measurement of the inflamed synovium of rheumatoid wrist joint for the evaluation of synovitis and remission
- Bicipital Synoival Cysts in Juvenile Rheumatoid Arthritis
- Synovial Chondromatosis in Knee Masquerading as Tuberculosis Arthritis
- Synovial Fluid Adenosine Deaminse Activity in the Patients of Rheumatoid Arthritis, Osteoarthritis, Ankylosing Spondylitis, and Gouty Arthritis
- Study of Ferritin Concentration in Synovial Fluid and Serum of Rheumatoid Arthritis
