Urban and rural Differences in the Prevalence of Gender and Age specific Obesity and related Health Behaviors in Korea
- Affiliations
-
- 1Medical Research Institute, School of Medicine, Sungkyunkwan University, Samsung Medical Center, Seoul, Korea.
- 2Department of Pediatrics, School of Medicine, Sungkyunkwan University, Samsung Medical Center, Seoul, Korea. silee@smc.samsung.co.kr
- 3Department of Statistics, Ewha Womens University, College of Natural Science, Seoul, Korea.
- KMID: 1781750
- DOI: http://doi.org/10.3346/jkms.2005.20.5.713
Abstract
- The objective of this study was to discuss the residential difference in gender and age specific prevalence of obesity by body mass index (BMI) and obesity related health behaviors in the Republic of Korea. A total of nationally representative 2,583 men and 3,087 women (age: 20-64 yr) was used as subjects from 1998 National Health and Nutrition Survey. All statistics were calculated using SUDAAN to consider a stratified multistage probability sampling design. The prevalence of obesity (BMI> or =25) was significantly different by age, gender and residential areas. Although younger men aged 20-49 yr did not show a residential difference in the prevalence of obesity, men aged 50-64 yr showed differences, highest in big cities and lowest in rural areas. However, in women, a higher prevalence was observed in rural areas compared to urban areas in the younger age group (20-49 yr), but not in the older age group. Residential differences of obesity related health behaviors existed mostly in the older population, but not in the younger population. The urban-rural differences demonstrate the various stages of behavioral transition that Korea is currently undergoing. Therefore, different strategies considering those factors are needed to manage obesity problems in Korea.
Keyword
MeSH Terms
-
Adult
Age Distribution
*Body Constitution
Female
*Health Behavior
Humans
Korea/epidemiology
Male
Middle Aged
Obesity/*epidemiology
Prevalence
Research Support, Non-U.S. Gov't
Risk Assessment/*methods
Risk Factors
Rural Health/*statistics and numerical data
Rural Population/statistics and numerical data
Sex Distribution
Urban Health/*statistics and numerical data
Urban Population/statistics and numerical data
Figure
-
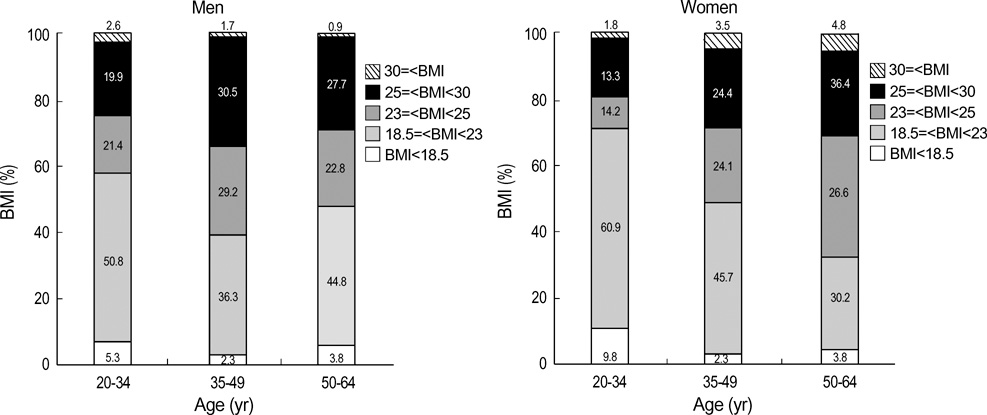
Fig. 1 The distribution of BMI in Korean men and women by age group.

Fig. 2 Prevalence of obesity (BMI≥25) by age and residence in men and women. The 1998 Korean National Health and Nutrition Survey. Result of General Linear Model were as follows: For men, Age effect, p=0.0001; Residence effect, p=0.2986; Age×Residence, p=0.0023; For, women, Age effect, p<0.0001; Residence effect, p=0.0010; Age×Residence, p=0.0001. *significant difference by ages in big city, p<0.05. #significant difference by ages in small city, p<0.05. †significant difference by ages in rural area, p<0.05. **significant difference by residences in each age group, p<0.05
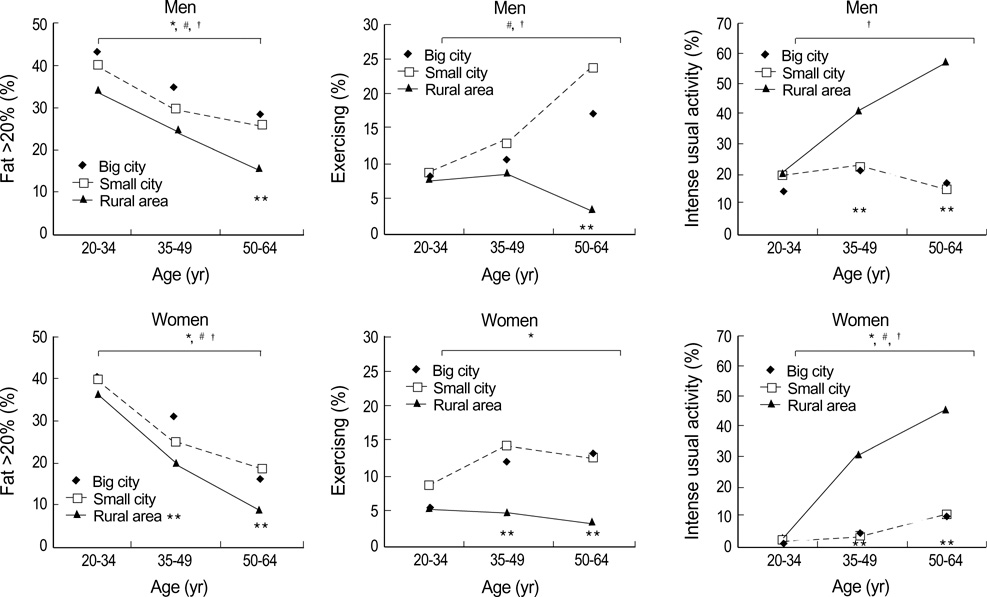
Fig. 3 Fat intakes and exercising and intense usual activities by age and residence in men and women. The 1998 Korean National Health and Nutrition Survey. Result of General Linear Model were as follows: Fat intake: For men, Age effect, p<0.0001; Residence effect, p=0.0005; Age×Residence, p=0.7692; For women, Age effect, p<0.0001; Residence effect, p=0.0081; Age×Residence, p=0.3626. Exercise: For men, Age effect, p=0.1123; Residence effect, p=0.0012; Age×Residence, p=0.0006; For, women, Age effect, p=0.0049; Residence effect, p=0.0003; Age×Residence, p=0.0228. Daily activity: For men, Age effect, p=0.0009; Residence effect, p<0.0001; Age×Residence, p<0.0001; For, women, Age effect, p<0.0001; Residence effect, p<0.0001; Age×Residence, p=0.0019. *significant difference by ages in big city, p<0.05. #significant difference by ages in small city, p<0.05. †significant difference by ages in rural area, p<0.05. **significant difference by residences in each age group, p<0.05
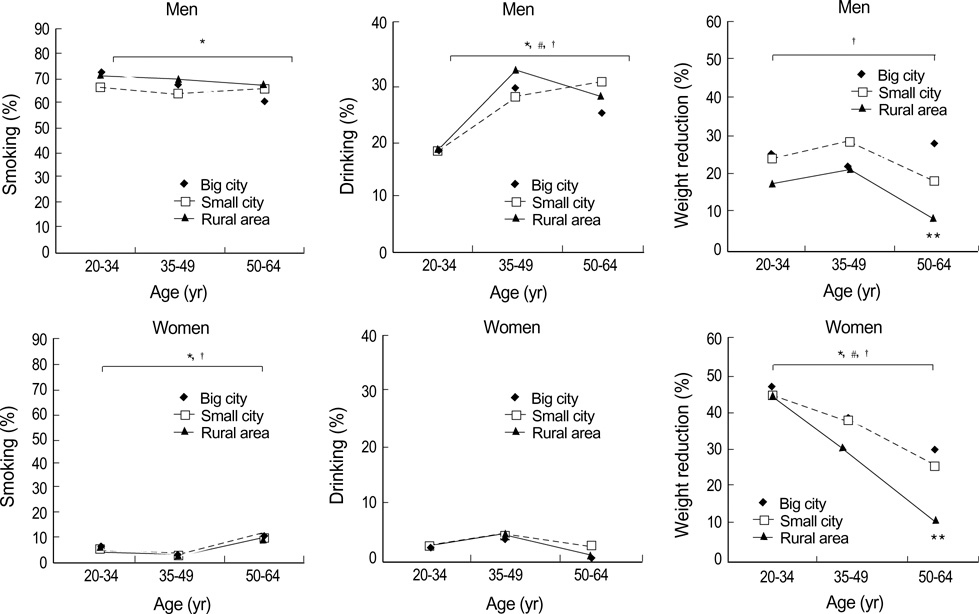
Fig. 4 Smoking, drinking and weight related behaviors by age and residence in men and women. The 1998 Korean National Health and Nutrition Survey. Result of General Linear Model were as follows: Smoke: For men, Age effect, p=0.0024; Residence effect, p=0.2713; Age×Residence, p=0.4968; For, women, Age effect, p=0.0035; Residence effect, p=0.8918; Age×Residence, p=0.9362. Drink: For men, Age effect, p<0.0001; Residence effect, p=0.3813; Age×Residence, p=0.5073; For, women, Age effect, p=0.5402; Residence effect, p=0.8334; Age×Residence, p=0.9605. Weight control to reduce: For men, Age effect, p=0.1047; Residence effect, p=0.0017; Age×Residence, p=0.0052; For, women, Age effect, p<0.0001; Residence effect, p=0.0002; Age×Residence, p=0.0002. *significant difference by ages in big city, p<0.05. #significant difference by ages in small city, p<0.05. †significant difference by ages in rural area, p<0.05. **significant difference by residences in each age group, p<0.05
Cited by 4 articles
-
Regional disparities in the associations of cardiometabolic risk factors and healthy dietary factors in Korean adults
Kyungho Ha, YoonJu Song, Hye-Kyeong Kim
Nutr Res Pract. 2020;14(5):519-531. doi: 10.4162/nrp.2020.14.5.519.Regional comparison of dietary intakes and health related behaviors among residents in Asan
Ji-Sun Kim, Min-Kyoung Kim, Hee-Seon Kim
Nutr Res Pract. 2007;1(2):143-149. doi: 10.4162/nrp.2007.1.2.143.Regional disparities related to cardiovascular diseases and diet quality in Korean adults: based on the 2013–2016 Korea National Health and Nutrition Examination Survey Data
Bo Young Seo, Eun Sil Her
Nutr Res Pract. 2022;16(6):755-764. doi: 10.4162/nrp.2022.16.6.755.Risk of all-cause mortality is associated with multiple health-related lifestyle behaviors and does not differ between urban and rural areas in Korea
Seunghee Kim, Clara Yongjoo Park
Nutr Res Pract. 2024;18(4):554-566. doi: 10.4162/nrp.2024.18.4.554.
Reference
-
1. Berenson GS, Srinivasan SR, Bao W, Newman WP 3rd, Tracy RE, Wattigney WA. Association between multiple cardiovascular risk factors and atherosclerosis in children and young adults. The Bogalusa heart study. N Engl J Med. 1998. 338:1650–1656.2. Popkin BM, Doak CM. The obesty epidemic is a worldwide phenomenon. Nutr Rev. 1998. 56:106–114.3. World Health Organization. Obesity: preventing and managing the global epidemic. Report of a WHO consultation. 1998. Geneva: Geneva WHO.4. Wang J, Thornton JC, Russell M, Burastero S, Heymsfield S, Pierson RN Jr. Asians have lower body mass index but higher percent body fat than do whites: comparisons of anthropometric measurements. Am J Clin Nutr. 1994. 60:23–28.5. Ko GT, Tang J, Chan JC, Wu MM, Wai HP, Chen R. Lower BMI cut-off value to define obesity in Hong Kong Chinese: an analysis based on body fat assessment by bioelectrical impedance. Br J Nutr. 2001. 85:239–242.
Article6. Deurenberg P, Deurenberg-Yap M, Guricci S. Asians are different from Caucasians and from each other in their body mass index/body fat percent relationship. Obes Rev. 2002. 3:141–146.7. Choo V. WHO reassesses appropriate body-mass index for Asian population. Lancet. 2002. 360:235.8. Bei-Fan Z. Cooperative Meta-analysis Group of Working Group on Obesity in China. Predictive values of body mass index and waist circumference for risk factors of certain related diseases in Chinese adults: study on optimal cut-off points of body mass index and waist circumference in Chinese adults. Asia Pac J Clin Nutr. 2002. 11:Suppl 8. S685–S693.9. Kanazawa M, Yoshiike N, Osaka T, Numba Y, Zimmet P, Inoue S. Criteria and classification of obesity in Japan and Asia-Oceania. Asia Pac J Clin Nutr. 2002. 11:Suppl 8. S732–S737.
Article10. Kim N, Moon O, Kang J, Lee S, Jeong B, Lee S, Yoon T, Hwang K. Increasing prevalence of obesity related disease for Koreans associated with overweight and obesity. Korean J Prev Med. 2001. 34:309–315.11. Hallfrisch J, Miller D, Drinkwater D, Tobin J, Andres R. Continuing diet trends in men: the Baltimore Longitudinal study of aging (1961-1987). J Gerontol. 1990. 45:M186–M191.
Article12. Williams PT. Evidence for the incompatibility of age-neutral over-weight and age-neutral physical activity standards from runners. Am J Clin Nutr. 1997. 65:1391–1396.
Article13. Nassis G, Geladas N. Age-related pattern in body composition changes for 18-69 year old women. J Sports Med Phys Fitness. 2003. 43:327–333.14. Yoshiike N, Kaneda F, Takimoto H. Epidemiology of obesity and public health strategies for its control in Japan. Asia Pac J Clin Nutr. 2002. 11:Suppl 8. S727–S731.
Article15. Prevalence of overweight and obesity among adults, Hyaltsville MD1999. US Department of Health and Human Services National Center for Health Statistics Centers for Disease Control and Preventions. Accessed 5 July 2004. Availableat:http//www.cdc.gov/nchs/data/hus/tables/2002/02hus070.pdf.16. Kim S, Moon S, Popkin B. The nutrition transition in South Korea. Am J Clin Nutr. 2000. 71:44–53.
Article17. Kang J, Kim N. Secular trend of obesity prevalence in Korea. Korean J Study Obes. 2002. 11:329–336.18. Reddy KS, Prabhakaran D, Shah P, Shah B. Differences in body mass index and waist: hip ratios in North Indian rural and urban populations. Obes Rev. 2002. 3:197–202.19. Korea Institute of Health and Social Affairs. Summary Report: National Health and Nutrition Survey in 1998. 1999. Seoul: Ministry of Heath & Walfare.20. Brogan D. Software for sample survey data, misuse of standard packages. 1998. New York: Wiley.21. Must A, Dallal GE, Dietz WH. Reference data for obesity: 85th and 95th percentiles of body mass index (wt/ht2) and triceps skinfold thickness. Am J Clin Nutr. 1991. 53:839–846.
Article22. Moon OR, Kim NS, Jang SM, Yoon TH, Kim SO. The relationship between body mass index and the prevalence of obesity-related diseases based on the 1995 national health interview survey in Korea. Obesity Reviews. 2002. 3:191–196.
Article23. Kaneko K, Kiriike N, Ikenaga K, Miyawaki D, Yamagami S. Weight and shape concerns and dieting behaviours among pre-adolescents and adolescents in Japan. Psychiatry Clin Neurosci. 1999. 53:365–371.
Article24. Kim Y, Suh YK, Choi H. BMI and metabolic disorders in South Korean adults: 1998 Korea National Health and Nutrition Survey. Obes Res. 2004. 12:445–453.
Article25. Park HS, Yun YS, Park JY, Kim YS, Choi JM. Obesity, abdominal obesity, and clustering of cardiovascular risk factors in South Korea. Asia Pac J Clin Nutr. 2003. 12:411–418.26. Shiwaku K, Anuurad E, Enkhmaa B, Nogi A, Kitajima K, Shimono K, Yamane Y, Oyunsuren T. Overweight Japanese with body mass indexes of 23.0-24.9 have higher risks for obesity-associated disorders: a comparison of Japanese and Mongolians. Int J Obes Relat Metab Disord. 2004. 28:152–158.
Article
- Full Text Links
-
- Actions
-
Cited
- CITED
-
- Close
- Share
-
- Similar articles
-
- A Comparative Study of Youth Health Risk Behaviors by Region: Focused on Metropolitan Areas, Medium Sized and Small City Areas, and Rural Areas
- Regional differences in the associations of diet quality, obesity, and possible sarcopenia using the seventh Korea National Health and Nutrition Examination Survey (2016-2018)
- The Prevalence and the Related Factors of Metabolic Syndrome in Urban and Rural Community
- Risk of all-cause mortality is associated with multiple healthrelated lifestyle behaviors and does not differ between urban and rural areas in Korea
- A Comparative Study on Health Promotion Behaviors and Affecting Factors of Aged Women in Urban and Rural Area
