Preliminary Experience Using Dynamic MRI at 3.0 Tesla for Evaluation of Soft Tissue Tumors
- Affiliations
-
- 1Department of Radiology, Seoul St. Mary's Hospital, College of Medicine, The Catholic University of Korea, Seoul 137-701, Korea. whjee@catholic.ac.kr
- 2Department of Radiology, Incheon St. Mary's Hospital, College of Medicine, The Catholic University of Korea, Incheon 137-701, Korea.
- 3Department of Radiology, Kangbuk Samsung Hospital, Sungkyunkwan University School of Medicine, Seoul 110-746, Korea.
- KMID: 1430052
- DOI: http://doi.org/10.3348/kjr.2013.14.1.102
Abstract
OBJECTIVE
We aimed to evaluate the use of dynamic contrast enhanced magnetic resonance imaging (DCE-MRI) at 3.0 T for differentiating the benign from malignant soft tissue tumors. Also we aimed to assess whether the shorter length of DCE-MRI protocols are adequate, and to evaluate the effect of temporal resolution.
MATERIALS AND METHODS
Dynamic contrast-enhanced magnetic resonance imaging, at 3.0 T with a 1 second temporal resolution in 13 patients with pathologically confirmed soft tissue tumors, was analyzed. Visual assessment of time-signal curves, subtraction images, maximal relative enhancement at the first (maximal peak enhancement [Emax]/1) and second (Emax/2) minutes, Emax, steepest slope calculated by using various time intervals (5, 30, 60 seconds), and the start of dynamic enhancement were analyzed.
RESULTS
The 13 tumors were comprised of seven benign and six malignant soft tissue neoplasms. Washout on time-signal curves was seen on three (50%) malignant tumors and one (14%) benign one. The most discriminating DCE-MRI parameter was the steepest slope calculated, by using at 5-second intervals, followed by Emax/1 and Emax/2. All of the steepest slope values occurred within 2 minutes of the dynamic study. Start of dynamic enhancement did not show a significant difference, but no malignant tumor rendered a value greater than 14 seconds.
CONCLUSION
The steepest slope and early relative enhancement have the potential for differentiating benign from malignant soft tissue tumors. Short-length rather than long-length DCE-MRI protocol may be adequate for our purpose. The steepest slope parameters require a short temporal resolution, while maximal peak enhancement parameter may be more optimal for a longer temporal resolution.
Keyword
MeSH Terms
Figure
-
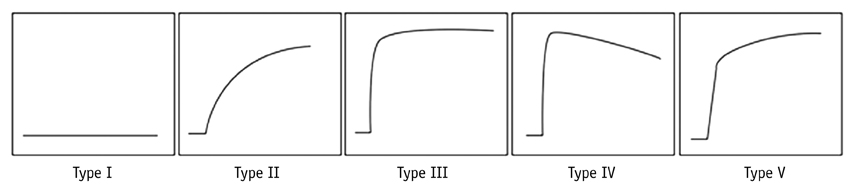
Fig. 1 Subjective classification of time-signal intensity curves were as follows. Type I = no enhancement, type II = gradual increase of enhancement, type III = rapid early enhancement followed by plateau phase, type IV = rapid early enhancement followed by washout, type V = rapid early enhancement followed by sustained delayed enhancement
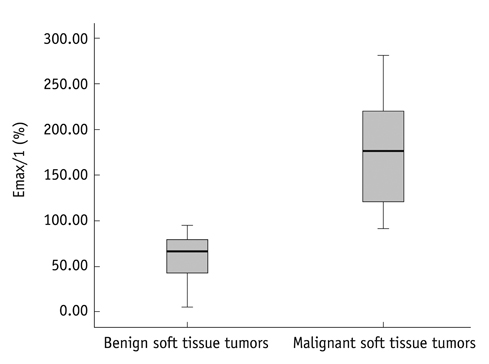
Fig. 2 Box plot of Emax/1 grouped by benign and malignant soft tissue tumor groups shows significant difference between two groups with malignant soft tissue tumor group showing higher Emax/1. Emax = maximal peak enhancement
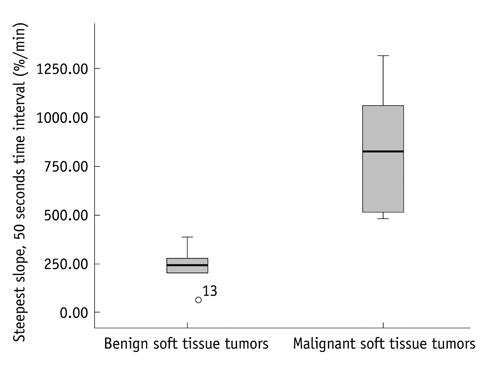
Fig. 3 Steepest slope calculated using 5 seconds time intervals was most discriminating factor. Box plot of steepest slope calculated using 5 seconds time intervals grouped by benign and malignant soft tissue tumor groups shows significant difference between two groups with malignant soft tissue tumor group showing higher steepest slope.

Fig. 4 DCE-MR images in patient with pathologically confirmed soft tissue lymphoma. A. Subtraction image S2-5 min representing washout shows diffuse washout in tumor. B. ROI drawn in lymphoma tumor. C. DCE-MR time-signal curve showing type IV curve. DCE-MR = dynamic contrast enhance magnetic resonance, ROI = region of interest
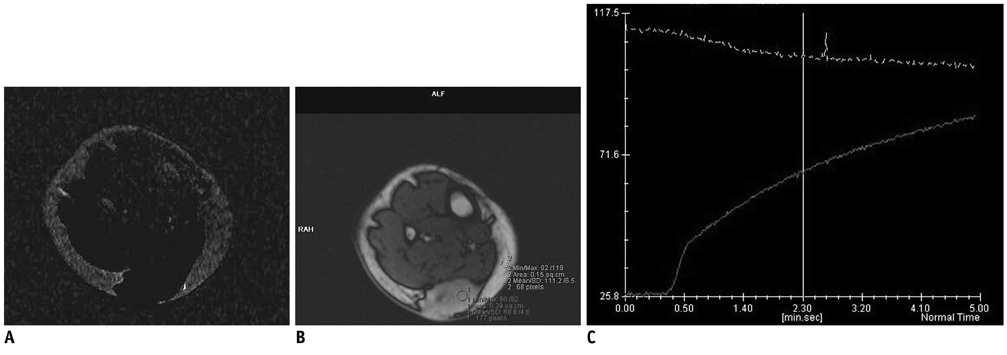
Fig. 5 DCE-MR images in patient with pathologically confirmed parachordoma. A. Subtraction image S2-5min representing washout shows no washout in tumor. B. ROI drawn in parachordoma tumor. C. DCE-MR time-signal curve showing type II curve. DCE-MR = dynamic contrast enhance magnetic resonance, ROI = region of interest
Reference
-
1. Erlemann R, Reiser MF, Peters PE, Vasallo P, Nommensen B, Kusnierz-Glaz CR, et al. Musculoskeletal neoplasms: static and dynamic Gd-DTPA--enhanced MR imaging. Radiology. 1989. 171:767–773.2. Verstraete KL, De Deene Y, Roels H, Dierick A, Uyttendaele D, Kunnen M. Benign and malignant musculoskeletal lesions: dynamic contrast-enhanced MR imaging--parametric "first-pass" images depict tissue vascularization and perfusion. Radiology. 1994. 192:835–843.3. van Rijswijk CS, Geirnaerdt MJ, Hogendoorn PC, Taminiau AH, van Coevorden F, Zwinderman AH, et al. Soft-tissue tumors: value of static and dynamic gadopentetate dimeglumine-enhanced MR imaging in prediction of malignancy. Radiology. 2004. 233:493–502.4. Tuncbilek N, Karakas HM, Okten OO. Dynamic contrast enhanced MRI in the differential diagnosis of soft tissue tumors. Eur J Radiol. 2005. 53:500–505.5. Carmeliet P, Jain RK. Angiogenesis in cancer and other diseases. Nature. 2000. 407:249–257.6. Kuhl CK, Mielcareck P, Klaschik S, Leutner C, Wardelmann E, Gieseke J, et al. Dynamic breast MR imaging: are signal intensity time course data useful for differential diagnosis of enhancing lesions? Radiology. 1999. 211:101–110.7. van der Woude HJ, Verstraete KL, Hogendoorn PC, Taminiau AH, Hermans J, Bloem JL. Musculoskeletal tumors: does fast dynamic contrast-enhanced subtraction MR imaging contribute to the characterization? Radiology. 1998. 208:821–828.8. Kuhl CK, Schild HH, Morakkabati N. Dynamic bilateral contrast-enhanced MR imaging of the breast: trade-off between spatial and temporal resolution. Radiology. 2005. 236:789–800.9. Moon M, Cornfeld D, Weinreb J. Dynamic contrast-enhanced breast MR imaging. Magn Reson Imaging Clin N Am. 2009. 17:351–362.10. Verstraete KL, Vanzieleghem B, De Deene Y, Palmans H, De Greef D, Kristoffersen DT, et al. Static, dynamic and first-pass MR imaging of musculoskeletal lesions using gadodiamide injection. Acta Radiol. 1995. 36:27–36.11. Fletcher BD, Hanna SL, Fairclough DL, Gronemeyer SA. Pediatric musculoskeletal tumors: use of dynamic, contrast-enhanced MR imaging to monitor response to chemotherapy. Radiology. 1992. 184:243–248.12. Lang P, Honda G, Roberts T, Vahlensieck M, Johnston JO, Rosenau W, et al. Musculoskeletal neoplasm: perineoplastic edema versus tumor on dynamic postcontrast MR images with spatial mapping of instantaneous enhancement rates. Radiology. 1995. 197:831–839.13. Ma LD, Frassica FJ, McCarthy EF, Bluemke DA, Zerhouni EA. Benign and malignant musculoskeletal masses: MR imaging differentiation with rim-to-center differential enhancement ratios. Radiology. 1997. 202:739–744.14. Fletcher BD, Reddick WE, Taylor JS. Dynamic MR imaging of musculoskeletal neoplasms. Radiology. 1996. 200:869–872.15. Lavini C, de Jonge MC, van de Sande MG, Tak PP, Nederveen AJ, Maas M. Pixel-by-pixel analysis of DCE MRI curve patterns and an illustration of its application to the imaging of the musculoskeletal system. Magn Reson Imaging. 2007. 25:604–612.16. Lavini C, Pikaart BP, de Jonge MC, Schaap GR, Maas M. Region of interest and pixel-by-pixel analysis of dynamic contrast enhanced magnetic resonance imaging parameters and time-intensity curve shapes: a comparison in chondroid tumors. Magn Reson Imaging. 2009. 27:62–68.17. Ahn SJ, An CS, Koom WS, Song HT, Suh JS. Correlations of 3T DCE-MRI quantitative parameters with microvessel density in a human-colorectal-cancer xenograft mouse model. Korean J Radiol. 2011. 12:722–730.18. Yang J, Kim JH, Im GH, Heo H, Yoon S, Lee J, et al. Evaluation of antiangiogenic effects of a new synthetic candidate drug KR-31831 on xenografted ovarian carcinoma using dynamic contrast enhanced MRI. Korean J Radiol. 2011. 12:602–610.19. Pabst T, Kenn W, Kaiser WA, Hahn D. Understanding why contrast enhancement in dynamic MRI is not reproducible: illustration with a simple phantom. Breast J. 2001. 7:166–170.
- Full Text Links
-
- Actions
-
Cited
- CITED
-
- Close
- Share
-
- Similar articles
-
- The Evaluation of Magnetic Resonance Imaging Application in Treatment of Tumors in Orthopedics
- Evaluation of the Patterns of Fractures and the Soft Tissue Injury Using MRI in Tibial Plateau Fractures
- MR appearances of intracranial tumors with a low tesla (0.064 T) permanent MR system
- MR Imaging of Uncommon Soft Tissue Tumors in the Foot: A Pictorial Essay
- Ultrasonography of soft tissue "oops lesions"
