Three-dimensional CT angiography of the canine hepatic vasculature
- Affiliations
-
- 1Department of Radiology, College of Veterinary Medicine, Seoul National University, Seoul 151-742, Korea. mcchoi@snu.ac.kr
- KMID: 1104917
- DOI: http://doi.org/10.4142/jvs.2008.9.4.407
Abstract
- Eight Beagle dogs were anesthetized and were imaged using a single channel helical CT scanner. The contrast medium used in this study was iohexol (300 mg I/ml) and doses were 0.5 ml/kg for a cine scan, 3 ml/kg for an enhanced scan. The flow rate for contrast material administration was 2 ml/sec for all scans. This study was divided into three steps, with unenhanced, cine and enhanced scans. The enhanced scan was subdivided into the arterial phase and the venous phase. All of the enhanced scans were reconstructed in 1 mm intervals and the scans were interpreted by the use of reformatted images, a cross sectional histogram, maximum intensity projection and shaded surface display. For the cine scans, optimal times were a 9-sec delay time post IV injection in the arterial phase, and an 18-sec delay time post IV injection in the venous phase. A nine-sec delay time was acceptable for the imaging of the canine hepatic arteries by CT angiography. After completion of arterial phase scanning, venous structures of the liver were well visualized as seen on the venous phase.
MeSH Terms
Figure
-
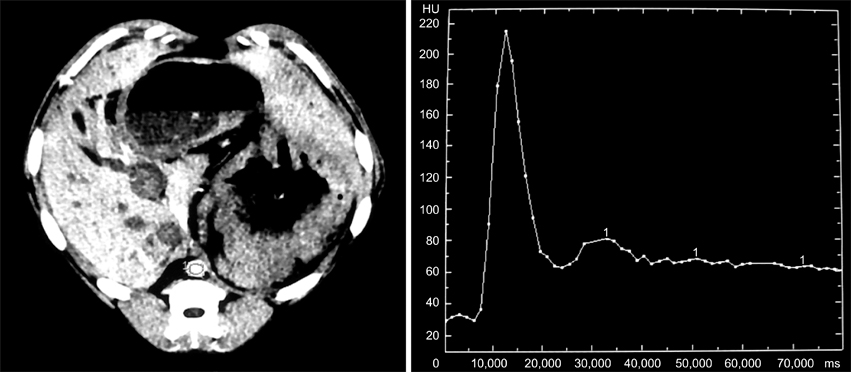
Fig. 1 A time-attenuation graph. On cine scan images, the region of interest (ROI) was set up in the center of the aorta, and then a time-attenuation graph was constructed from the ROI.

Fig. 2 The delay time was confirmed in the aorta through a time-attenuation graph. The threshold (dash arrow) was baseline Hounsfield unit value (open arrow) added on 20 Hounsfield unit (HU). The delay time (arrow) was the first time that exceeded over this threshold.
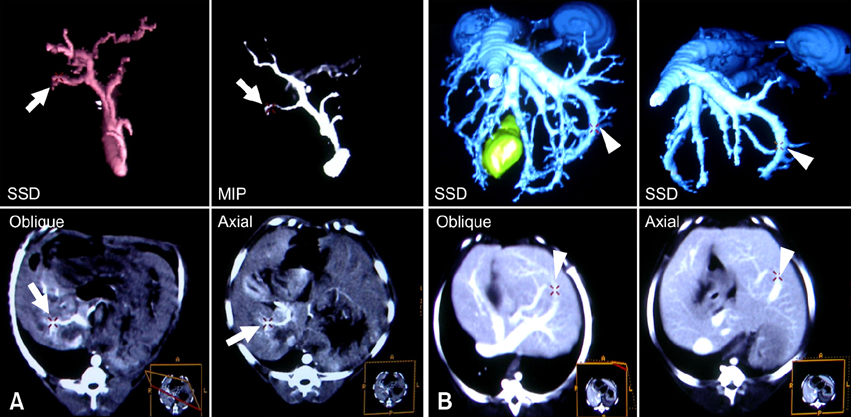
Fig. 3 Each vessel was confirmed anatomical location through shaded surface display (SSD), maximum intensity projection (MIP), axial and oblique images (A and B). Rt. hepatic a. branch (arrows), Lt. Lateral hepatic vein (arrowheads).
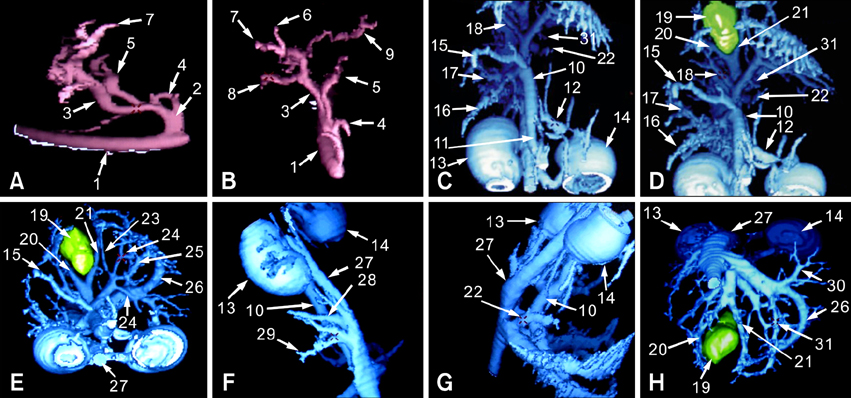
Fig. 4 Hepatic vascular structures in three-dimensional (3D) shaded surface display images (A-H). Figs. A and B are arterial 3D structures. Figs. C-H are portal and hepatic venous 3D structures (1 = aorta; 2 = celiac a.; 3 = hepatic a.; 4 = cranial mesenteric a.; 5 = left gastric a.; 6 = right gastric a.; 7 = gastroduodenal a.; 8 = right hepatic a. branch; 9 = left hepatic a. branch; 10 = main portal v.; 11 = cranial mesenteric v.; 12 = caudal mesenteric v.; 13 = right kidney; 14 = left kidney; 15 = gastroduodenal v.; 16 = caudate portal v.; 17 = right lateral portal v.; 18 = right medial portal v.; 19 = gall bladder; 20 = right medial hepatic v.; 21 = quadrate hepatic v.; 22 = papillary hepatic v.; 23 = quadrate portal v.; 24 = left medial portal v.; 25 = left lateral portal v.; 26 = left lateral hepatic v.; 27 = caudal vena cava; 28 = caudate hepatic v.; 29 = right lateral hepatic v.; 30 = left medial hepatic v.; 31 = papillary portal v.).
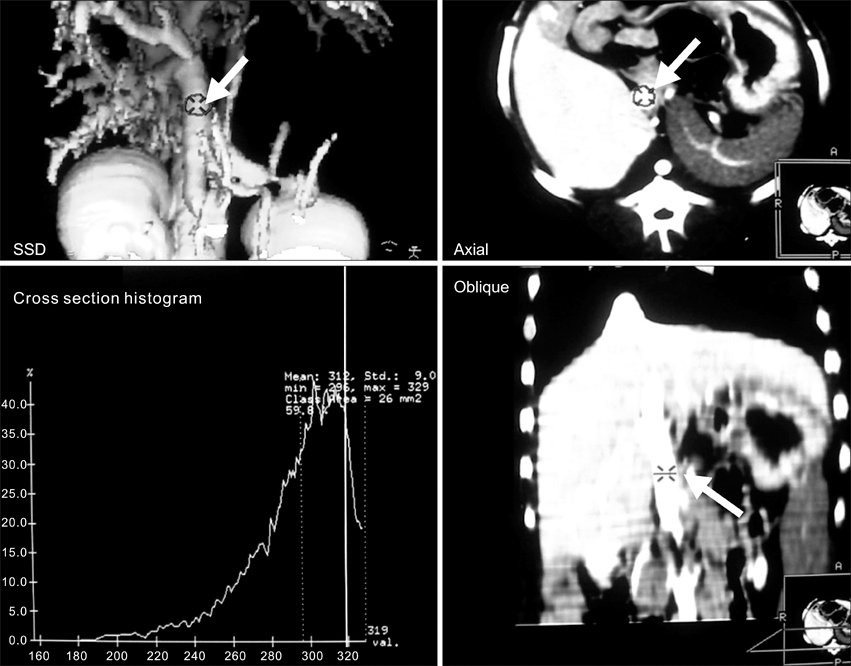
Fig. 5 Average pixel intensity values were measured by defined area (arrows).
Reference
-
1. Awai K, Takada K, Onishi H, Hori S. Aortic and hepatic enhancement and tumor-to-liver contrast: analysis of the effect of different concentrations of contrast material at multi-detector row helical CT. Radiology. 2002. 224:757–763.
Article2. Carlisle CH, Wu JX, Heath TJ. Anatomy of the portal and hepatic veins of the dog: a basis for systematic evaluation of the liver by ultrasonography. Vet Radiol Ultrasound. 1995. 36:227–233.
Article3. Frank P, Mahaffey M, Egger C, Cornell KK. Helical computed tomographic portography in ten normal dogs and ten dogs with a portosystemic shunt. Vet Radiol Ultrasound. 2003. 44:392–400.
Article4. Han JK, Choi BI, Kim AY, Kim SJ. Contrast media in abdominal computed tomography: optimization of delivery methods. Korean J Radiol. 2001. 2:28–36.
Article5. Henseler KP, Pozniak MA, Lee FT Jr, Winter TC 3rd. Three-dimensional CT angiography of spontaneous portosystemic shunts. Radiographics. 2001. 21:691–704.
Article6. Katyal S, Oliver JH 3rd, Buck DG, Federle MP. Detection of vascular complications after liver transplantation: early experience in multislice CT angiography with volume rendering. AJR Am J Roentgenol. 2000. 175:1735–1739.7. Maher MM, Kalra MK, Sahani DV, Perumpillichira JJ, Rizzo S, Saini S, Mueller PR. Techniques, clinical applications and limitations of 3D reconstruction in CT of the abdomen. Korean J Radiol. 2004. 5:55–67.
Article8. Schmidt S, Lohse CL, Suter PF. Branching patterns of the hepatic artery in the dog: arteriographic and anatomic study. Am J Vet Res. 1980. 41:1090–1097.9. Smith PA, Klein AS, Heath DG, Chavin K, Fishman EK. Dual-phase spiral CT angiography with volumetric 3D rendering for preoperative liver transplant evaluation: preliminary observations. J comput Assist Tomogr. 1998. 22:868–874.
Article10. Urban BA, Ratner LE, Fishman EK. Three-dimensional volume-rendered CT angiography of the renal arteries and veins: normal anatomy, variants, and clinical applications. Radiographics. 2001. 21:373–386.
Article11. Zwingenberger AL, Schwarz T. Dual-phase CT angiography of the normal canine portal and hepatic vasculature. Vet Radiol Ultrasound. 2004. 45:117–124.
Article
- Full Text Links
-
- Actions
-
Cited
- CITED
-
- Close
- Share
-
- Similar articles
-
- Multidetector-row CT Angiography of Hepatic Artery: Comparison with Conventional Angiography
- Assessment of Hepatic Arterial Variation Using Multidetector Helical CT-Angiography
- Computed tomographic anatomy of hepatic artery in normal beagle dogs
- Usefulness of Two-dimensioanl CT & Three-dimensional CT in Blow-out Fracture
- Hepatic and splenic angiosarcoma: A case report
