Multidisciplinary Functional MR Imaging for Prostate Cancer
- Affiliations
-
- 1Department of Radiology and Research Institute of Radiology, Asan Medical Center, University of Ulsan College of Medicine, Seoul 138-736, Korea. rialto@amc.seoul.kr
- 2Department of Radiology, Kyungpook National University Hospital, Daegu 700-721, Korea.
- 3MRI team, Korea Basic Science Institute, Daejeon 305-333, Kore.
- KMID: 1102556
- DOI: http://doi.org/10.3348/kjr.2009.10.6.535
Abstract
- Various functional magnetic resonance (MR) imaging techniques are used for evaluating prostate cancer including diffusion-weighted imaging, dynamic contrast-enhanced MR imaging, and MR spectroscopy. These techniques provide unique information that is helpful to differentiate prostate cancer from non-cancerous tissue and have been proven to improve the diagnostic performance of MRI not only for cancer detection, but also for staging, post-treatment monitoring, and guiding prostate biopsies. However, each functional MR imaging technique also has inherent challenges. Therefore, in order to make accurate diagnoses, it is important to comprehensively understand their advantages and limitations, histologic background related with image findings, and their clinical relevance for evaluating prostate cancer. This article will review the basic principles and clinical significance of functional MR imaging for evaluating prostate cancer.
Keyword
MeSH Terms
Figure
-

Fig. 1 Diffusion-weighted imaging. A, B. Diffusion-weighted imagings in regions of interest (arrows) with b-values of 0 s/mm2 (A) and 1,000 s/mm2 (B). C. Apparent diffusion coefficient map. D. Logarithmic-scale signal intensity of diffusion-weighted imagings plotted against b-values. Signal intensities in region of interest (arrows in A-C) are 1,412 a.u. with b-value of 0 s/mm2 and 186 a.u. as well as with b-value of 1,000 s/mm2. Therefore, apparent diffusion coefficient is 2.027 × 10⁻³ mm/s2.
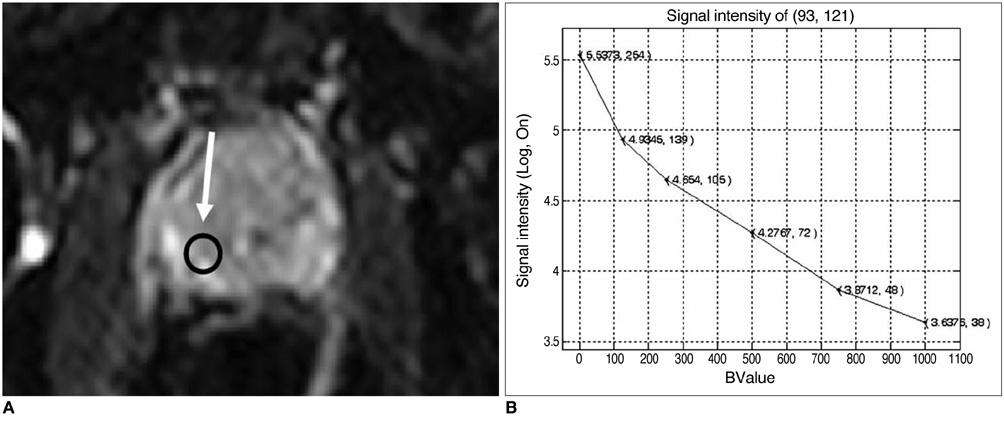
Fig. 2 Effect of b-values on apparent diffusion coefficient. A. Region of interest (arrow) drawn on diffusion-weighted imaging. B. Logarithmic-scale signal intensity of diffusion-weighted imaging plotted against b-values (0, 125, 250, 500, 750, 1,000 mm2/s) used to acquire diffusion-weighted imaging. Logarithmic-scale signal intensity at y-axis is plotted against b-value at x-axis. Each datum point in plot is denoted by two numbers: logarithmic-scale signal intensity, original signal intensity. Different apparent diffusion coefficient values were computed by different pairs of b-values: 4.78 × 10⁻³ mm/s2 with b-values of 0 and 125 mm2/s, as well as 1.41 × 10⁻³ mm/s2 with b-values of 125, 250, 500, 750 and 1,000 mm2/s. Apparent diffusion coefficient value was higher with pair of lower b-values because of increased contributions from perfusion effects.

Fig. 3 Apparent diffusion coefficient values in various regions of prostate. A. Gross pathological image of radical prostatectomy specimen. Prostate cancer is marked with outline. B-D. Apparent diffusion coefficient map (B), diffusion-weighted imaging (C) and T2-weighted imaging (D) corresponding to A. Prostate cancer (arrows) shows low signal intensity on apparent diffusion coefficient map and high signal intensity on diffusion-weighted imaging. Prostate cancer is clearly identified on apparent diffusion coefficient map and diffusion-weighted imaging, whereas T2-weighted imaging shows lower lesion conspicuity. Prostate cancer is outlined in A. Apparent diffusion coefficients are 0.95 × 10⁻³ mm/s2 in prostate cancer, 1.02 × 10⁻³ mm/s2 in non-cancerous transitional zone tissue (black circle in B), and 1.14 × 10⁻³ mm/s2 in non-cancerous peripheral zone tissue (white circle in B).
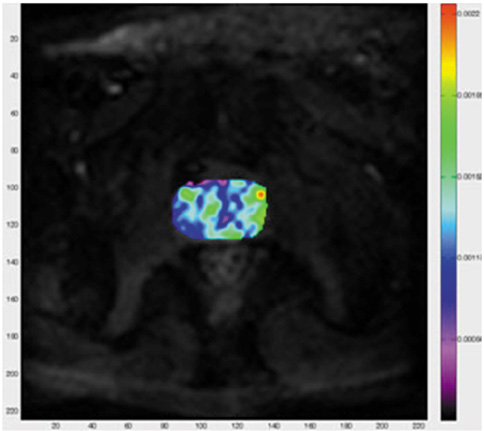
Fig. 4 Distribution of apparent diffusion coefficient in non-cancerous tissue on color-coded apparent diffusion coefficient map. Scale of color display ranges from 0.5 × 10⁻³ mm/s2 (black) to 2.2 × 10⁻³ mm/s2 (red). Apparent diffusion coefficient of non-cancerous tissue ranges from 0.84 × 10⁻³ mm/s2 to 2.2 × 10⁻³ mm/s2.
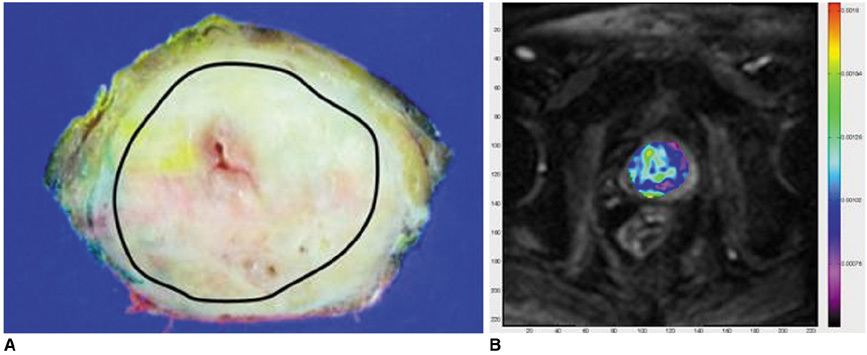
Fig. 5 Distribution of apparent diffusion coefficient on color-coded apparent diffusion coefficient map in 62-year-old patient with prostate cancer. A. Gross pathological image of radical prostatectomy specimen. Prostate cancer is marked with black line. B. Corresponding apparent diffusion coefficient map. Scale of color display ranges from 0.5 × 10⁻³ mm/s2 (black) to 1.8 × 10⁻³ mm/s2 (red). Apparent diffusion coefficient of prostate cancer ranges from 0.59 × 10⁻³ mm/s2 to 1.8 × 10⁻³ mm/s2.

Fig. 6 Road map for prostate biopsy. A. T2-weighted imaging of prostate from 59-year-old man with elevated prostate-specific antigen levels (13.5 ng/ml) and prior negative biopsy result. B. Corresponding apparent diffusion coefficient map. Two lesions (arrows) in transitional zone show low signal intensity on apparent diffusion coefficient map, whereas they are not clearly identified on T2-weighted imaging. Targeted biopsy of these lesions was performed under transrectal ultrasonography-guide in which, two lesions were confirmed to be prostate cancer.
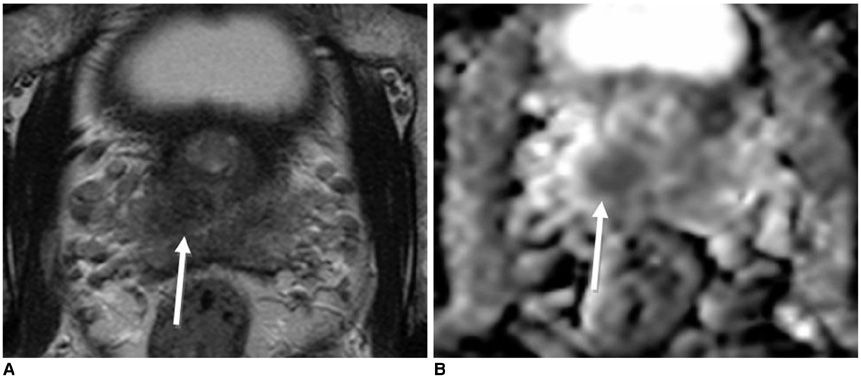
Fig. 7 T2-weighted imaging (A) and apparent diffusion coefficient map (B) of prostate from 61-year-old man with elevated prostate-specific antigen levels (10.6 ng/ml). Lesion (arrows) in transitional zone shows low signal intensity on both T2-weighted imaging and apparent diffusion coefficient map. Targeted biopsy of this lesion was performed under transrectal ultrasonography-guide, but no cancer was identified.
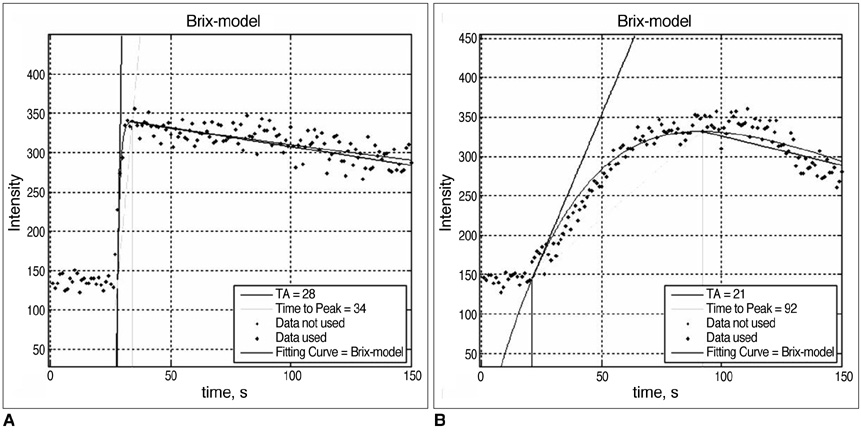
Fig. 8 Time-intensity curves of prostate cancer (A) and non-cancerous tissue (B). Compared to non-cancerous tissue, prostate cancer tissue shows early and strong enhancement as well as rapid de-enhancement.

Fig. 9 Schematic drawing of two compartment model. IV contrast material, when administrated, exists in two compartments such as intravascular space and extravascular (interstitial) spaces. In addition, IV contrast material transfer between these two compartments is dependent on difference of concentration between two compartments.
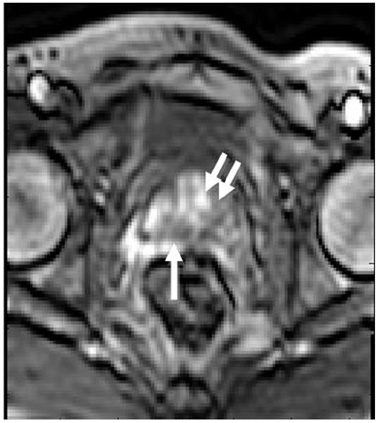
Fig. 10 Dynamic contrast-enhanced MR image of 68-year-old male patient with prostate cancer. Ktrans, Ve, initial upslope, Kep, peak enhancement, and wash-out are 0.091/s, 0.137, 30/s, 0.77/s, 350 a.u., and -1.34/s in prostate cancer (double arrows), and 0.018/s, 0.100, 19/s, 0.12/s, 150 a.u., and 0.78/s in non-cancerous tissue (arrow), respectively.
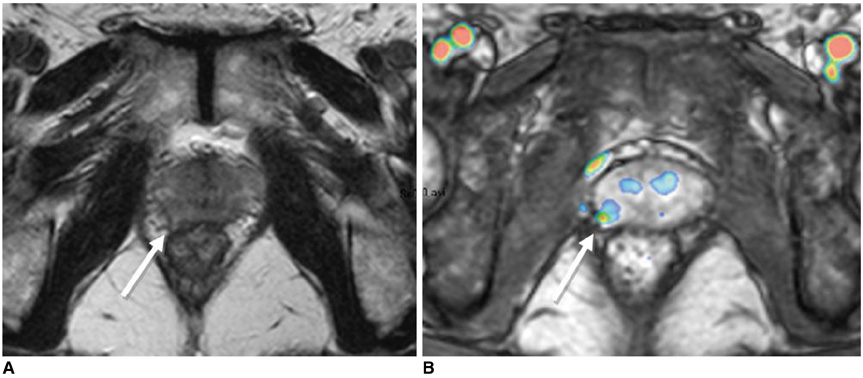
Fig. 11 T2-weighted imaging (A) and Kep map (B) of 59-year-old male patient with prostate cancer (arrows). On T2-weighted imaging, extracapsular extension of prostate cancer is not clearly identified. Kep map shows cancer focus in peripheral zone of right lobe. According to T2-weighted imaging and Kep map, extracapsular extension was suggested. Pathologic finding confirmed extracapsular extension in same site.

Fig. 12 Transitional zone versus prostate cancer. A. Gross pathological image of radical prostatectomy specimen located where area of prostate cancer is outlined. B. Ktrans map shows increased perfusion in transitional and peripheral zones of right lobe. Multiple foci of high permeability areas in transitional zone are related with benign prostatic hyperplasia rather than prostate cancer.

Fig. 13 Spectroscopy in prostate cancer. A. Typical spectrum of prostate cancer, where choline peak (double arrows) is increased and citrate peak (arrow) is decreased. B. Typical spectrum of non-cancerous tissue, which shows high citrate peak (arrow), as well as triplet on 3T MR spectroscopy.
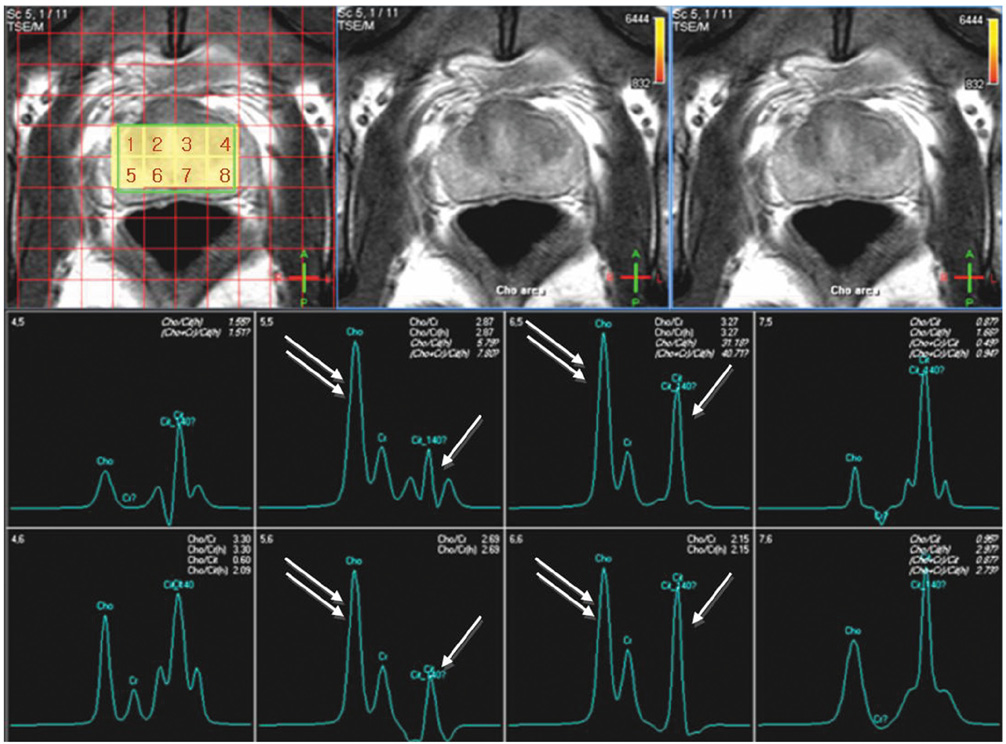
Fig. 14 Images of 62-year-old man with prostate cancer. Although prostate cancer is not clearly identified on T2-weighted imaging, MR spectroscopy shows increased choline and creatine (double arrows) over citrate (arrow) ratio in voxels 2, 3, 6 and 7, which were confirmed to be prostate cancer.
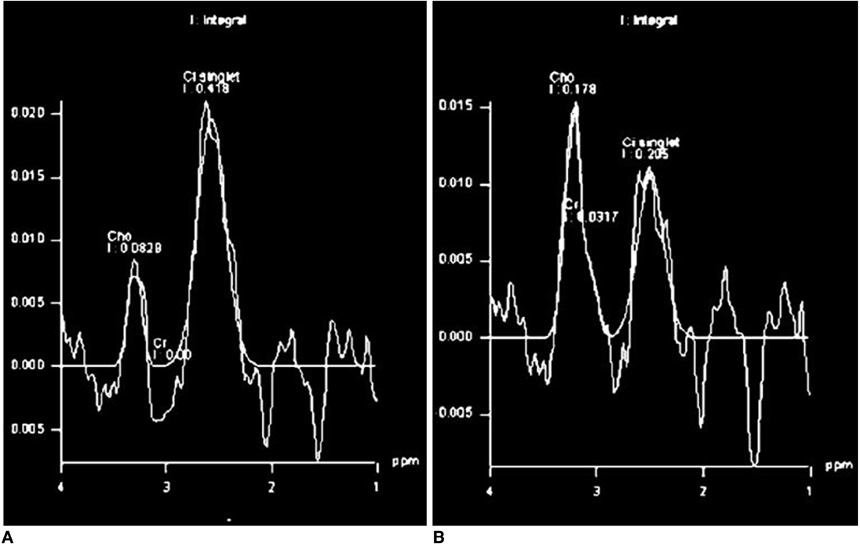
Fig. 15 MR spectra (A, B) in single voxel. Ratio of choline and creatine over citrate changes after post-processing.
Reference
-
1. Choi YJ, Kim JK, Kim N, Kim KW, Choi EK, Cho KS. Functional MR imaging of prostate cancer. Radiographics. 2007. 27:63–75.2. Hricak H, Choyke PL, Eberhardt SC, Leibel SA, Scardino PT. Imaging prostate cancer: a multidisciplinary perspective. Radiology. 2007. 243:28–53.3. Le Bihan D, Breton E, Lallemand D, Aubin ML, Vignaud J, Laval-Jeantet M. Separation of diffusion and perfusion in intravoxel incoherent motion MR imaging. Radiology. 1988. 168:497–505.4. Somford DM, Fütterer JJ, Hambrock T, Barentsz JO. Diffusion and perfusion MR imaging of the prostate. Magn Reson Imaging Clin N Am. 2008. 16:685–695.5. Mulkern RV, Barnes AS, Haker SJ, Hung YP, Rybicki FJ, Maier SE, et al. Biexponential characterization of prostate tissue water diffusion decay curves over an extended b-factor range. Magn Reson Imaging. 2006. 24:563–568.6. Moseley ME, Butts K, Yenari MA, Marks M, de Crespigny A. Clinical aspects of DWI. NMR Biomed. 1995. 8:387–396.7. Tamada T, Sone T, Jo Y, Toshimitsu S, Yamashita T, Yamamoto A, et al. Apparent diffusion coefficient values in peripheral and transition zones of the prostate: comparison between normal and malignant prostatic tissues and correlation with histologic grade. J Magn Reson Imaging. 2008. 28:720–726.8. Cornfeld DM, Weinreb JC. MR imaging of the prostate: 1.5T versus 3T. Magn Reson Imaging Clin N Am. 2007. 15:433–448.9. Lim HK, Kim JK, Kim KA, Cho KS. Prostate cancer: apparent diffusion coefficient map with T2-weighted images for detection - a multireader study. Radiology. 2009. 250:145–151.10. Kim JH, Kim JK, Park BW, Kim N, Cho KS. Apparent diffusion coefficient: prostate cancer versus noncancerous tissue according to anatomical region. J Magn Reson Imaging. 2008. 28:1173–1179.11. Hambrock T, Fütterer JJ, Huisman HJ, Hulsbergen-vandeKaa C, van Basten JP, van Oort I, et al. Thirty-two-channel coil 3T magnetic resonance-guided biopsies of prostate tumor suspicious regions identified on multimodality 3T magnetic resonance imaging: technique and feasibility. Invest Radiol. 2008. 43:686–694.12. Coakley FV, Hricak H. Radiologic anatomy of the prostate gland: a clinical approach. Radiol Clin North Am. 2000. 38:15–30.13. Kim CK, Park BK, Lee HM, Kwon GY. Value of diffusion-weighted imaging for the prediction of prostate cancer location at 3T using a phased-array coil: preliminary results. Invest Radiol. 2007. 42:842–847.14. Tamada T, Sone T, Toshimitsu S, Imai S, Jo Y, Yoshida K, et al. Age-related and zonal anatomical changes of apparent diffusion coefficient values in normal human prostatic tissues. J Magn Reson Imaging. 2008. 27:552–556.15. Sato C, Naganawa S, Nakamura T, Kumada H, Miura S, Takizawa O, et al. Differentiation of noncancerous tissue and cancer lesions by apparent diffusion coefficient values in transition and peripheral zones of the prostate. J Magn Reson Imaging. 2005. 21:258–262.16. Issa B. In vivo measurement of the apparent diffusion coefficient in normal and malignant prostatic tissues using echo-planar imaging. J Magn Reson Imaging. 2002. 16:196–200.17. Hosseinzadeh K, Schwarz SD. Endorectal diffusion-weighted imaging in prostate cancer to differentiate malignant and benign peripheral zone tissue. J Magn Reson Imaging. 2004. 20:654–661.18. Gibbs P, Pickles MD, Turnbull LW. Diffusion imaging of the prostate at 3.0 tesla. Invest Radiol. 2006. 41:185–188.19. Kim CK, Park BK. Update of prostate magnetic resonance imaging at 3 T. J Comput Assist Tomogr. 2008. 32:163–172.20. Miao H, Fukatsu H, Ishigaki T. Prostate cancer detection with 3-T MRI: comparison of diffusion-weighted and T2-weighted imaging. Eur J Radiol. 2007. 61:297–302.21. Chen M, Dang HD, Wang JY, Zhou C, Li SY, Wang WC, et al. Prostate cancer detection: comparison of T2-weighted imaging, diffusion-weighted imaging, proton magnetic resonance spectroscopic imaging, and the three techniques combined. Acta Radiol. 2008. 49:602–610.22. Haider MA, van der Kwast TH, Tanguay J, Evans AJ, Hashmi AT, Lockwood G, et al. Combined T2-weighted and diffusion-weighted MRI for localization of prostate cancer. AJR Am J Roentgenol. 2007. 189:323–328.23. Tanimoto A, Nakashima J, Kohno H, Shinmoto H, Kuribayashi S. Prostate cancer screening: the clinical value of diffusion-weighted imaging and dynamic MR imaging in combination with T2-weighted imaging. J Magn Reson Imaging. 2007. 25:146–152.24. Morgan VA, Kyriazi S, Ashley SE, DeSouza NM. Evaluation of the potential of diffusion-weighted imaging in prostate cancer detection. Acta Radiol. 2007. 48:695–703.25. Tamada T, Sone T, Jo Y, Yamamoto A, Yamashita T, Egashira N, et al. Prostate cancer: relationships between postbiopsy hemorrhage and tumor detectability at MR diagnosis. Radiology. 2008. 248:531–539.26. Park BK, Lee HM, Kim CK, Choi HY, Park JW. Lesion localization in patients with a previous negative transrectal ultrasound biopsy and persistently elevated prostate specific antigen level using diffusion-weighted imaging at three Tesla before rebiopsy. Invest Radiol. 2008. 43:789–793.27. Kim CK, Choi D, Park BK, Kwon GY, Lim HK. Diffusion-weighted MR imaging for the evaluation of seminal vesicle invasion in prostate cancer: initial results. J Magn Reson Imaging. 2008. 28:963–969.28. Gibbs P, Tozer DJ, Liney GP, Turnbull LW. Comparison of quantitative T2 mapping and diffusion-weighted imaging in the normal and pathologic prostate. Magn Reson Med. 2001. 46:1054–1058.29. Bando H. Vascular endothelial growth factor and bevacitumab in breast cancer. Breast Cancer. 2007. 14:163–173.30. Kim JK, Hong SS, Choi YJ, Park SH, Ahn H, Kim CS, et al. Wash-in rate on the basis of dynamic contrast-enhanced MRI: usefulness for prostate cancer detection and localization. J Magn Reson Imaging. 2005. 22:639–646.31. Barrett T, Brechbiel M, Bernardo M, Choyke PL. MRI of tumor angiogenesis. J Magn Reson Imaging. 2007. 26:235–249.32. Jackson MW, Bentel JM, Tilley WD. Vascular endothelial growth factor (VEGF) expression in prostate cancer and benign prostatic hyperplasia. J Urol. 1997. 157:2323–2328.33. Fütterer JJ, Heijmink SW, Scheenen TW, Veltman J, Huisman HJ, Vos P, et al. Prostate cancer localization with dynamic contrast-enhanced MR imaging and proton MR spectroscopic imaging. Radiology. 2006. 241:449–458.34. Bloch BN, Furman-Haran E, Helbich TH, Lenkinski RE, Degani H, Kratzik C, et al. Prostate cancer: accurate determination of extracapsular extension with high-spatial-resolution dynamic contrast-enhanced and T2-weighted MR imaging -- initial results. Radiology. 2007. 245:176–185.35. Buckley DL, Roberts C, Parker GJ, Logue JP, Hutchinson CE. Prostate cancer: evaluation of vascular characteristics with dynamic contrast-enhanced T1-weighted MR imaging -- initial experience. Radiology. 2004. 233:709–715.36. Engelbrecht MR, Huisman HJ, Laheij RJ, Jager GJ, van Leenders GJ, Hulsbergen-Van De Kaa CA, et al. Discrimination of prostate cancer from normal peripheral zone and central gland tissue by using dynamic contrast-enhanced MR imaging. Radiology. 2003. 229:248–254.37. Tofts PS. Modeling tracer kinetics in dynamic Gd-DTPA MR imaging. J Magn Reson Imaging. 1997. 7:91–101.38. Larsson HB, Tofts PS. Measurement of blood-brain barrier permeability using dynamic Gd-DTPA scanning -- a comparison of methods. Magn Reson Med. 1992. 24:174–176.39. Brix G, Semmler W, Port R, Schad LR, Layer G, Lorenz WJ. Pharmacokinetic parameters in CNS Gd-DTPA enhanced MR imaging. J Comput Assist Tomogr. 1991. 15:621–628.40. Evelhoch J, Brown T, Chenevet T, Clarke L, Daniel B, Degani H, et al. Consensus recommendation for acquisition of dynamic contrasted-enhanced MRI data in oncology. National Cancer Institute web site. 2009. Accessed in February 5. http://imaging.cancer.gov/reportsandpublications/ReportsandPresentations/ConsensusRecommendationforA cquisitionofDynamicContrastedEnhancedMRIData.41. Kim CK, Park BK, Kim B. Localization of prostate cancer using 3T MRI: comparison of T2-weighted and dynamic contrast-enhanced imaging. J Comput Assist Tomogr. 2006. 30:7–11.42. van Dorsten FA, van der Graaf M, Engelbrecht MR, van Leenders GJ, Verhofstad A, Rijpkema M, et al. Combined quantitative dynamic contrast-enhanced MR imaging and (1)H MR spectroscopic imaging of human prostate cancer. J Magn Reson Imaging. 2004. 20:279–287.43. Fütterer JJ, Engelbrecht MR, Huisman HJ, Jager GJ, Hulsbergen-van De Kaa CA, Witjes JA, et al. Staging prostate cancer with dynamic contrast-enhanced endorectal MR imaging prior to radical prostatectomy: experienced versus less experienced readers. Radiology. 2005. 237:541–549.44. Casciani E, Polettini E, Carmenini E, Floriani I, Masselli G, Bertini L, et al. Endorectal and dynamic contrast-enhanced MRI for detection of local recurrence after radical prostatectomy. AJR Am J Roentgenol. 2008. 190:1187–1192.45. Haider MA, Davidson SR, Kale AV, Weersink RA, Evans AJ, Toi A, et al. Prostate gland: MR imaging appearance after vascular targeted photodynamic therapy with palladium-bacteriopheophorbide. Radiology. 2007. 244:196–204.46. Kim CK, Park BK, Park W, Kim SS. Prostate MR imaging at 3T using a phased-arrayed coil in predicting locally recurrent prostate cancer after radiation therapy: preliminary experience. Abdom Imaging. 2009. [Epub ahead of print].47. Padhani AR, Gapinski CJ, Macvicar DA, Parker GJ, Suckling J, Revell PB, et al. Dynamic contrast enhanced MRI of prostate cancer: correlation with morphology and tumour stage, histological grade and PSA. Clin Radiol. 2000. 55:99–109.48. Oyen RH. Dynamic contrast-enhanced MRI of the prostate: is this the way to proceed for characterization of prostatic carcinoma? Eur Radiol. 2003. 13:921–924.49. Ocak I, Bernardo M, Metzger G, Barrett T, Pinto P, Albert PS, et al. Dynamic contrast-enhanced MRI of prostate cancer at 3 T: a study of pharmacokinetic parameters. AJR Am J Roentgenol. 2007. 189:849.50. Vos PC, Hambrock T, Hulsbergen-van de Kaa CA, Fütterer JJ, Barentsz JO, Huisman HJ. Computerized analysis of prostate lesions in the peripheral zone using dynamic contrast enhanced MRI. Med Phys. 2008. 35:888–899.51. Fütterer JJ, Scheenen TW, Huisman HJ, Klomp DW, van Dorsten FA, Hulsbergen-van de Kaa CA, et al. Initial experience of 3 tesla endorectal coil magnetic resonance imaging and 1H-spectroscopic imaging of the prostate. Invest Radiol. 2004. 39:671–680.52. Kurhanewicz J, Vigneron DB. Advances in MR spectroscopy of the prostate. Magn Reson Imaging Clin N Am. 2008. 16:697–710.53. Males RG, Vigneron DB, Star-Lack J, Falbo SC, Nelson SJ, Hricak H, et al. Clinical application of BASING and spectral/spatial water and lipid suppression pulses for prostate cancer staging and localization by in vivo 3D 1H magnetic resonance spectroscopic imaging. Magn Reson Med. 2000. 43:17–22.54. Scheidler J, Hricak H, Vigneron DB, Yu KK, Sokolov DL, Huang LR, et al. Prostate cancer: localization with three-dimensional proton MR spectroscopic imaging -- clinicopathologic study. Radiology. 1999. 213:473–480.55. Shukla-Dave A, Hricak H, Kattan MW, Pucar D, Kuroiwa K, Chen HN, et al. The utility of magnetic resonance imaging and spectroscopy for predicting insignificant prostate cancer: an initial analysis. BJU Int. 2007. 99:786–793.56. Prando A, Kurhanewicz J, Borges AP, Oliveira EM Jr, Figueiredo E. Prostatic biopsy directed with endorectal MR spectroscopic imaging findings in patients with elevated prostate specific antigen levels and prior negative biopsy findings: early experience. Radiology. 2005. 236:903–910.57. Zakian KL, Sircar K, Hricak H, Chen HN, Shukla-Dave A, Eberhardt S, et al. Correlation of proton MR spectroscopic imaging with gleason score based on step-section pathologic analysis after radical prostatectomy. Radiology. 2005. 234:804–814.58. Qayyum A, Coakley FV, Lu Y, Olpin JD, Wu L, Yeh BM, et al. Organ-confined prostate cancer: effect of prior transrectal biopsy on endorectal MRI and MR spectroscopic imaging. AJR Am J Roentgenol. 2004. 183:1079–1083.59. Zakian KL, Eberhardt S, Hricak H, Shulka-Dave A, Kleinman S, Muruganandham M, et al. Transition zone prostate cancer: metabolic characteristics at 1H MR spectroscopic imaging-- initial results. Radiology. 2003. 229:241–247.
- Full Text Links
-
- Actions
-
Cited
- CITED
-
- Close
- Share
-
- Similar articles
-
- Multiparametric MRI in the Detection of Clinically Significant Prostate Cancer
- Medical imaging of prostate cancer
- Imaging Assessment of Primary Prostate Cancer, Focused on Advanced MR Imaging and PET/CT
- MR Imaging of the Prostate and Seminal Tract Using an Endorectal Surface Coil
- Multidisciplinary Team Approach in Prostate-Specific Membrane Antigen Theranostics for Prostate Cancer: A Narrative Review
