Power Doppler Imaging in Acute Renal Vein Occlusion and Recanalization: a Canine Model
- Affiliations
-
- 1Department of Radiology, Seoul National University College of Medicine, Seoul, Korea. kimio@radcom.snu.ac.kr
- 2Department of Radiology and Center for Imaging Science, Samsung Medical Center, Sungkyunkwan University School of Medicine, Seoul, Korea.
- KMID: 1098191
- DOI: http://doi.org/10.3348/kjr.2008.9.2.128
Abstract
OBJECTIVE
To evaluate the dynamic changes of the power Doppler (PD) in acute renal vein occlusion and recanalization in a canine model. MATERIALS AND METHODS: We performed a PD of the kidney during graded renal vein occlusion and recanalization induced by balloon inflation and deflation in nine dogs. The PD images were transferred to a personal computer, and the PD signals were quantified. RESULTS: We observed the temporal change of the PD signal during renal vein occlusion and recanalization, with a decrease in the PD signal during occlusion and an increase during recanalization. The mean PD signal decreased gradually as the renal vein was occluded, and conversely increased gradually with sequential relief of occlusion. The sequential change of the mean value of the PD signal was statistically significant. CONCLUSION: The PD can detect a change in renal blood flow during acute renal vein occlusion and recanalization in a canine model. The PD may be used as a helpful tool for the early detection of acute renal vein thrombosis and the monitoring of renal perfusion.
MeSH Terms
Figure
-
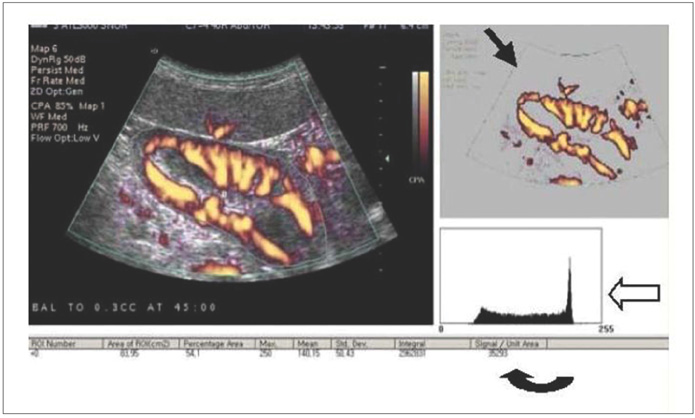
Fig. 1 Analysis of the power Doppler signal using quant PDI®. Upon manual delineation of region of interest along border of kidney, power values within region of interest as histogram (open arrow) and set of local statistical power Doppler features (curved arrow) are calculated and displayed. Note segmented image (arrow) in which gray scale component of power Doppler image was discarded.
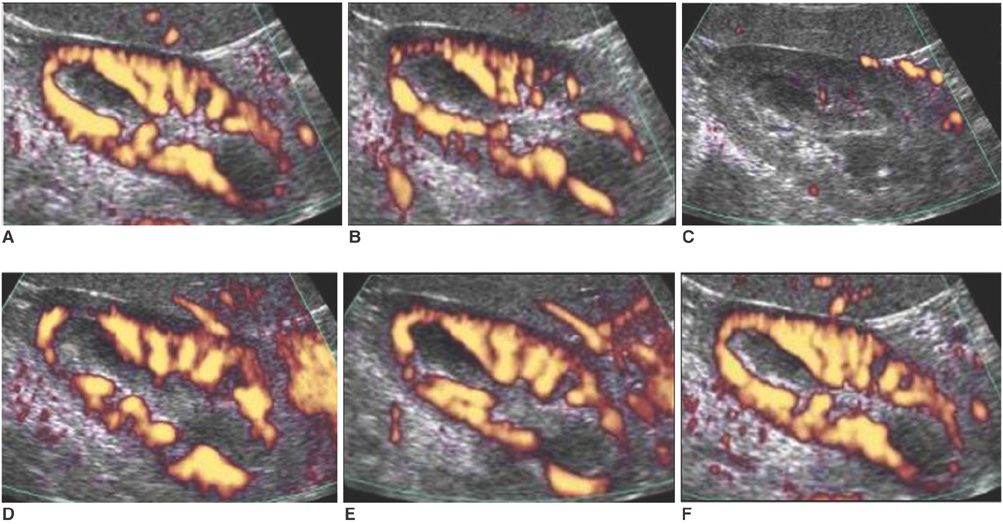
Fig. 2 Sequential change of the longitudinal power Doppler image of same region of dog kidney, during graded renal vein occlusion and recanalization. Baseline (A), partial occlusion (B), complete occlusion (C), partial recanalization (D), complete recanalization (E), and removal of catheter (F).

Fig. 3 Time course analysis of power Doppler signal during graded renal vein occlusion and recanalization in a dog. Note decrease of power Doppler signal during occlusion as well as increase in power Doppler signal during recanalization.
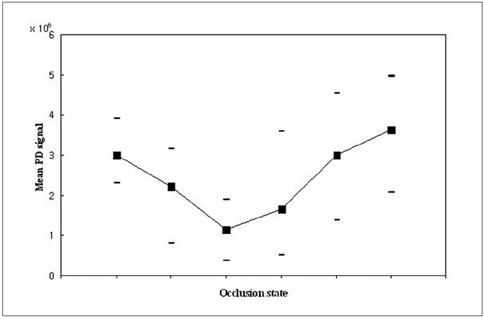
Fig. 4 Sequential change in mean power Doppler signal during graded renal vein occlusion and recanalization in nine dogs. Bars indicate largest and smallest value in each step. X-axis indicates occlusion state of renal vein, which includes baseline, partial occlusion, complete occlusion, partial recanalization, complete recanalization, and removal of catheter, respectively. Change was statistically significant (p < 0.01).
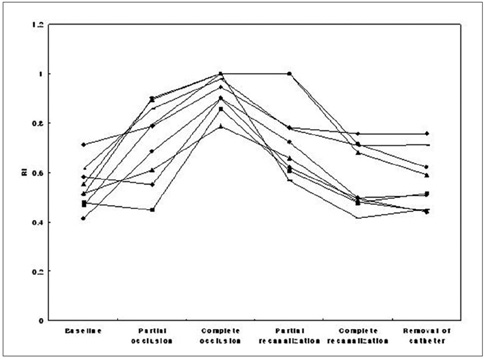
Fig. 5 Line graphs showing sequential changes in resistive index during graded renal vein occlusion and recanalization in nine dogs.
Reference
-
1. Hibbert J, Howlett DC, Greenwood KL, MacDonald LM, Saunders AJ. The ultrasound appearances of neonatal renal vein thrombosis. Br J Radiol. 1997. 70:1191–1194.2. Llach F, Papper S, Massry SG. The clinical spectrum of renal vein thrombosis: acute and chronic. Am J Med. 1980. 69:819–827.3. Laplante S, Patriquin HB, Robitaille P, Filiatrault D, Grignon A, Decarie JC. Renal vein thrombosis in children: evidence of early flow recovery with Doppler US. Radiology. 1993. 189:37–42.4. Paling MR, Wakefield JA, Watson LR. Sonography of experimental acute renal vein occlusion. J Clin Ultrasound. 1985. 13:647–653.5. Rosenfield AT, Zeman RK, Cronan JJ, Taylor KJ. Ultrasound in experimental and clinical renal vein thrombosis. Radiology. 1980. 137:735–741.6. Gatewood OM, Fishman EK, Burrow CR, Walker WG, Goldman SM, Siegelman SS. Renal vein thrombosis in patients with nephrotic syndrome: CT diagnosis. Radiology. 1986. 159:117–122.7. Petronis J. Renal imaging findings in renal vein thrombosis: a note of caution. Clin Nucl Med. 1989. 14:654–656.8. Kuwa T, Cancio LC, Sondeen JL, Matylevich N, Jordan BS, McManus AT, et al. Evaluation of renal cortical perfusion by noninvasive power Doppler ultrasound during vascular occlusion and reperfusion. J Trauma. 2004. 56:618–624.9. Miyajima T, Yokoyama H, Taira H, Tsuji Y. Quantitative estimation of renal blood flow by power Doppler ultrasonography in renovascular hypertensive dogs. Kidney Int. 2005. 68:2781–2786.10. Jun WS, Lee KH, Koo K, Kim D, Kim JH, Kim SH, et al. A straightforward algorithm for the quantification of power Doppler signals. Invest Radiol. 2002. 37:343–348.11. Bude RO, Rubin JM, Adler RS. Power versus conventional color Doppler sonography: comparison in the depiction of normal intrarenal vasculature. Radiology. 1994. 192:777–780.12. Durick JE, Winter TC 3rd, Schmiedl UP, Cyr DR, Starr FL 3rd, Mack LA. Renal perfusion: pharmacologic changes depicted with power Doppler US in an animal model. Radiology. 1995. 197:615–617.13. Hamper UM, DeJong MR, Caskey CI, Sheth S. Power Doppler imaging: clinical experience and correlation with color Doppler US and other imaging modalities. Radiographics. 1997. 17:499–513.14. Taylor GA, Barnewolt CE, Adler BH, Dunning PS. Renal cortical ischemia in rabbits revealed by contrast-enhanced power Doppler sonography. AJR Am J Roentgenol. 1998. 170:417–422.15. Helenon O, Correas JM, Chabriais J, Boyer JC, Melki P, Moreau JF. Renal vascular Doppler imaging: clinical benefits of power mode. Radiographics. 1998. 18:1441–1454.16. Platt JF, Ellis JH, Rubin JM. Intrarenal arterial Doppler sonography in the detection of renal vein thrombosis of the native kidney. AJR Am J Roentgenol. 1994. 162:1367–1370.17. Hricak H, Sandler MA, Madrazo BL, Eyler WR, Sy GS. Sonographic manifestations of acute renal vein thrombosis: an experimental study. Invest Radiol. 1981. 16:30–35.18. Braun B, Weilemann LS, Weigand W. Ultrasonic demonstration of renal vein thrombosis. Radiology. 1981. 138:157–158.19. Rifkin MD, Pasto ME, Goldberg BB. Duplex Doppler examination in renal disease: evaluation of vascular involvement. Ultrasound Med Biol. 1985. 11:341–346.20. Rosenberg ER, Trought WS, Kirks DR, Sumner TE, Grossman H. Ultrasonic diagnosis of renal vein thrombosis in neonates. AJR Am J Roentgenol. 1980. 134:35–38.21. Reuther G, Wanjura D, Bauer H. Acute renal vein thrombosis in renal allografts: detection with duplex Doppler US. Radiology. 1989. 170:557–558.22. Kribs SW, Rankin RN. Doppler ultrasonography after renal transplantation: value of reversed diastolic flow in diagnosing renal vein obstruction. Can Assoc Radiol J. 1993. 44:434–438.23. Keating MA, Althausen AF. The clinical spectrum of renal vein thrombosis. J Urol. 1985. 133:938–945.24. Rubin JM, Adler RS, Fowlkes JB, Spratt S, Pallister JE, Chen JF, et al. Fractional moving blood volume: estimation with power Doppler US. Radiology. 1995. 197:183–190.
- Full Text Links
-
- Actions
-
Cited
- CITED
-
- Close
- Share
-
- Similar articles
-
- Recanalization of Portal Vein Graft Occlusion via a Percutaneous Transmesenteric Approach: A Case Report
- Diagnosis of Acute Appendicitis: Comparison between Gray Scale, Color Doppler and Power Doppler US
- Power Doppler Sonography in Children with Acute Pyelonephritis
- Acute Basilar Artery Tip Thrombosis Presenting as Basilar-Subclavian Steal Phenomenon on Transcranial Doppler
- Three-Dimensional Power Doppler Imaging
