Interocular Symmetry of Optical Coherence Tomography Angiography Parameters in Normal Eyes of Korean Adults
- Affiliations
-
- 1Department of Ophthalmology, Chungnam National University Hospital, Daejeon, Korea. kimjy@cnu.ac.kr
- 2Department of Ophthalmology, Armed Forces Capital Hospital, Seongnam, Korea.
- KMID: 2453019
- DOI: http://doi.org/10.3341/jkos.2019.60.7.676
Abstract
- PURPOSE
To evaluate the interocular symmetry of microvascular parameters measured by optical coherence tomography angiography (OCTA) in normal eyes of Korean adults.
METHODS
We retrospectively reviewed the retinal microvascular structure of 91 healthy Korean subjects (182 eyes). We used OCTA to measure the area of the foveal avascular zone (FAZ), vessel density (VD), and perfusion density (PD) in both eyes. Intraclass correlation coefficients (ICCs), coefficients of variation (CVs), and Pearson correlation coefficients were calculated to evaluate the extent of agreement and correlations between binocular OCTA measurements.
RESULTS
Both eyes had similar microvascular characteristics: FAZ area (right eye: 0.31 ± 0.11 mm², left eye: 0.30 ± 0.10 mm², p = 0.98), FAZ perimeter (right eye: 2.35 ± 0.45 mm, left eye: 2.36 ± 0.39 mm, p = 0.86). VD 1-mm center (right eye: 9.42 ± 2.75, left eye: 9.14 ± 2.96, p = 0.163), full area (right eye: 19.94 ± 1.65, left eye: 19.72 ± 1.76, p = 0.285), and PD 1-mm center (right eye: 0.16 ± 0.05, left eye: 0.16 ± 0.05, p = 0.151), full area (right eye: 0.36 ± 0.03, left eye: 0.36 ± 0.04, p = 0.716). All ICC values were above 0.8 and all CVs below 10%.
CONCLUSIONS
The microvascular structure, as represented by the VD, PD, and FAZ area measured via OCTA, was bilaterally symmetric in normal eyes of Korean adults.
Keyword
MeSH Terms
Figure
-
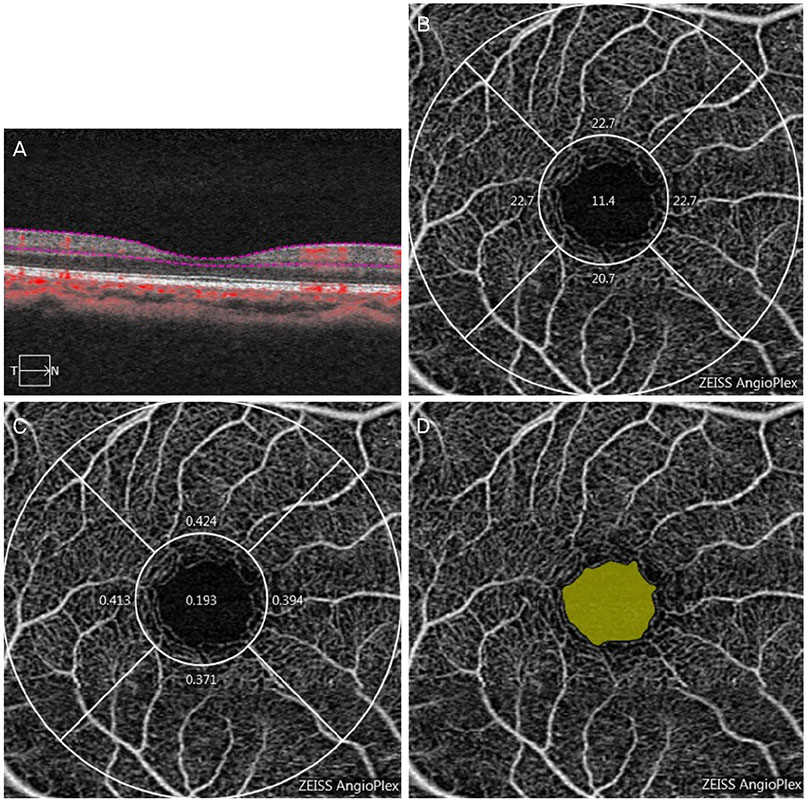
Figure 1 3 × 3 mm optical coherence tomography angiography image centered on the fovea in normal subject. (A) A B-scan showing the superficial capillary plexus between dash lines, (B) a superficial capillary plexus image overlaid with the Early Treatment of Diabetic Retinopathy Study grid. Vessel density measurement in individual subfield is calculated by AngioPlex software ver. 10.0 (Carl Zeiss Meidtec AG, Jena, Germany). (C) Perfusion density measurement in individual subfield is calculated by AngioPlex software. (D) Foveal avascular zone is automatically selected in the superficial capillary plexus and highlighted and its area, perimeter and circularity are quantitatively calculated by AngioPlex software.
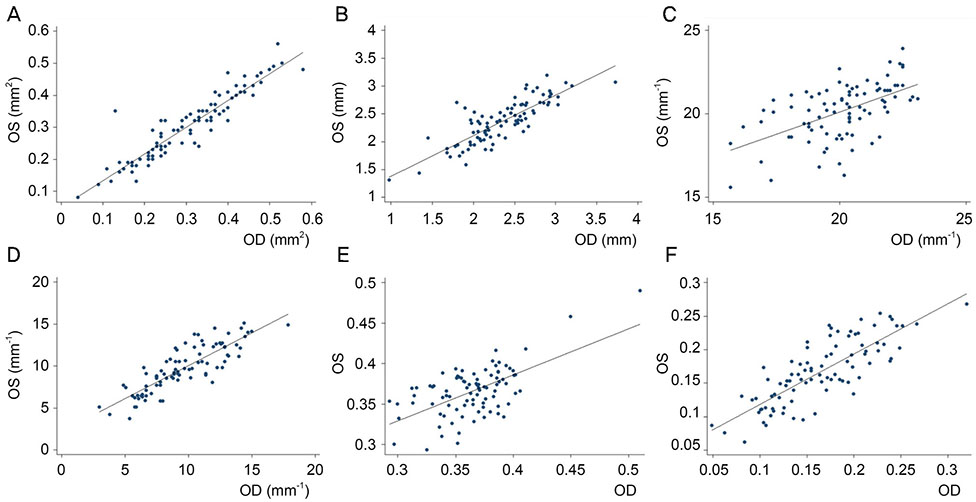
Figure 2 Scatter plots of the right and left eyes in optical coherence tomography angiography parameters. This plot shows interocular symmetry of foveal avascular zone area (A), foveal avascular zone perimeter (B), vessel density of full area (C) and 1 mm center (D), perfusion density of full area (E) and 1 mm center (F). OD = right eye, OS = left eye.

Figure 3 Histogram showing the distribution of interocular differences (right eye-left eye) in optical coherence tomography (OCT) and OCT angiography parameters. Foveal avascular zone (FAZ) area (A), FAZ perimeter (B), vessel density of full area (C) and 1 mm center (D), perfusion density of full area (E) and 1 mm center (F) of the interocular difference.
Reference
-
1. Buttery RG, Hinrichsen CF, Weller WL, Haight JR. How thick should a retina be? A comparative study of mammalian species with and without intraretinal vasculature. Vision Res. 1991; 31:169–187.
Article2. Tan PE, Yu PK, Balaratnasingam C, et al. Quantitative confocal imaging of the retinal microvasculature in the human retina. Invest Ophthalmol Vis Sci. 2012; 53:5728–5736.
Article3. Yannuzzi LA, Rohrer KT, Tindel LJ, et al. Fluorescein angiography complication survey. Ophthalmology. 1986; 93:611–617.
Article4. Wang Q, Chan S, Yang JY, et al. Vascular density in retina and choriocapillaris as measured by optical coherence tomography angiography. Am J Ophthalmol. 2016; 168:95–109.
Article5. Spaide RF, Klancnik JM Jr, Cooney MJ. Retinal vascular layers imaged by fluorescein angiography and optical coherence tomography angiography. JAMA Ophthalmol. 2015; 133:45–50.
Article6. Uzun S, Pehlivan E. Vascular density in retina and choriocapillaris as measured by optical coherence tomography angiography. Am J Ophthalmol. 2016; 169:290.
Article7. Parodi MB, Visintin F, Della Rupe P, Ravalico G. Foveal avascular zone in macular branch retinal vein occlusion. Int Ophthalmol. 1995; 19:25–28.
Article8. Kim AY, Chu Z, Shahidzadeh A, et al. Quantifying microvascular density and morphology in diabetic retinopathy using spectral-domain optical coherence tomography angiography. Invest Ophthalmol Vis Sci. 2016; 57:OCT362–OCT370.
Article9. Rosenfeld PJ, Durbin MK, Roisman L, et al. ZEISS Angioplex™ spectral domain optical coherence tomography angiography: technical aspects. Dev Ophthalmol. 2016; 56:18–29.
Article10. Durr GM, Auvinet E, Ong J, et al. Corneal shape, volume, and interocular symmetry: parameters to optimize the design of biosynthetic corneal substitutes. Invest Ophthalmol Vis Sci. 2015; 56:4275–4282.
Article11. Quigley HA, Enger C, Katz J, et al. Risk factors for the development of glaucomatous visual field loss in ocular hypertension. Arch Ophthalmol. 1994; 112:644–649.
Article12. Cartwright MJ, Anderson DR. Correlation of asymmetric damage with asymmetric intraocular pressure in normal-tension glaucoma (low-tension glaucoma). Arch Ophthalmol. 1988; 106:898–900.
Article13. Mwanza JC, Durbin MK, Budenz DL. Cirrus OCT Normative Database Study Group. Interocular symmetry in peripapillary retinal nerve fiber layer thickness measured with the Cirrus HD-OCT in healthy eyes. Am J Ophthalmol. 2011; 151:514–521.e1.
Article14. Lee SY, Jeoung JW, Park KH, Kim DM. Macular ganglion cell imaging study: interocular symmetry of ganglion cell-inner plexiform layer thickness in normal healthy eyes. Am J Ophthalmol. 2015; 159:315–323.e2.
Article15. Lim HB, Lee WH, Jo YJ, Kim JY. Interocular asymmetry of the ganglion cell-inner plexiform layer in diabetic retinopathy. Optom Vis Sci. 2018; 95:594–601.
Article16. Zhang A, Zhang Q, Chen CL, Wang RK. Methods and algorithms for optical coherence tomography-based angiography: a review and comparison. J Biomed Opt. 2015; 20:100901.
Article17. Bland JM, Altman DG. Measurement error. BMJ. 1996; 313:744.18. Cicchetti DV. Guidelines, criteria, and rules of thumb for evaluating normed and standardized assessment instruments in psychology. Psychological Assessment. 1994; 6:284.
Article19. Chen FK, Menghini M, Hansen A, et al. Intrasession repeatability and interocular symmetry of foveal avascular zone and retinal vessel density in OCT angiography. Transl Vis Sci Technol. 2018; 7:6.
Article20. Fang D, Tang FY, Huang H, et al. Repeatability, interocular correlation and agreement of quantitative swept-source optical coherence tomography angiography macular metrics in healthy subjects. Br J Ophthalmol. 2019; 103:415–420.
Article21. Liu G, Keyal K, Wang F. Interocular symmetry of vascular density and association with central macular thickness of healthy adults by optical coherence tomography angiography. Sci Rep. 2017; 7:16297.
Article22. Shahlaee A, Samara WA, Hsu J, et al. In vivo assessment of macular vascular density in healthy human eyes using optical coherence tomography angiography. Am J Ophthalmol. 2016; 165:39–46.23. Noh D, Ryu G, Sagong M. Analysis of foveal microvascular structures using optical coherence tomography angiography in age-stratified healthy Koreans. J Korean Ophthalmol Soc. 2017; 58:1058–1065.
Article
- Full Text Links
-
- Actions
-
Cited
- CITED
-
- Close
- Share
-
- Similar articles
-
- Availability of Optical Coherence Tomography in Diagnosis and Classification of Choroidal Neovascularization
- Symmetry of Optical Coherence Tomography Angiography Parameters between Dominant and Non-dominant Eyes in Healthy Koreans
- Symmetry of Peripapillary-Optical Coherence Tomography Angiography Parameters between Dominant and Non-dominant Eyes in Normal Eyes
- The Analysis of Peripapillary RNFL, Macula and Macular Ganglion Cell Layer Thickness in Patients with Monocular Amblyopia Using SD-OCT
- Peripapillary Perfusion Analysis Using Optical Coherence Tomography Angiography in Patients with Normal Tension Glaucoma
