Quantitative Assessment and Ligament Traceability of Volume Isotropic Turbo Spin Echo Acquisition (VISTA) Ankle Magnetic Resonance Imaging: Fat Suppression versus without Fat Suppression
- Affiliations
-
- 1Department of Radiology, Gangnam Severance Hospital, Yonsei University, Seoul, Korea. agn70@yuhs.ac
- 2Department of Radiology, Severance Hospital, Yonsei University College of Medicine, Seoul, Korea.
- KMID: 2099870
- DOI: http://doi.org/10.13104/jksmrm.2013.17.2.110
Abstract
- PURPOSE
To compare the image quality and ligament traceability in ankle images obtained using Volume Isotropic Turbo Spin Echo Acquisition (VISTA) MRI with and without fat suppression.
MATERIALS AND METHODS
The signal-to-noise ratios (SNRs) in images from a phantom and from the ankle of a volunteer were compared. Ten ankles from 10 non-symptomatic volunteers were imaged for comparisons of contrast ratio (CR) and ligament traceability. All examinations were performed using VISTA sequences with and without fat suppression on a 3T MRI scanner. The SNRs were obtained from images with subjects and without subjects (noise-only). Contrast ratios from images of the 10 ankles were acquired between fluid and tendon (F-T), F-cartilage (C), F-ligament (L), fat (f)-T, f-C and f-L. Two musculoskeletal radiologists independently scored the traceability of 7 ligaments, in sagittal, axial and coronal images respectively, based on a 4-point scale (1 as not traceable through 4 as clearly traceable). The Wilcoxon signed-rank test was used to compare the CR. Fisher's exact test and Pearson's chi-squared test were used to compare the ligament traceability.
RESULTS
The SNRs did not differ significantly between the two sequences except in bone marrow. VISTA SPAIR showed the higher CR only in F-T (p = 0.04), whereas VISTA showed higher CR in f-T (p = 0.005), f-C (p = 0.005) and f-L (p = 0.005). The calcaneofibular ligament traceability with VISTA was superior to that obtained with VISTA SPAIR (p < 0.05) in all planes.
CONCLUSION
VISTA showed significant superiority to VISTA SPAIR in tracing CFL due to the superior CR between fat and ligament.
MeSH Terms
Figure
-
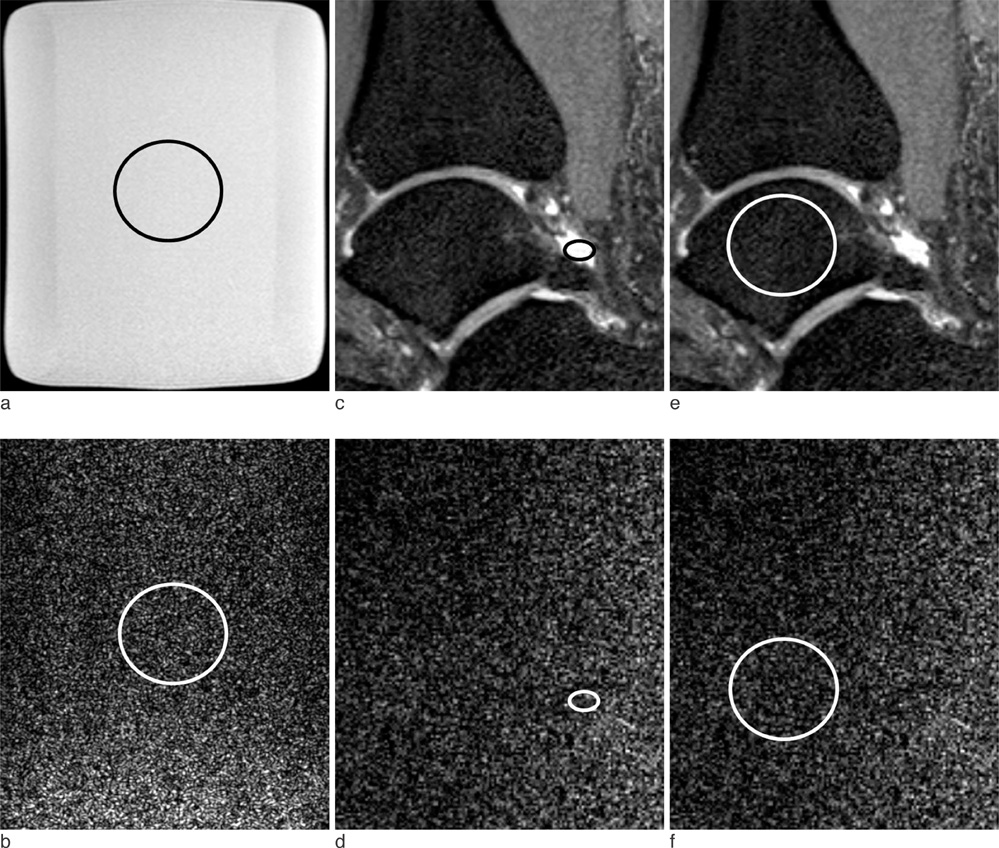
Fig. 1 Signal to noise ratio (SNR) analysis from images obtained from a phantom (a, b) and a non symptomatic volunteer (c-f) using Volume Isotropic Turbo Spin Echo Acquisition (VISTA) sequence. (a, b) A bottle phantom containing white mineral oil (liquid petroleum at 20℃) 27 cm in height with a 2000 ml capacity was scanned (a). To calculate the SNR, 430.12 mm2 sized region-of-interests (ROIs) were placed at the same position in the reconstructed object images (a) to measure mean signal intensities. The region-of-interest was duplicated in the noise-only reconstruction image (b) to measure noise on console. (c-f) ROIs were placed in the respective tissues, including fluid (c, d), cartilage (not seen), bone marrow (e, f) and muscle with the area as large as possible avoiding the inclusion of confounding structures.
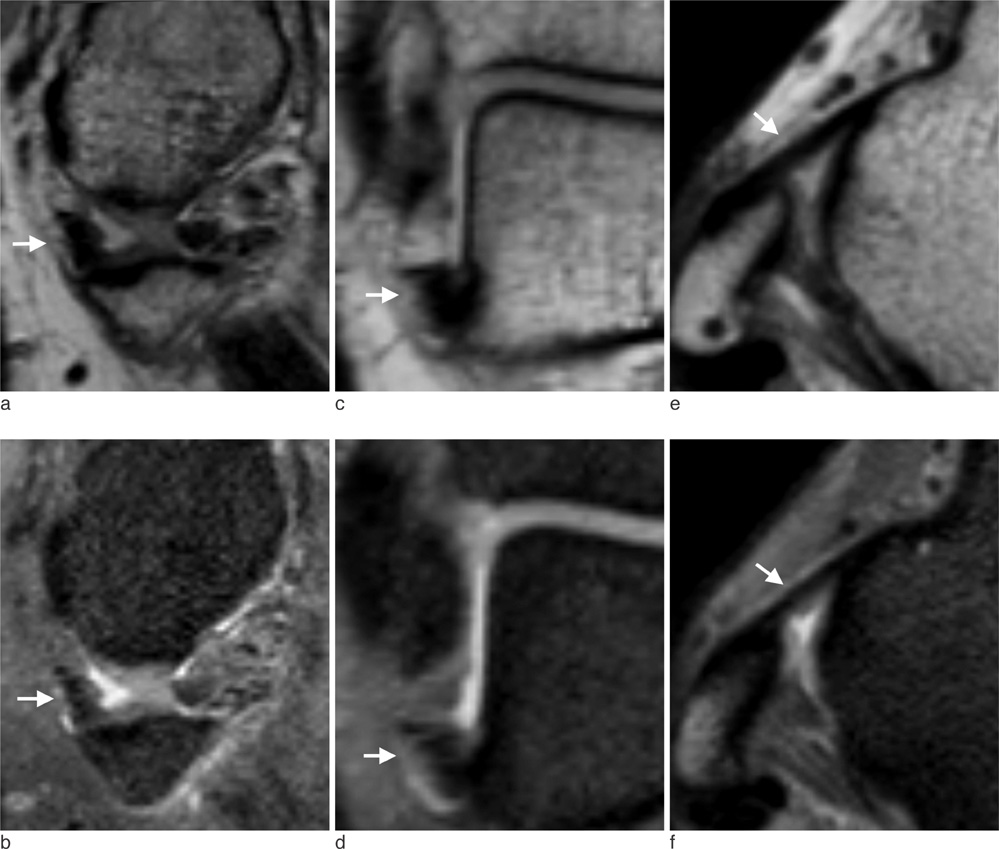
Fig. 2 MR images of right ankle in a 31-year-old man which showed similar traceability between VISTA and VISTA SPAIR of anterior talofibular ligament (ATFL). For both non-fat suppressed VISTA (a, c, e) and fat-suppressed (b, d, f) VISTA, both reader a and b gave high score traceability for ATFL (arrows) on sagittal (a, b), coronal (c, d) and axial (e, f) images.
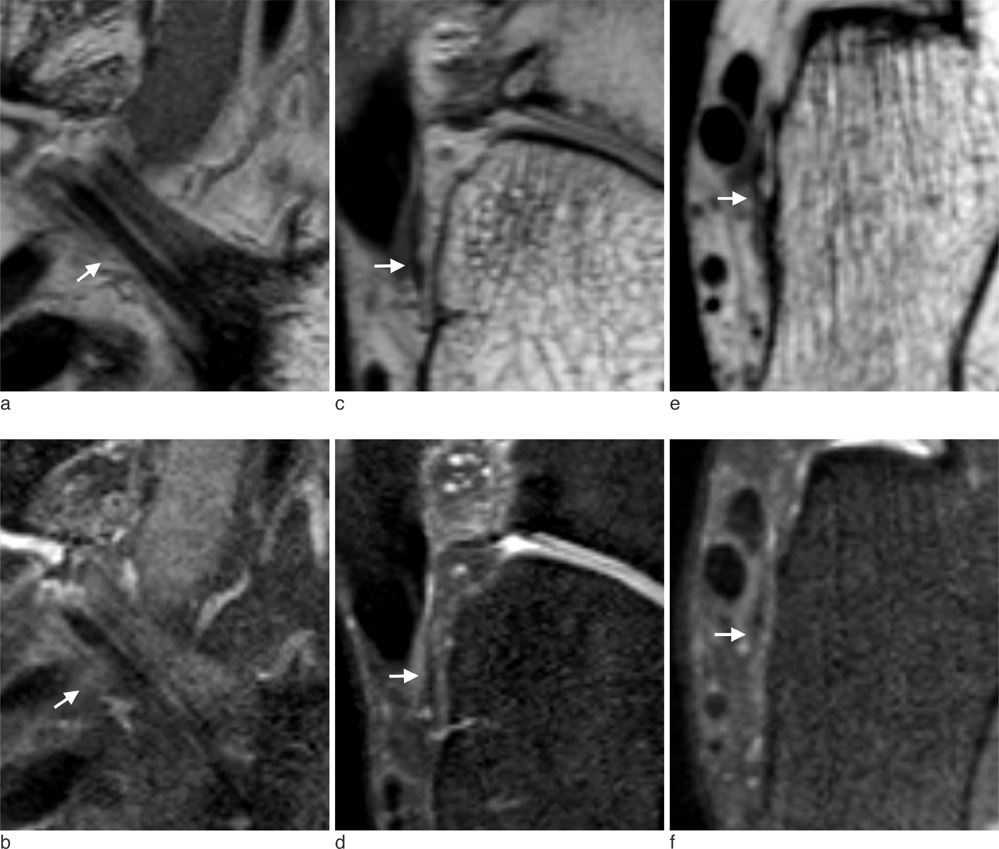
Fig. 3 MR images of right ankle in a 31-year-old man which showed similar traceability between VISTA and VISTA SPAIR of calcaneofibular ligament (CFL). For both non-fat suppressed VISTA (a, c, e) and fat-suppressed (b, d, f) VISTA, both reader a and b gave high score traceability for CFL (arrows) sagittal (a, b), coronal (c, d) and axial (e, f) images.
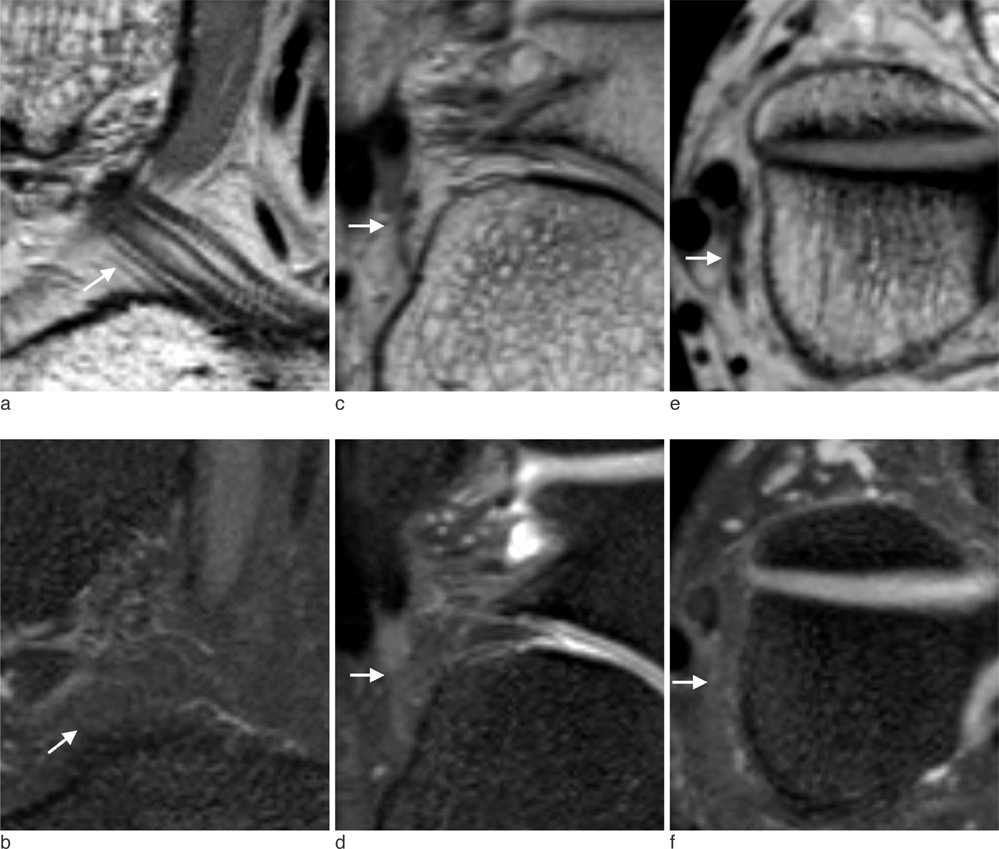
Fig. 4 MR images of right ankle in a 28-year-old man which showed significantly different traceability between VISTA and VISTA SPAIR of calcaneofibular ligament (CFL). For non-fat suppressed VISTA (a, c, e), reader a and b gave high score traceability for CFL (arrows) on sagittal (a), coronal (d) and axial (e) images. For fat suppressed VISTA (b, d, f), however, both readers gave score 1 or 2 for CFL (arrowheads) on sagittal (b), coronal (d), and axial images.
Cited by 1 articles
-
Three-Dimensional Fast Spin-Echo Imaging without Fat Suppression of the Knee: Diagnostic Accuracy Comparison to Fat-Suppressed Imaging on 1.5T MRI
Hee Woo Cho, Jin-Suck Suh, Jin-Oh Park, Hyoung-Sik Kim, Soo Yoon Chung, Young Han Lee, Seok Hahn
Yonsei Med J. 2017;58(6):1186-1194. doi: 10.3349/ymj.2017.58.6.1186.
Reference
-
1. Fong DT, Hong Y, Chan L, Yung PS, Chan K. A systematic review on ankle injury and ankle sprain in sports. Sports Med. 2007; 37:73–94.2. Kim HS, Yoon YC, Kwon JW, Choe B. Qualitative and quantitative assessment of isotropic ankle magnetic resonance imaging: three-dimensional isotropic intermediate-weighted turbo spin echo versus three-dimensional isotropic fast field echo sequences. Korean J Radiol. 2012; 13:443–449.3. Gold GE, Chen CA, Koo S, Hargreaves BA, Bangerter NK. Recent advances in MRI of articular cartilage. AJR Am J Roentgenol. 2009; 193:628–638.4. Stevens KJ, Busse RF, Han E, et al. Ankle: isotropic MR imaging with 3D-FSE-cube--initial experience in healthy volunteers. Radiology. 2008; 249:1026–1033.5. Yao L, Pitts JT, Thomasson D. Isotropic 3D fast spin-echo with proton-density-like contrast: a comprehensive approach to musculoskeletal MRI. AJR Am J Roentgenol. 2007; 188:W199–W201.6. Gold GE, Busse RF, Beehler C, et al. Isotropic MRI of the knee with 3D fast spin-echo extended echo-train acquisition (XETA): initial experience. AJR Am J Roentgenol. 2007; 188:1287–1293.7. Jung JY, Yoon YC, Kwon JW, Ahn JH, Choe BK. Diagnosis of internal derangement of the knee at 3.0-T MR imaging: 3D isotropic intermediate-weighted versus 2D sequences. Radiology. 2009; 253:780–787.8. Ristow O, Stehling C, Krug R, et al. Isotropic 3-dimensional fast spin echo imaging versus standard 2-dimensional imaging at 3.0 T of the knee: artificial cartilage and meniscal lesions in a porcine model. J Comput Assist Tomogr. 2010; 34:260–269.9. Notohamiprodjo M, Horng A, Pietschmann MF, et al. MRI of the knee at 3T: first clinical results with an isotropic PDfs-weighted 3D-TSE-sequence. Invest Radiol. 2009; 44:585–597.10. Jung JY, Yoon YC, Choi S, Kwon JW, Yoo J, Choe B. Three-dimensional isotropic shoulder MR arthrography: comparison with two-dimensional MR arthrography for the diagnosis of labral lesions at 3.0 T. Radiology. 2009; 250:498–505.11. Choo HJ, Lee SJ, Kim O, Seo SS, Kim JH. Comparison of three-dimensional isotropic T1-weighted fast spin-echo MR arthrography with two-dimensional MR arthrography of the shoulder. Radiology. 2012; 262:921–931.12. Notohamiprodjo M, Kuschel B, Horng A, et al. 3D-MRI of the ankle with optimized 3D-SPACE. Invest Radiol. 2012; 47:231–239.13. Delfaut EM, Beltran J, Johnson G, Rousseau J, Marchandise X, Cotten A. Fat suppression in MR imaging: techniques and pitfalls. Radiographics. 1999; 19:373–382.14. Lee S, Jee W, Kim SK, Kim J. Proton density-weighted MR imaging of the knee: fat suppression versus without fat suppression. Skeletal Radiol. 2011; 40:189–195.15. Schäfer FK, Schfer PJ, Brossmann J, et al. Value of fat-suppressed proton-density-weighted turbo spin-echo sequences in detecting meniscal lesions: comparison with arthroscopy. Acta Radiol. 2006; 47:385–390.16. Seo JM, Yoon YC, Kwon JW. 3D isotropic turbo spin-echo intermediate-weighted sequence with refocusing control in knee imaging: comparison study with 3D isotropic fast-field echo sequence. Acta Radiol. 2011; 52:1119–1124.17. Dietrich O, Raya JG, Reeder SB, Reiser MF, Schoenberg SO. Measurement of signal-to-noise ratios in MR images: influence of multichannel coils, parallel imaging, and reconstruction filters. J Magn Reson Imaging. 2007; 26:375–385.18. Viera AJ, Garrett JM. Understanding interobserver agreement: the kappa statistic. Fam Med. 2005; 37:360–363.19. Gudbjartsson H, Patz S. The Rician distribution of noisy MRI data. Magn Reson Med. 1995; 34:910–914.20. Nelles M, Konig RS, Gieseke J, et al. Dual-source parallel RF transmission for clinical MR imaging of the spine at 3.0 T: intraindividual comparison with conventional single-source transmission. Radiology. 2010; 257:743–775.21. Turetschek K, Wunderbaldinger P, Bankier AA, et al. Double inversion recovery imaging of the brain: initial experience and comparison with fluid attenuated inversion recovery imaging. Magn Reson Imaging. 1998; 16:127–135.22. Crewson PE. Reader agreement studies. AJR Am J Roentgenol. 2005; 184:1391–1397.23. Kundel HL, Polansky M. Measurement of observer agreement. Radiology. 2003; 228:303–308.24. Wang Z, Fernndez-Seara MA. 2D partially parallel imaging with k-space surrounding neighbors-based data reconstruction. Magn Reson Med. 2006; 56:1389–1396.25. Noll DC, Nishimura DG, Macovski A. Homodyne detection in magnetic resonance imaging. IEEE Trans Med Imaging. 1991; 10:154–163.26. Singson RD, Hoang T, Dan S, Friedman M. MR evaluation of rotator cuff pathology using T2-weighted fast spin-echo technique with and without fat suppression. AJR Am J Roentgenol. 1996; 166:1061–1065.27. Chimich D, Frank C, Shrive N, Dougall H, Bray R. The effects of initial end contact on medial collateral ligament healing: a morphological and biomechanical study in a rabbit model. J Orthop Res. 1991; 9:37–47.28. Brostrm L, Sundelin P. Sprained ankles. IV. Histologic changes in recent and "chronic" ligament ruptures. Acta Chir Scand. 1966; 132:248–253.29. Datir A, Connell D. Imaging of impingement lesions in the ankle. Top Magn Reson Imaging. 2010; 21:15–23.30. Kitsoulis P, Marini A, Pseftinakou A, Iliou K, Galani V, Paraskevas G. Morphological study of the calcaneofibular ligament in cadavers. Folia Morphol (Warsz). 2011; 70:180–184.31. Dimmick S, Kennedy D, Daunt N. Evaluation of thickness and appearance of anterior talofibular and calcaneofibular ligaments in normal versus abnormal ankles with MRI. J Med Imaging Radiat Oncol. 2008; 52:559–563.32. Mirowitz SA, Shu HH. MR imaging evaluation of knee collateral ligaments and related injuries: comparison of T1-weighted, T2-weighted, and fat-saturated T2-weighted sequences--correlation with clinical findings. J Magn Reson Imaging. 1994; 4:725–732.33. Schneck CD, Mesgarzadeh M, Bonakdarpour A. MR imaging of the most commonly injured ankle ligaments. Part II. Ligament injuries. Radiology. 1992; 184:507–512.34. Cass JR, Morrey BF. Ankle instability: current concepts, diagnosis, and treatment. Mayo Clin Proc. 1984; 59:165–170.35. Kumar V. Deficiencies of MRI in the diagnosis of chronic symptomatic lateral ankle ligament injuries. Foot Ankle Surg. 2007; 13:171–176.36. Park HJ, Cha SD, Kim SS, et al. Accuracy of MRI findings in chronic lateral ankle ligament injury: comparison with surgical findings. Clin Radiol. 2012; 67:313–318.
- Full Text Links
-
- Actions
-
Cited
- CITED
-
- Close
- Share
-
- Similar articles
-
- Qualitative and Quantitative Assessment of Isotropic Ankle Magnetic Resonance Imaging: Three-Dimensional Isotropic Intermediate-Weighted Turbo Spin Echo versus Three-Dimensional Isotropic Fast Field Echo Sequences
- MRI of Normal Pancreas: Comparison of T2-Weighted Pulse Sequences Using Turbo Spin Echo, Turbo Spin Echo with Fat Suppression, HASTE and HASTE with Fat Suppression
- MR Imaging of the Spine at 3.0T with T2-Weighted IDEAL Fast Recovery Fast Spin-Echo Technique
- Fast Spin-Echo T2-Weighted MR Imaging of Tongue Cancer: the Value of Fat-suppression
- Contrast-Enhanced High-Resolution Intracranial Vessel Wall MRI with Compressed Sensing: Comparison with Conventional T1 Volumetric Isotropic Turbo Spin Echo Acquisition Sequence
